- +1-315-215-1633
- sales@thebrainyinsights.com

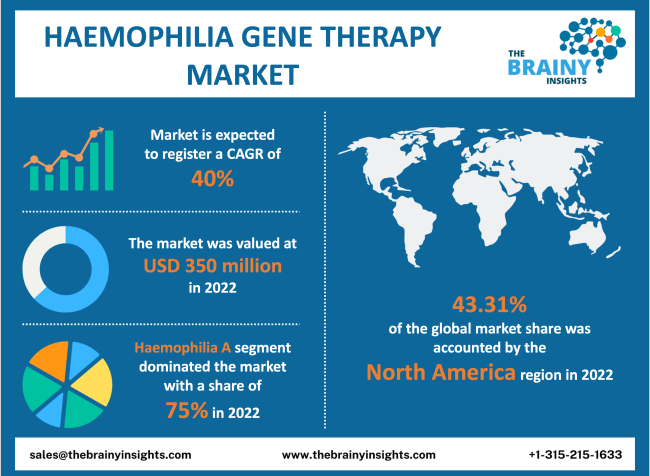
The global haemophilia gene therapy market is expected to grow from USD 350 million in 2022 to USD 5165.26 million by 2030, at a CAGR of 40% during the forecast period 2022-2030. The North American haemophilia gene therapy market is expected to maintain its dominance during the forecast period.
The blood in the human body has several constituents. They each have their unique function. Blood is a connective tissue. Its constituents are RBC, WBC, and platelets. The RBC carries oxygen from the heart to all body parts and carbon dioxide from every part of the body back to the heart. The WBC cells are necessary for the immune system to function. They are vital for fighting diseases and infections. Platelets are responsible for blood clotting in case of injuries. They are essential to stop bleeding and prevent excessive blood loss, which is life-threatening. Haemophilia is a blood disorder wherein the bleeding does not stop, or the blood does not clot. The bleeding may result from an injury, or it can occur during surgery. The bleeding can be both internal and external. Haemophilia is an inherited disorder. The genes passed on from the mother and father can sometimes lead to the absence of factor VII or factor IX, which are vital for blood clotting. The absence of these factors leads to haemophilia. The symptoms of haemophilia include deep bruises, blood in urine, and bleeding in joints or the brain. Females can experience long periods. Haemophilia can be fatal in case of major injuries. Such a condition can also prevent individuals from opting for life-saving surgeries. Internal bleeding in vital organs can lead to death. It is found in babies, or it can also be diagnosed at a later stage in life. Haemophilia gene therapy introduces a healthy gene which can form blood clots and cures the condition. The advancement in genetic studies will further the development of the global haemophilia gene therapy market. The increasing incidence of haemophilia can contribute to the market's growth during the forecast period.
Get an overview of this study by requesting a free sample
December 2022 - Hemgenix, a gene therapy developed by CSL Behring and uniQure, was approved three weeks ago. The therapy treats haemophilia B. Hemgenix produced mean factor IX activity of 39.0 IU/dL (39%) at six months in the trial of 54 adult male participants. Patients in the trial had factor IX concentrations that were frequently less than 2%. According to trial investigator Steven Pipe, M.D., of the University of Michigan, the non-hemophilic range starts at about 40%. At 18 months, there was a little decline in factor IX activity, with the mean level being 36.9 IU/dL (36.9%). Twenty-four months later, the number was 36.7.
December 2022 - According to data from a Phase 3 trial, Hemgenix, the first and only approved gene therapy for adults with haemophilia B, maintained its favourable safety and effectiveness profile for two years, according to CSL Behring. The results were broadly consistent with earlier trial assessments, which concluded that the therapy was safe, had the potential to reduce bleeding rates, and allowed patients to stop utilizing preventative factor replacement medications. The blood clotting protein factor IX (FIX), absent in haemophilia B, was also increased by hemgenix. The U.S. Food and Drug Administration recently approved the therapy for adult haemophilia B patients in light of the pivotal HOPE-B trial's results.
December 2022 - Takeda is seeing promising preclinical evidence on the firm's P-FVIII-101 haemophilia A medication due to its $3.6 billion merger with Poseida Therapeutics. Poseida reported that a single dose of P-FVIII-101 restored levels of the lacking clotting factor VIII protein in young mice over a period of seven months in an oral presentation at the annual conference of the American Society of Hematology on December 11, 2022.
The rising prevalence of haemophilia – as much as haemophilia is categorized as a rare disease or condition by international healthcare organizations, there has been a concerning rise in the number of haemophilia patients globally. There has been an equally concerning rise of haemophilia in all demographics. Haemophilia is a hereditary condition that can be managed and not treated with the current state of healthcare advancements. Haemophilia gene therapy is a reformative process that can completely cure the suffering individual and improve their life over the long term. With greater healthcare finance and government initiatives concerned with offering treatment for the rarest diseases, the adoption of haemophilia gene therapy is likely to rise. Therefore, the rising prevalence of haemophilia will drive the global haemophilia gene therapy market.
Haemophilia gene therapy is expensive – extensive research goes into understanding the causes of a disease or hereditary condition. Millions are poured into understanding the disease and then developing possible treatment options. However, not every research or developmental endeavour will necessarily lead to successful results. The successful ones have utilized extensive amounts of capital. The development of gene therapies takes a significant amount of time and is costly. Genetic engineering or gene editing is a new medical field that is still in the nascent stages of growth and is not accessible to everyone. Therefore, a limited number of players are operating in the gene therapy field. Therefore, the capital utilized in the research needs to be recovered to continue developing better treatment options. The limited number of players in the market allows them to demand higher prices for these therapies, given their significant influence over the market. The expensive nature of haemophilia gene therapy will limit the market's growth.
Growing research and development in gene therapy – the growing technological advancements have enabled scientists to dwell deep into genetics and harness its potential in solving modern-day healthcare problems. Several scientific breakthroughs and the development of scientific techniques have shown promising results in resolving health issues that were rendered untreatable during previous years. Big pharmaceutical giants, biotechnology companies and government institutions collaborate to develop advanced drugs, therapies, and medical devices. The pooling of resources rendered by such collaborations and increased government funding towards medicine has all opened up newer opportunities in the haemophilia gene therapy market.
Lack of awareness – haemophilia is a rare condition affecting around 400k people globally. There is a lack of awareness in the general public amount the condition, its causes and its symptoms. A significant portion of the patient pool is unaware of their condition given the lack of knowledge about the disease, absence of proper messaging from the government and insufficient diagnostics infrastructure in most countries. Furthermore, the condition is managed with the help of several drugs available in the market, and these drugs work enough for patients to not switch to a rather expensive gene therapy. Drugs are conveniently cheaper than gene therapy. Additionally, haemophilia gene therapy has not yet established itself as a significantly effective treatment option, thereby challenging the market's growth in the forecast period.
The regions analyzed for the market include North America, Europe, South America, Asia Pacific, the Middle East, and Africa. The North American region emerged as the largest global haemophilia gene therapy market, with a 43.31% market revenue share in 2022. The presence of a significant population suffering from haemophilia is one of the primary drivers of the market. The well-established healthcare infrastructure with an advanced and extensive diagnostics network enables early identification of haemophilia, and further treatments are offered as quickly. The rising prevalence of the condition in the middle-aged group will also aid market growth. The well-established paediatric care is a significant secondary driver that facilitates early detection and treatment of haemophilia in babies. Large pharmaceutical and biotechnology companies are driven by research and development in gene therapies. A strong scientific community with a robust research infrastructure have led to several scientific breakthroughs that have paved the way for harnessing the potential of gene therapies in treating several inherited conditions, including haemophilia. The wide network of insurance coverage and government healthcare packages supports the market's growth.
North America Region Haemophilia Gene Therapy Market Share in 2022 - 43.31%
www.thebrainyinsights.com
Check the geographical analysis of this market by requesting a free sample
The indication segment is divided into haemophilia A and haemophilia B. The haemophilia A segment dominated the market with a market share of around 75% in 2022. Haemophilia A is a bleeding disorder caused due to the absence of factor VII in the baby's genes. It is also known as classic haemophilia. Factor gene plays a significant role in blood clotting. Males are more susceptible to this genetic disorder. For instance, there were 400 babies born in the U.S. with haemophilia A in 2021. Similar statistics are present globally. The lack of proper healthcare infrastructure in low-and-middle-income countries leads to insufficient or no data/statistics on this condition. Haemophilia is expected to dominate the market, given its significant prevalence worldwide.
| Attribute | Description |
|---|---|
| Market Size | Revenue (USD Million) |
| Market size value in 2022 | USD 350 Million |
| Market size value in 2030 | USD 5165.26 Million |
| CAGR (2022 to 2030) | 40% |
| Historical data | 2019-2020 |
| Base Year | 2021 |
| Forecast | 2022-2030 |
| Segments | The research segment is based on the indication. |
| Regional Segments | The regions examined for the market are Europe, Asia Pacific, North America, South America, and Middle East & Africa. |
As per The Brainy Insights, the size of the haemophilia gene therapy market was valued at USD 350 million in 2022 to USD 5165.26 million by 2030.
Global haemophilia gene therapy market is growing at a CAGR of 40% during the forecast period 2022-2030.
The market's growth will be influenced by the rising prevalence of haemophilia.
The expensive nature of haemophilia gene therapy could hamper the market growth.
1. Introduction
1.1. Objectives of the Study
1.2. Market Definition
1.3. Research Scope
1.4. Currency
1.5. Key Target Audience
2. Research Methodology and Assumptions
3. Executive Summary
4. Premium Insights
4.1. Porter’s Five Forces Analysis
4.2. Value Chain Analysis
4.3. Top Investment Pockets
4.3.1. Market Attractiveness Analysis By Indication
4.3.2. Market Attractiveness Analysis By Region
4.4. Industry Trends
5. Market Dynamics
5.1. Market Evaluation
5.2. Drivers
5.2.1. The rising prevalence of haemophilia
5.3. Restraints
5.3.1. Haemophilia gene therapy is expensive
5.4. Opportunities
5.4.1. Growing research and development in gene therapy
5.5. Challenges
5.5.1. Lack of awareness
6. Global Haemophilia Gene Therapy Market Analysis and Forecast, By Indication
6.1. Segment Overview
6.2. Haemophilia A
6.3. Haemophilia B
7. Global Haemophilia Gene Therapy Market Analysis and Forecast, By Regional Analysis
7.1. Segment Overview
7.2. North America
7.2.1. U.S.
7.2.2. Canada
7.2.3. Mexico
7.3. Europe
7.3.1. Germany
7.3.2. France
7.3.3. U.K.
7.3.4. Italy
7.3.5. Spain
7.4. Asia-Pacific
7.4.1. Japan
7.4.2. China
7.4.3. India
7.5. South America
7.5.1. Brazil
7.6. Middle East and Africa
7.6.1. UAE
7.6.2. South Africa
8. Global Haemophilia Gene Therapy Market-Competitive Landscape
8.1. Overview
8.2. Market Share of Key Players in the Haemophilia Gene Therapy Market
8.2.1. Global Company Market Share
8.2.2. North America Company Market Share
8.2.3. Europe Company Market Share
8.2.4. APAC Company Market Share
8.3. Competitive Situations and Trends
8.3.1. Product Launches and Developments
8.3.2. Partnerships, Collaborations, and Agreements
8.3.3. Mergers & Acquisitions
8.3.4. Expansions
9. Company Profiles
9.1. BioMarin Pharmaceuticals Inc.
9.1.1. Business Overview
9.1.2. Company Snapshot
9.1.3. Company Market Share Analysis
9.1.4. Company Product Portfolio
9.1.5. Recent Developments
9.1.6. SWOT Analysis
9.2. F Hoffmann-La Roche
9.2.1. Business Overview
9.2.2. Company Snapshot
9.2.3. Company Market Share Analysis
9.2.4. Company Product Portfolio
9.2.5. Recent Developments
9.2.6. SWOT Analysis
9.3. Freeline Therapeutics
9.3.1. Business Overview
9.3.2. Company Snapshot
9.3.3. Company Market Share Analysis
9.3.4. Company Product Portfolio
9.3.5. Recent Developments
9.3.6. SWOT Analysis
9.4. Pfizer
9.4.1. Business Overview
9.4.2. Company Snapshot
9.4.3. Company Market Share Analysis
9.4.4. Company Product Portfolio
9.4.5. Recent Developments
9.4.6. SWOT Analysis
9.5. Sangamo Therapeutics Inc.
9.5.1. Business Overview
9.5.2. Company Snapshot
9.5.3. Company Market Share Analysis
9.5.4. Company Product Portfolio
9.5.5. Recent Developments
9.5.6. SWOT Analysis
9.6. Shire PLC
9.6.1. Business Overview
9.6.2. Company Snapshot
9.6.3. Company Market Share Analysis
9.6.4. Company Product Portfolio
9.6.5. Recent Developments
9.6.6. SWOT Analysis
9.7. Spark Therapeutics
9.7.1. Business Overview
9.7.2. Company Snapshot
9.7.3. Company Market Share Analysis
9.7.4. Company Product Portfolio
9.7.5. Recent Developments
9.7.6. SWOT Analysis
9.8. Ultragenyx Pharmaceuticals
9.8.1. Business Overview
9.8.2. Company Snapshot
9.8.3. Company Market Share Analysis
9.8.4. Company Product Portfolio
9.8.5. Recent Developments
9.8.6. SWOT Analysis
9.9. uniQure NV
9.9.1. Business Overview
9.9.2. Company Snapshot
9.9.3. Company Market Share Analysis
9.9.4. Company Product Portfolio
9.9.5. Recent Developments
9.9.6. SWOT Analysis
9.10. Zoetis
9.10.1. Business Overview
9.10.2. Company Snapshot
9.10.3. Company Market Share Analysis
9.10.4. Company Component Portfolio
9.10.5. Recent Developments
9.10.6. SWOT Analysis
List of Table
1. Global Haemophilia Gene Therapy Market, By Indication, 2019-2030 (USD Million)
2. Global Haemophilia A Haemophilia Gene Therapy Market, By Region, 2019-2030 (USD Million)
3. Global Haemophilia B Haemophilia Gene Therapy Market, By Region, 2019-2030 (USD Million)
4. Global Haemophilia Gene Therapy Market, By Region, 2019-2030 (USD Million)
5. North America Haemophilia Gene Therapy Market, By Indication, 2019-2030 (USD Million)
6. U.S. Haemophilia Gene Therapy Market, By Indication, 2019-2030 (USD Million)
7. Canada Haemophilia Gene Therapy Market, By Indication, 2019-2030 (USD Million)
8. Mexico Haemophilia Gene Therapy Market, By Indication, 2019-2030 (USD Million)
9. Europe Haemophilia Gene Therapy Market, By Indication, 2019-2030 (USD Million)
10. Germany Haemophilia Gene Therapy Market, By Indication, 2019-2030 (USD Million)
11. France Haemophilia Gene Therapy Market, By Indication, 2019-2030 (USD Million)
12. U.K. Haemophilia Gene Therapy Market, By Indication, 2019-2030 (USD Million)
13. Italy Haemophilia Gene Therapy Market, By Indication, 2019-2030 (USD Million)
14. Spain Haemophilia Gene Therapy Market, By Indication, 2019-2030 (USD Million)
15. Asia Pacific Haemophilia Gene Therapy Market, By Indication, 2019-2030 (USD Million)
16. Japan Haemophilia Gene Therapy Market, By Indication, 2019-2030 (USD Million)
17. China Haemophilia Gene Therapy Market, By Indication, 2019-2030 (USD Million)
18. India Haemophilia Gene Therapy Market, By Indication, 2019-2030 (USD Million)
19. South America Haemophilia Gene Therapy Market, By Indication, 2019-2030 (USD Million)
20. Brazil Haemophilia Gene Therapy Market, By Indication, 2019-2030 (USD Million)
21. Middle East and Africa Haemophilia Gene Therapy Market, By Indication, 2019-2030 (USD Million)
22. UAE Haemophilia Gene Therapy Market, By Indication, 2019-2030 (USD Million)
23. South Africa Haemophilia Gene Therapy Market, By Indication, 2019-2030 (USD Million)
List of Figures
1. Global Haemophilia Gene Therapy Market Segmentation
2. Haemophilia Gene Therapy Market: Research Methodology
3. Market Size Estimation Methodology: Bottom-Up Approach
4. Market Size Estimation Methodology: Top-Down Approach
5. Data Triangulation
6. Porter’s Five Forces Analysis
7. Value Chain Analysis
8. Global Haemophilia Gene Therapy Market Attractiveness Analysis By Indication
9. Global Haemophilia Gene Therapy Market Attractiveness Analysis By Region
10. Global Haemophilia Gene Therapy Market: Dynamics
11. Global Haemophilia Gene Therapy Market Share by Indication (2022 & 2030)
12. Global Haemophilia Gene Therapy Market Share by Regions (2022 & 2030)
13. Global Haemophilia Gene Therapy Market Share by Company (2021)
This study forecasts revenue at global, regional, and country levels from 2019 to 2030. The Brainy Insights has segmented the haemophilia Gene Therapy market based on below mentioned segments:
Haemophilia Gene Therapy Market by Indication:
Haemophilia Gene Therapy Market by Region:
Research has its special purpose to undertake marketing efficiently. In this competitive scenario, businesses need information across all industry verticals; the information about customer wants, market demand, competition, industry trends, distribution channels etc. This information needs to be updated regularly because businesses operate in a dynamic environment. Our organization, The Brainy Insights incorporates scientific and systematic research procedures in order to get proper market insights and industry analysis for overall business success. The analysis consists of studying the market from a miniscule level wherein we implement statistical tools which helps us in examining the data with accuracy and precision.
Our research reports feature both; quantitative and qualitative aspects for any market. Qualitative information for any market research process are fundamental because they reveal the customer needs and wants, usage and consumption for any product/service related to a specific industry. This in turn aids the marketers/investors in knowing certain perceptions of the customers. Qualitative research can enlighten about the different product concepts and designs along with unique service offering that in turn, helps define marketing problems and generate opportunities. On the other hand, quantitative research engages with the data collection process through interviews, e-mail interactions, surveys and pilot studies. Quantitative aspects for the market research are useful to validate the hypotheses generated during qualitative research method, explore empirical patterns in the data with the help of statistical tools, and finally make the market estimations.
The Brainy Insights offers comprehensive research and analysis, based on a wide assortment of factual insights gained through interviews with CXOs and global experts and secondary data from reliable sources. Our analysts and industry specialist assume vital roles in building up statistical tools and analysis models, which are used to analyse the data and arrive at accurate insights with exceedingly informative research discoveries. The data provided by our organization have proven precious to a diverse range of companies, facilitating them to address issues such as determining which products/services are the most appealing, whether or not customers use the product in the manner anticipated, the purchasing intentions of the market and many others.
Our research methodology encompasses an idyllic combination of primary and secondary initiatives. Key phases involved in this process are listed below:

The phase involves the gathering and collecting of market data and its related information with the help of different sources & research procedures.

The data procurement stage involves in data gathering and collecting through various data sources.
This stage involves in extensive research. These data sources includes:
Purchased Database: Purchased databases play a crucial role in estimating the market sizes irrespective of the domain. Our purchased database includes:
Primary Research: The Brainy Insights interacts with leading companies and experts of the concerned domain to develop the analyst team’s market understanding and expertise. It improves and substantiates every single data presented in the market reports. Primary research mainly involves in telephonic interviews, E-mail interactions and face-to-face interviews with the raw material providers, manufacturers/producers, distributors, & independent consultants. The interviews that we conduct provides valuable data on market size and industry growth trends prevailing in the market. Our organization also conducts surveys with the various industry experts in order to gain overall insights of the industry/market. For instance, in healthcare industry we conduct surveys with the pharmacists, doctors, surgeons and nurses in order to gain insights and key information of a medical product/device/equipment which the customers are going to usage. Surveys are conducted in the form of questionnaire designed by our own analyst team. Surveys plays an important role in primary research because surveys helps us to identify the key target audiences of the market. Additionally, surveys helps to identify the key target audience engaged with the market. Our survey team conducts the survey by targeting the key audience, thus gaining insights from them. Based on the perspectives of the customers, this information is utilized to formulate market strategies. Moreover, market surveys helps us to understand the current competitive situation of the industry. To be precise, our survey process typically involve with the 360 analysis of the market. This analytical process begins by identifying the prospective customers for a product or service related to the market/industry to obtain data on how a product/service could fit into customers’ lives.

Secondary Research: The secondary data sources includes information published by the on-profit organizations such as World bank, WHO, company fillings, investor presentations, annual reports, national government documents, statistical databases, blogs, articles, white papers and others. From the annual report, we analyse a company’s revenue to understand the key segment and market share of that organization in a particular region. We analyse the company websites and adopt the product mapping technique which is important for deriving the segment revenue. In the product mapping method, we select and categorize the products offered by the companies catering to domain specific market, deduce the product revenue for each of the companies so as to get overall estimation of the market size. We also source data and analyses trends based on information received from supply side and demand side intermediaries in the value chain. The supply side denotes the data gathered from supplier, distributor, wholesaler and the demand side illustrates the data gathered from the end customers for respective market domain.

The supply side for a domain specific market is analysed by:
The demand side for the market is estimated through:
In-house Library: Apart from these third-party sources, we have our in-house library of qualitative and quantitative information. Our in-house database includes market data for various industry and domains. These data are updated on regular basis as per the changing market scenario. Our library includes, historic databases, internal audit reports and archives.
Sometimes there are instances where there is no metadata or raw data available for any domain specific market. For those cases, we use our expertise to forecast and estimate the market size in order to generate comprehensive data sets. Our analyst team adopt a robust research technique in order to produce the estimates:
Data Synthesis: This stage involves the analysis & mapping of all the information obtained from the previous step. It also involves in scrutinizing the data for any discrepancy observed while data gathering related to the market. The data is collected with consideration to the heterogeneity of sources. Robust scientific techniques are in place for synthesizing disparate data sets and provide the essential contextual information that can orient market strategies. The Brainy Insights has extensive experience in data synthesis where the data passes through various stages:


Market Deduction & Formulation: The final stage comprises of assigning data points at appropriate market spaces so as to deduce feasible conclusions. Analyst perspective & subject matter expert based holistic form of market sizing coupled with industry analysis also plays a crucial role in this stage.
This stage involves in finalization of the market size and numbers that we have collected from data integration step. With data interpolation, it is made sure that there is no gap in the market data. Successful trend analysis is done by our analysts using extrapolation techniques, which provide the best possible forecasts for the market.
Data Validation & Market Feedback: Validation is the most important step in the process. Validation & re-validation via an intricately designed process helps us finalize data-points to be used for final calculations.

The Brainy Insights interacts with leading companies and experts of the concerned domain to develop the analyst team’s market understanding and expertise. It improves and substantiates every single data presented in the market reports. The data validation interview and discussion panels are typically composed of the most experienced industry members. The participants include, however, are not limited to:
Moreover, we always validate our data and findings through primary respondents from all the major regions we are working on.


Free Customization
Fortune 500 Clients
Free Yearly Update On Purchase Of Multi/Corporate License
Companies Served Till Date