- +1-315-215-1633
- sales@thebrainyinsights.com

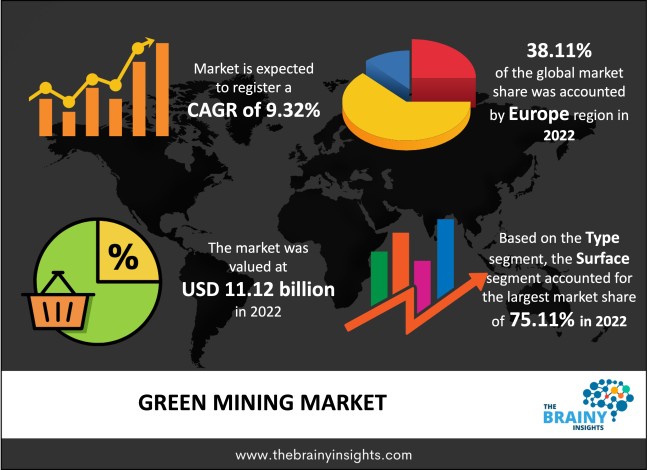
The global green mining market was valued at USD 11.12 Billion in 2022 and grew at a CAGR of 9.32% from 2023 to 2032. The market is expected to reach USD 27.10 Billion by 2032. The demand for green mining is increasing due to the rise in the adoption of clean technology and the imposition of strict regulations by regional governments.
A sustainable approach to the extraction, processing, and distribution of minerals, metals, and fossil fuels is known as green mining. Reducing the effects of mining operations on the environment and protecting resources for future generations are the two main objectives of green mining. It entails implementing methods that minimize waste, reduce energy and water use, and encourage reforestation. These methods can assist the sector in being more economically sustainable and cost-effective while protecting the environment. As it provides the basic minerals that power modern society, green mining is an essential sector of the global economy. Green mining also aims to reduce waste and encourage appropriate waste disposal. Many regions have adopted green mining techniques to minimize large volumes of trash, including hazardous tailings that could harm the environment, generally produced by traditional methods.
Get an overview of this study by requesting a free sample
Rising adoption of green mining: The mining industry has been under fire recently due to its detrimental effects on people and the environment. The business is searching for methods to lessen its carbon footprint and limit environmental harm due to the rising demand for minerals and resources. This gave rise to the idea of green mining, which tries to extract resources and minerals in a sustainable and ecologically responsible manner. By employing more effective technology and cutting waste, green mining seeks to lessen the negative effects of mining on the environment. Decreased greenhouse gas emissions are one of the main advantages of green mining. Mining firms may lessen the effects of climate change and reduce their carbon footprint by using renewable energy sources like solar and wind power. Furthermore, by lowering water pollution and water usage, green mining techniques can aid in conserving water resources.
High investment: The high cost of green mining equipment hinders market growth. The R&D and manufacturing costs of developing such machines contributed to the overall costs. Also, maintenance costs and other miscellaneous costs affect the market growth of green mining. Further, these factors also segregate the market shares among key vendors, as the small-scale and medium-scale industries cannot afford such machines. In addition to this, regular maintenance is necessary for such systems, which leads to the additional cost being added to the overall cost.
Expansion of the renewable energy industry: The International Energy Agency projects that by 2025, 35% of the world's power generation will come from renewable capacity. For the world to achieve climate targets and guarantee a reliable electricity supply, governments are allowing low-emission sources to expand even faster and reduce emissions. Strong tailwinds are being created for the renewable energy industry as it moves into 2023 by rising demand and alluring and long-term incentives. The cost of renewable energy has drastically decreased, and big multinational corporations are now pursuing many solar and wind projects. Even though several nations expanded their capacity for renewable energy in 2022, the major expansion in renewables is still mostly centred in a few nations and areas, primarily in the USA, Asia, and Europe.
The regions analyzed for the market include North America, Europe, South America, Asia Pacific, the Middle East, and Africa. Europe emerged as the most significant green mining market, with a 38.11% market revenue share in 2022.
Europe region will account for the largest market share with revenue growth. Nations such as the U.K., France and Germany have a tremendous demand for green mining due to growing investment in sustainable practices. Further, the regional government's favourable initiatives promote the growth of the green mining industry. The mining companies are adopting clean technologies, which can help them reduce their carbon footprints.
Europe region Green Mining Market Share in 2022 - 38.11%
www.thebrainyinsights.com
Check the geographical analysis of this market by requesting a free sample
The type segment is divided into underground and surface. The surface segment dominated the market, with a share of around 75.11% in 2022. The mining process, known as surface mining, involves removing the rock and dirt covering the mineral reserves. Mining corporations frequently favour surface mining. This is because going to tunnels and underground shafts to reach minerals below the surface is frequently more expensive than removing the overburden, or terrain surface, to get the mineral beneath.
The technology segment is divided into emission reduction, power reduction, water reduction, fuel and maintenance reduction and others. The power reduction segment dominated the market, with a share of around 51.92% in 2022. Industries need to find ways that can be beneficial in decreasing the amount of energy used. It can save mining businesses a lot of money because electricity makes up about 40% of the total energy used in a mine.
The minerals extracted segment is divided into precious metals, mineral fuels, industrial metals, ferro alloys and non-ferrous metals. The mineral fuels segment dominated the market, with a share of around 51.17% in 2022. Mineral fuels, including oil, coal, and natural gas, are classified as unique economic deposits. They demonstrate the geochemical build-up of carbon and hydrogen via biologically derived mechanisms. Green mining helps in the extraction of mineral fuels without exploiting natural resources.
| Attribute | Description |
|---|---|
| Market Size | Revenue (USD Billion) |
| Market size value in 2022 | USD 11.12 Billion |
| Market size value in 2032 | USD 27.10 Billion |
| CAGR (2023 to 2032) | 9.32% |
| Historical data | 2019-2021 |
| Base Year | 2022 |
| Forecast | 2023-2032 |
| Region | The regions analyzed for the market are Asia Pacific, Europe, South America, North America, and Middle East & Africa. Furthermore, the regions are further analyzed at the country level. |
| Segments | Type, Technology and Minerals Extracted |
As per The Brainy Insights, the size of the green mining market was valued USD 11.12 billion in 2022 to USD 27.10 billion by 2032.
Global green mining market is growing at a CAGR of 9.32% during the forecast period 2023-2032.
Europe region emerged as the largest market for the green mining.
The market's growth will be influenced by the rising usage of green mining in different applications.
The high instalment cost can hamper the market growth.
Increasing concern about customer data and privacy, may limit the growth of market over the forecast period.
The rising investment in renewable industry is providing lucrative opportunities to the market.
1. Introduction
1.1. Objectives of the Study
1.2. Market Definition
1.3. Research Scope
1.4. Currency
1.5. Key Target Audience
2. Research Methodology and Assumptions
3. Executive Summary
4. Premium Insights
4.1. Porter’s Five Forces Analysis
4.2. Value Chain Analysis
4.3. Top Investment Pockets
4.3.1. Market Attractiveness Analysis by Type
4.3.2. Market Attractiveness Analysis by Technology
4.3.3. Market Attractiveness Analysis by Minerals Extracted
4.3.4. Market Attractiveness Analysis by Region
4.4. Industry Trends
5. Market Dynamics
5.1. Market Evaluation
5.2. Drivers
5.2.1. Increasing investment in green mining
5.3. Restraints
5.3.1. High installation cost
5.4. Opportunities
5.4.1. Increasing growth of renewable industry
5.5. Challenges
5.5.1. Low awareness in certain regions
6. Global Green Mining Market Analysis and Forecast, By Type
6.1. Segment Overview
6.2. Underground
6.3. Surface
7. Global Green Mining Market Analysis and Forecast, By Technology
7.1. Segment Overview
7.2. Emission Reduction
7.3. Power Reduction
7.4. Water Reduction
7.5. Fuel and Maintenance Reduction
7.6. Others
8. Global Green Mining Market Analysis and Forecast, By Minerals Extracted
8.1. Segment Overview
8.2. Precious Metals
8.3. Mineral Fuels
8.4. Industrial Metals
8.5. Ferro Alloys
8.6. Non-Ferrous Metals
9. Global Green Mining Market Analysis and Forecast, By Regional Analysis
9.1. Segment Overview
9.2. North America
9.2.1. U.S.
9.2.2. Canada
9.2.3. Mexico
9.3. Europe
9.3.1. Germany
9.3.2. France
9.3.3. U.K.
9.3.4. Italy
9.3.5. Spain
9.4. Asia-Pacific
9.4.1. Japan
9.4.2. China
9.4.3. India
9.5. South America
9.5.1. Brazil
9.6. Middle East and Africa
9.6.1. UAE
9.6.2. South Africa
10. Global Green Mining Market-Competitive Landscape
10.1. Overview
10.2. Market Share of Key Players in the Green Mining Market
10.2.1. Global Company Market Share
10.2.2. North America Company Market Share
10.2.3. Europe Company Market Share
10.2.4. APAC Company Market Share
10.3. Competitive Situations and Trends
10.3.1. Product Launches and Developments
10.3.2. Partnerships, Collaborations, and Agreements
10.3.3. Mergers & Acquisitions
10.3.4. Expansions
11. Company Profiles
11.1. BHP Billiton
11.1.1. Business Overview
11.1.2. Company Snapshot
11.1.3. Company Market Share Analysis
11.1.4. Company Product Portfolio
11.1.5. Recent Developments
11.1.6. SWOT Analysis
11.2. Anglo American
11.2.1. Business Overview
11.2.2. Company Snapshot
11.2.3. Company Market Share Analysis
11.2.4. Company Product Portfolio
11.2.5. Recent Developments
11.2.6. SWOT Analysis
11.3. TATA Steel
11.3.1. Business Overview
11.3.2. Company Snapshot
11.3.3. Company Market Share Analysis
11.3.4. Company Product Portfolio
11.3.5. Recent Developments
11.3.6. SWOT Analysis
11.4. Jiangxi Copper Corporation Limited
11.4.1. Business Overview
11.4.2. Company Snapshot
11.4.3. Company Market Share Analysis
11.4.4. Company Product Portfolio
11.4.5. Recent Developments
11.4.6. SWOT Analysis
11.5. Liebherr
11.5.1. Business Overview
11.5.2. Company Snapshot
11.5.3. Company Market Share Analysis
11.5.4. Company Product Portfolio
11.5.5. Recent Developments
11.5.6. SWOT Analysis
11.6. Dundee Precious Metals
11.6.1. Business Overview
11.6.2. Company Snapshot
11.6.3. Company Market Share Analysis
11.6.4. Company Product Portfolio
11.6.5. Recent Developments
11.6.6. SWOT Analysis
11.7. Saudi Arabian Mining Corporation
11.7.1. Business Overview
11.7.2. Company Snapshot
11.7.3. Company Market Share Analysis
11.7.4. Company Product Portfolio
11.7.5. Recent Developments
11.7.6. SWOT Analysis
11.8. Doosan Infracore
11.8.1. Business Overview
11.8.2. Company Snapshot
11.8.3. Company Market Share Analysis
11.8.4. Company Product Portfolio
11.8.5. Recent Developments
11.8.6. SWOT Analysis
11.9. Sany
11.9.1. Business Overview
11.9.2. Company Snapshot
11.9.3. Company Market Share Analysis
11.9.4. Company Product Portfolio
11.9.5. Recent Developments
11.9.6. SWOT Analysis
11.10. Shandong Gold Mining Co. Ltd
11.10.1. Business Overview
11.10.2. Company Snapshot
11.10.3. Company Market Share Analysis
11.10.4. Company Product Portfolio
11.10.5. Recent Developments
11.10.6. SWOT Analysis
11.11. Wirtgen Group
11.11.1. Business Overview
11.11.2. Company Snapshot
11.11.3. Company Market Share Analysis
11.11.4. Company Product Portfolio
11.11.5. Recent Developments
11.11.6. SWOT Analysis
11.12. Freeport-McMoRan
11.12.1. Business Overview
11.12.2. Company Snapshot
11.12.3. Company Market Share Analysis
11.12.4. Company Product Portfolio
11.12.5. Recent Developments
11.12.6. SWOT Analysis
11.13. Glencore
11.13.1. Business Overview
11.13.2. Company Snapshot
11.13.3. Company Market Share Analysis
11.13.4. Company Product Portfolio
11.13.5. Recent Developments
11.13.6. SWOT Analysis
11.14. Vale S.A.
11.14.1. Business Overview
11.14.2. Company Snapshot
11.14.3. Company Market Share Analysis
11.14.4. Company Product Portfolio
11.14.5. Recent Developments
11.14.6. SWOT Analysis
11.15. Rio Tinto
11.15.1. Business Overview
11.15.2. Company Snapshot
11.15.3. Company Market Share Analysis
11.15.4. Company Product Portfolio
11.15.5. Recent Developments
11.15.6. SWOT Analysis
List of Table
1. Global Green Mining Market, By Type, 2019-2032 (USD Billion)
2. Global Underground, Green Mining Market, By Region, 2019-2032 (USD Billion)
3. Global Surface, Green Mining Market, By Region, 2019-2032 (USD Billion)
4. Global Green Mining Market, By Technology , 2019-2032 (USD Billion)
5. Global Emission Reduction, Green Mining Market, By Region, 2019-2032 (USD Billion)
6. Global Power Reduction, Green Mining Market, By Region, 2019-2032 (USD Billion)
7. Global Water Reduction, Green Mining Market, By Region, 2019-2032 (USD Billion)
8. Global Fuel and Maintenance Reduction, Green Mining Market, By Region, 2019-2032 (USD Billion)
9. Global Others, Green Mining Market, By Region, 2019-2032 (USD Billion)
10. Global Green Mining Market, By Minerals Extracted, 2019-2032 (USD Billion)
11. Global Precious Metals, Green Mining Market, By Region, 2019-2032 (USD Billion)
12. Global Mineral Fuels, Green Mining Market, By Region, 2019-2032 (USD Billion)
13. Global Industrial Metals, Green Mining Market, By Region, 2019-2032 (USD Billion)
14. Global Ferro Alloys, Green Mining Market, By Region, 2019-2032 (USD Billion)
15. Global Non-Ferrous Metals, Green Mining Market, By Region, 2019-2032 (USD Billion)
16. Global Green Mining Market, By Region, 2019-2032 (USD Billion)
17. North America Green Mining Market, By Type, 2019-2032 (USD Billion)
18. North America Green Mining Market, By Technology , 2019-2032 (USD Billion)
19. North America Green Mining Market, By Minerals Extracted, 2019-2032 (USD Billion)
20. U.S. Green Mining Market, By Type, 2019-2032 (USD Billion)
21. U.S. Green Mining Market, By Technology , 2019-2032 (USD Billion)
22. U.S. Green Mining Market, By Minerals Extracted, 2019-2032 (USD Billion)
23. Canada Green Mining Market, By Type, 2019-2032 (USD Billion)
24. Canada Green Mining Market, By Technology , 2019-2032 (USD Billion)
25. Canada Green Mining Market, By Minerals Extracted, 2019-2032 (USD Billion)
26. Mexico Green Mining Market, By Type, 2019-2032 (USD Billion)
27. Mexico Green Mining Market, By Technology , 2019-2032 (USD Billion)
28. Mexico Green Mining Market, By Minerals Extracted, 2019-2032 (USD Billion)
29. Europe Green Mining Market, By Type, 2019-2032 (USD Billion)
30. Europe Green Mining Market, By Technology , 2019-2032 (USD Billion)
31. Europe Green Mining Market, By Minerals Extracted, 2019-2032 (USD Billion)
32. Germany Green Mining Market, By Type, 2019-2032 (USD Billion)
33. Germany Green Mining Market, By Technology , 2019-2032 (USD Billion)
34. Germany Green Mining Market, By Minerals Extracted, 2019-2032 (USD Billion)
35. France Green Mining Market, By Type, 2019-2032 (USD Billion)
36. France Green Mining Market, By Technology , 2019-2032 (USD Billion)
37. France Green Mining Market, By Minerals Extracted, 2019-2032 (USD Billion)
38. U.K. Green Mining Market, By Type, 2019-2032 (USD Billion)
39. U.K. Green Mining Market, By Technology , 2019-2032 (USD Billion)
40. U.K. Green Mining Market, By Minerals Extracted, 2019-2032 (USD Billion)
41. Italy Green Mining Market, By Type, 2019-2032 (USD Billion)
42. Italy Green Mining Market, By Technology , 2019-2032 (USD Billion)
43. Italy Green Mining Market, By Minerals Extracted, 2019-2032 (USD Billion)
44. Spain Green Mining Market, By Type, 2019-2032 (USD Billion)
45. Spain Green Mining Market, By Technology , 2019-2032 (USD Billion)
46. Spain Green Mining Market, By Minerals Extracted, 2019-2032 (USD Billion)
47. Asia Pacific Green Mining Market, By Type, 2019-2032 (USD Billion)
48. Asia Pacific Green Mining Market, By Technology , 2019-2032 (USD Billion)
49. Asia Pacific Green Mining Market, By Minerals Extracted, 2019-2032 (USD Billion)
50. Japan Green Mining Market, By Type, 2019-2032 (USD Billion)
51. Japan Green Mining Market, By Technology , 2019-2032 (USD Billion)
52. Japan Green Mining Market, By Minerals Extracted, 2019-2032 (USD Billion)
53. China Green Mining Market, By Type, 2019-2032 (USD Billion)
54. China Green Mining Market, By Technology , 2019-2032 (USD Billion)
55. China Green Mining Market, By Minerals Extracted, 2019-2032 (USD Billion)
56. India Green Mining Market, By Type, 2019-2032 (USD Billion)
57. India Green Mining Market, By Technology , 2019-2032 (USD Billion)
58. India Green Mining Market, By Minerals Extracted, 2019-2032 (USD Billion)
59. South America Green Mining Market, By Type, 2019-2032 (USD Billion)
60. South America Green Mining Market, By Technology , 2019-2032 (USD Billion)
61. South America Green Mining Market, By Minerals Extracted, 2019-2032 (USD Billion)
62. Brazil Green Mining Market, By Type, 2019-2032 (USD Billion)
63. Brazil Green Mining Market, By Technology , 2019-2032 (USD Billion)
64. Brazil Green Mining Market, By Minerals Extracted, 2019-2032 (USD Billion)
65. Middle East and Africa Green Mining Market, By Type, 2019-2032 (USD Billion)
66. Middle East and Africa Green Mining Market, By Technology , 2019-2032 (USD Billion)
67. Middle East and Africa Green Mining Market, By Minerals Extracted, 2019-2032 (USD Billion)
68. UAE Green Mining Market, By Type, 2019-2032 (USD Billion)
69. UAE Green Mining Market, By Technology , 2019-2032 (USD Billion)
70. UAE Green Mining Market, By Minerals Extracted, 2019-2032 (USD Billion)
71. South Africa Green Mining Market, By Type, 2019-2032 (USD Billion)
72. South Africa Green Mining Market, By Technology , 2019-2032 (USD Billion)
73. South Africa Green Mining Market, By Minerals Extracted, 2019-2032 (USD Billion)
List of Figures
1. Global Green Mining Market Segmentation
2. Green Mining Market: Research Methodology
3. Market Size Estimation Methodology: Bottom-Up Approach
4. Market Size Estimation Methodology: Top-Down Approach
5. Data Triangulation
6. Porter’s Five Forces Analysis
7. Value Chain Analysis
8. Global Green Mining Market Attractiveness Analysis by Type
9. Global Green Mining Market Attractiveness Analysis by Technology
10. Global Green Mining Market Attractiveness Analysis by Minerals Extracted
11. Global Green Mining Market Attractiveness Analysis by Region
12. Global Green Mining Market: Dynamics
13. Global Green Mining Market Share by Type (2022 & 2032)
14. Global Green Mining Market Share by Technology (2022 & 2032)
15. Global Green Mining Market Share by Minerals Extracted (2022 & 2032)
16. Global Green Mining Market Share by Regions (2022 & 2032)
17. Global Green Mining Market Share by Company (2022)
This study forecasts revenue at global, regional, and country levels from 2019 to 2032. The Brainy Insights has segmented the global green mining market based on below mentioned segments:
Global Green Mining Market by Type:
Global Green Mining Market by Technology:
Global Green Mining Market by Minerals Extracted:
Global Green Mining Market by Region:
Research has its special purpose to undertake marketing efficiently. In this competitive scenario, businesses need information across all industry verticals; the information about customer wants, market demand, competition, industry trends, distribution channels etc. This information needs to be updated regularly because businesses operate in a dynamic environment. Our organization, The Brainy Insights incorporates scientific and systematic research procedures in order to get proper market insights and industry analysis for overall business success. The analysis consists of studying the market from a miniscule level wherein we implement statistical tools which helps us in examining the data with accuracy and precision.
Our research reports feature both; quantitative and qualitative aspects for any market. Qualitative information for any market research process are fundamental because they reveal the customer needs and wants, usage and consumption for any product/service related to a specific industry. This in turn aids the marketers/investors in knowing certain perceptions of the customers. Qualitative research can enlighten about the different product concepts and designs along with unique service offering that in turn, helps define marketing problems and generate opportunities. On the other hand, quantitative research engages with the data collection process through interviews, e-mail interactions, surveys and pilot studies. Quantitative aspects for the market research are useful to validate the hypotheses generated during qualitative research method, explore empirical patterns in the data with the help of statistical tools, and finally make the market estimations.
The Brainy Insights offers comprehensive research and analysis, based on a wide assortment of factual insights gained through interviews with CXOs and global experts and secondary data from reliable sources. Our analysts and industry specialist assume vital roles in building up statistical tools and analysis models, which are used to analyse the data and arrive at accurate insights with exceedingly informative research discoveries. The data provided by our organization have proven precious to a diverse range of companies, facilitating them to address issues such as determining which products/services are the most appealing, whether or not customers use the product in the manner anticipated, the purchasing intentions of the market and many others.
Our research methodology encompasses an idyllic combination of primary and secondary initiatives. Key phases involved in this process are listed below:

The phase involves the gathering and collecting of market data and its related information with the help of different sources & research procedures.

The data procurement stage involves in data gathering and collecting through various data sources.
This stage involves in extensive research. These data sources includes:
Purchased Database: Purchased databases play a crucial role in estimating the market sizes irrespective of the domain. Our purchased database includes:
Primary Research: The Brainy Insights interacts with leading companies and experts of the concerned domain to develop the analyst team’s market understanding and expertise. It improves and substantiates every single data presented in the market reports. Primary research mainly involves in telephonic interviews, E-mail interactions and face-to-face interviews with the raw material providers, manufacturers/producers, distributors, & independent consultants. The interviews that we conduct provides valuable data on market size and industry growth trends prevailing in the market. Our organization also conducts surveys with the various industry experts in order to gain overall insights of the industry/market. For instance, in healthcare industry we conduct surveys with the pharmacists, doctors, surgeons and nurses in order to gain insights and key information of a medical product/device/equipment which the customers are going to usage. Surveys are conducted in the form of questionnaire designed by our own analyst team. Surveys plays an important role in primary research because surveys helps us to identify the key target audiences of the market. Additionally, surveys helps to identify the key target audience engaged with the market. Our survey team conducts the survey by targeting the key audience, thus gaining insights from them. Based on the perspectives of the customers, this information is utilized to formulate market strategies. Moreover, market surveys helps us to understand the current competitive situation of the industry. To be precise, our survey process typically involve with the 360 analysis of the market. This analytical process begins by identifying the prospective customers for a product or service related to the market/industry to obtain data on how a product/service could fit into customers’ lives.

Secondary Research: The secondary data sources includes information published by the on-profit organizations such as World bank, WHO, company fillings, investor presentations, annual reports, national government documents, statistical databases, blogs, articles, white papers and others. From the annual report, we analyse a company’s revenue to understand the key segment and market share of that organization in a particular region. We analyse the company websites and adopt the product mapping technique which is important for deriving the segment revenue. In the product mapping method, we select and categorize the products offered by the companies catering to domain specific market, deduce the product revenue for each of the companies so as to get overall estimation of the market size. We also source data and analyses trends based on information received from supply side and demand side intermediaries in the value chain. The supply side denotes the data gathered from supplier, distributor, wholesaler and the demand side illustrates the data gathered from the end customers for respective market domain.

The supply side for a domain specific market is analysed by:
The demand side for the market is estimated through:
In-house Library: Apart from these third-party sources, we have our in-house library of qualitative and quantitative information. Our in-house database includes market data for various industry and domains. These data are updated on regular basis as per the changing market scenario. Our library includes, historic databases, internal audit reports and archives.
Sometimes there are instances where there is no metadata or raw data available for any domain specific market. For those cases, we use our expertise to forecast and estimate the market size in order to generate comprehensive data sets. Our analyst team adopt a robust research technique in order to produce the estimates:
Data Synthesis: This stage involves the analysis & mapping of all the information obtained from the previous step. It also involves in scrutinizing the data for any discrepancy observed while data gathering related to the market. The data is collected with consideration to the heterogeneity of sources. Robust scientific techniques are in place for synthesizing disparate data sets and provide the essential contextual information that can orient market strategies. The Brainy Insights has extensive experience in data synthesis where the data passes through various stages:


Market Deduction & Formulation: The final stage comprises of assigning data points at appropriate market spaces so as to deduce feasible conclusions. Analyst perspective & subject matter expert based holistic form of market sizing coupled with industry analysis also plays a crucial role in this stage.
This stage involves in finalization of the market size and numbers that we have collected from data integration step. With data interpolation, it is made sure that there is no gap in the market data. Successful trend analysis is done by our analysts using extrapolation techniques, which provide the best possible forecasts for the market.
Data Validation & Market Feedback: Validation is the most important step in the process. Validation & re-validation via an intricately designed process helps us finalize data-points to be used for final calculations.

The Brainy Insights interacts with leading companies and experts of the concerned domain to develop the analyst team’s market understanding and expertise. It improves and substantiates every single data presented in the market reports. The data validation interview and discussion panels are typically composed of the most experienced industry members. The participants include, however, are not limited to:
Moreover, we always validate our data and findings through primary respondents from all the major regions we are working on.


Free Customization
Fortune 500 Clients
Free Yearly Update On Purchase Of Multi/Corporate License
Companies Served Till Date