- +1-315-215-1633
- sales@thebrainyinsights.com

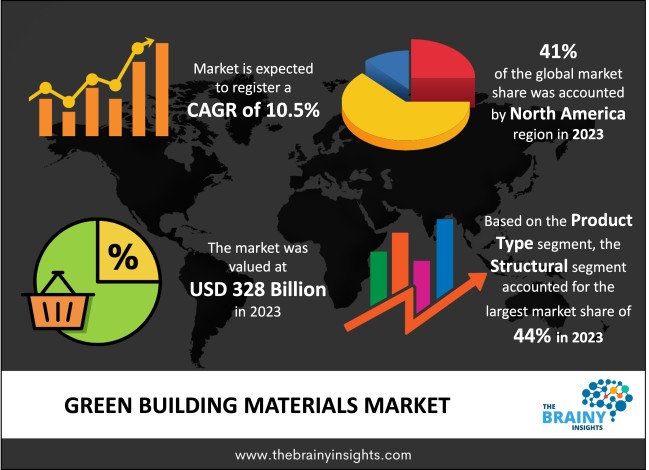
The global green building materials market was valued at USD 328 billion in 2023 and grew at a CAGR of 10.5% from 2024 to 2033. The market is expected to reach USD 890.22 billion by 2033. The increasing demand for housing in developing nations will drive the growth of the global green building materials market. The growing concern about the environment will also play an important role in growing the market of Green Building Materials. Green Building Materials will help to save the environment. Its use will help reduce greenhouse gas emissions. At the same time, many products used in the materials used in construction use chemicals, which affects the health of workers as well as the environment.
Building and construction are among the most significant economic sectors contributing substantially to national growth and development. The development of infrastructure drives the demand for other sectors and creates a positive effect on income and employment generation as well. With the rising concerns of climate change and dwindling natural resources, it is imperative to identify sustainable and eco-friendly building and construction practices. Green building materials can achieve self-sustaining, economical, environmentally friendly, sustainable buildings and other constructions. Green building materials also reduce the burden on natural resources. The materials used in green buildings are often self-sustaining, and they reduce maintenance costs. They conserve energy and positively affect the health of the residents and the surrounding environment. The appearance and functionality of the utilities in the building can be customized as green building materials offer higher flexibility. Green building materials are obtained or sourced from the abundant reserves of renewable energy sources or products that are recyclable. Additionally, green building materials also incorporate sustainable manufacturing or processing techniques. It also envisages products and systems that withstand moisture or prevent the growth of biological pollutants in buildings. It also deploys methods of water conservation. Earthen Materials, bamboo, Wood, Insulated Concrete Forms, straw bale, slate and cordwood are a few examples of green building materials. To promote Green Building Materials, the government can also order builders to follow building codes and standards. They can implement a rule to increase the use of Green Building Materials, which will increase the sustainable construction materials market. Green Building Materials can help make a building energy efficient. Due to increased energy efficiency, the operational cost of the building will be reduced, as will electricity bills.
Get an overview of this study by requesting a free sample
The increasing demand for building and construction in developing nations – The world's developing nations are witnessing a population rise. They are also witnessing an increase in the personal disposable income of the population, which facilitates greater saving, investment and consumption expenditure on their part. The rising demand for a better quality of life is being facilitated by rapid urbanization. The increasing housing demands can be attributed to the rising population, per capita income and rapid urbanization. The government is also increasing infrastructural spending to offer affordable housing to the citizenry and create roads, bridges, airports and ports to augment national economic growth and development. The growing building and construction activities must be eco-friendly and sustainable to balance environmental conservation. The growing concerns of climate change have further facilitated a shift towards more sustainable methods, products and systems in all economic sectors. Therefore, the increasing demand for building and construction in developing nations will bode well for the growth of the global sustainable construction materials market.
The Green building materials are expensive – Using green materials saves users high costs in the long term. However, this benefit is overshadowed by the high initial investments required for utilizing green building materials in construction activities or other infrastructural amenities. The production of non-green building materials involves significantly lower costs. They are well-known and tested materials in the worldwide construction industry. The population has more awareness and knowledge about these materials, encouraging them to use them. Therefore, the expensive nature of green building materials will hamper the market's growth.
The favourable government rules and regulations – the growing population with rising disposable income- drives infrastructural demands for more housing, office spaces, industries, commercial complexes, roads, bridges and other public amenities. The government is meeting these demands with a comprehensive, standardized, integrated regulatory framework governing the building and construction sector. However, the need to balance environmental conservation and urban development can only be met by incorporating sustainable products, systems and methods in the industry. Therefore, the government is encouraging the use of green building materials by incentivizing, subsidizing and standardizing approvals governing these materials. They also encourage using green materials by levying higher taxes or non-tax restrictions on non-green building materials. Therefore, favourable government rules and regulations will offer lucrative opportunities in the global sustainable construction materials market in the forecast period.
The regions analyzed for the market include North America, Europe, South America, Asia Pacific, the Middle East, and Africa. North America emerged as the largest global green building materials market, with a 41% market revenue share in 2023.
North American region will account for the largest market share with revenue growth. The demand for renovation and refurbishing in the region will drive the demand for green building materials. The demand for new infrastructure for housing, commercial complexes, industrial units and connectivity projects will also drive the regional sustainable construction materials market. The rising awareness about green building materials and their benefits like cost and energy saving over the long term will contribute to the regional market's growth. The presence of significant market players with access to advanced technologies driving innovation will augment the market's growth. The government's push towards adopting eco-friendly construction measures will also bode well for the market.
North America Region Green Building Materials Market Share in 2023 - 41%
www.thebrainyinsights.com
Check the geographical analysis of this market by requesting a free sample
The product type segment is divided into structural, interior, exterior and others. The structural segment dominated the market, with a market share of around 44% in 2023. Structural building materials form the foundational base of buildings. Iron, steel, concrete and other basic components make the standing structures. They are an intrinsic part of the buildings. The use of structural green building materials has several benefits. It saves costs in the long run. It is easy to maintain and has minimal replacement costs. It conserves energy and is sustainable. They are financially viable and eco-friendly products. For instance, weather-resistant aluminium insulated access panel helps in managing temperature. Several other such materials make up the segment, and they are highly popular in the market, thereby contributing to their dominance in the market.
The application segment is divided into framing, roofing, interior and exterior finishing, insulation, flooring, siding and others. The roofing segment dominated the market, with a market share of around 43% in 2023. The roof serves as a building's top layer of defence against weather extremes like wind, rain, and snow. The process of erecting, repairing, or maintaining a building's roof is called roofing. Roofing with green building materials offers several economic, ecological, and societal advantages. A green roof utilizes sustainable materials, systems and devices to protect against rainfall and extreme weather. It aids in water conservation, air purification, lowering outdoor temperatures, and regulating internal temperatures, conserving energy. The multiple benefits of using green building materials in roofing contribute to its dominance in the market.
The end-user segment is divided into residential buildings and non-residential buildings. The residential buildings segment dominated the market, with a market share of around 55% in 2023. All structures intended for private occupancy are considered residential buildings. Residential green building materials involve products, systems, and devices that consume less energy, water, and materials. They have a smaller environmental impact and provide a healthy interior environment for their residents. The growing awareness about green residential buildings and their several benefits, like Improved Indoor Environment Quality of Life and health and water and energy conservation, has contributed to their dominance in the market. Furthermore, the Reduced Operational Cost and Maintenance help in savings, a prime driving factor of the global green building materials market segment.
| Attribute | Description |
|---|---|
| Market Size | Revenue (USD Billion) |
| Market size value in 2023 | USD 328 Billion |
| Market size value in 2033 | USD 890.22 Billion |
| CAGR (2024 to 2033) | 10.5% |
| Historical data | 2020-2022 |
| Base Year | 2023 |
| Forecast | 2024-2033 |
| Region | The regions analyzed for the market are Asia Pacific, Europe, South America, North America, and Middle East & Africa. Furthermore, the regions are further analyzed at the country level. |
| Segments | Product Type, Application, End User |
As per The Brainy Insights, the size of the global green building materials market was valued at USD 328 billion in 2023 to USD 890.22 billion by 2033.
Global green building materials market is growing at a CAGR of 10.5% during the forecast period 2024-2033.
The market's growth will be influenced by the increasing demand for building and construction in developing nations.
The green building materials are expensive and that could hamper the market growth.
1. Introduction
1.1. Objectives of the Study
1.2. Market Definition
1.3. Research Scope
1.4. Currency
1.5. Key Target Audience
2. Research Methodology and Assumptions
3. Executive Summary
4. Premium Insights
4.1. Porter’s Five Forces Analysis
4.2. Value Chain Analysis
4.3. Top Investment Pockets
4.3.1. Market Attractiveness Analysis by Product Type
4.3.2. Market Attractiveness Analysis by Application
4.3.3. Market Attractiveness Analysis by End User
4.3.4. Market Attractiveness Analysis by Region
4.4. Industry Trends
5. Market Dynamics
5.1. Market Evaluation
5.2. Drivers
5.2.1. The increasing demand for building and construction in developing nations
5.3. Restraints
5.3.1. The green building materials are expensive
5.4. Opportunities
5.4.1. The favorable government rules and regulations
5.5. Challenges
5.5.1. The lack of awareness about green building materials
6. Global Green Building Materials Market Analysis and Forecast, By Product Type
6.1. Segment Overview
6.2. Structural
6.3. Interior
6.4. Exterior
6.5. Others
7. Global Green Building Materials Market Analysis and Forecast, By Application
7.1. Segment Overview
7.2. Framing
7.3. Roofing
7.4. Interior and Exterior Finishing
7.5. Insulation
7.6. Flooring
7.7. Siding
7.8. Others
8. Global Green Building Materials Market Analysis and Forecast, By End User
8.1. Segment Overview
8.2. Residential Buildings
8.3. Non-Residential Buildings
9. Global Green Building Materials Market Analysis and Forecast, By Regional Analysis
9.1. Segment Overview
9.2. North America
9.2.1. U.S.
9.2.2. Canada
9.2.3. Mexico
9.3. Europe
9.3.1. Germany
9.3.2. France
9.3.3. U.K.
9.3.4. Italy
9.3.5. Spain
9.4. Asia-Pacific
9.4.1. Japan
9.4.2. China
9.4.3. India
9.5. South America
9.5.1. Brazil
9.6. Middle East and Africa
9.6.1. UAE
9.6.2. South Africa
10. Global Green Building Materials Market-Competitive Landscape
10.1. Overview
10.2. Market Share of Key Players in the Green Building Materials Market
10.2.1. Global Company Market Share
10.2.2. North America Company Market Share
10.2.3. Europe Company Market Share
10.2.4. APAC Company Market Share
10.3. Competitive Situations and Trends
10.3.1. Product Launches and Developments
10.3.2. Partnerships, Collaborations, and Agreements
10.3.3. Mergers & Acquisitions
10.3.4. Expansions
11. Company Profiles
11.1. Alumasc Group Plc
11.1.1. Business Overview
11.1.2. Company Snapshot
11.1.3. Company Market Share Analysis
11.1.4. Company Product Portfolio
11.1.5. Recent Developments
11.1.6. SWOT Analysis
11.2. Amvik Systems
11.2.1. Business Overview
11.2.2. Company Snapshot
11.2.3. Company Market Share Analysis
11.2.4. Company Product Portfolio
11.2.5. Recent Developments
11.2.6. SWOT Analysis
11.3. BASF SE
11.3.1. Business Overview
11.3.2. Company Snapshot
11.3.3. Company Market Share Analysis
11.3.4. Company Product Portfolio
11.3.5. Recent Developments
11.3.6. SWOT Analysis
11.4. CertainTeed Corporation
11.4.1. Business Overview
11.4.2. Company Snapshot
11.4.3. Company Market Share Analysis
11.4.4. Company Product Portfolio
11.4.5. Recent Developments
11.4.6. SWOT Analysis
11.5. E. I. du Pont de Nemours and Company
11.5.1. Business Overview
11.5.2. Company Snapshot
11.5.3. Company Market Share Analysis
11.5.4. Company Product Portfolio
11.5.5. Recent Developments
11.5.6. SWOT Analysis
11.6. Forbo International SA
11.6.1. Business Overview
11.6.2. Company Snapshot
11.6.3. Company Market Share Analysis
11.6.4. Company Product Portfolio
11.6.5. Recent Developments
11.6.6. SWOT Analysis
11.7. Interface Inc.
11.7.1. Business Overview
11.7.2. Company Snapshot
11.7.3. Company Market Share Analysis
11.7.4. Company Product Portfolio
11.7.5. Recent Developments
11.7.6. SWOT Analysis
11.8. Kingspan Group Plc
11.8.1. Business Overview
11.8.2. Company Snapshot
11.8.3. Company Market Share Analysis
11.8.4. Company Product Portfolio
11.8.5. Recent Developments
11.8.6. SWOT Analysis
11.9. Owens Corning
11.9.1. Business Overview
11.9.2. Company Snapshot
11.9.3. Company Market Share Analysis
11.9.4. Company Product Portfolio
11.9.5. Recent Developments
11.9.6. SWOT Analysis
11.10. Sika AG
11.10.1. Business Overview
11.10.2. Company Snapshot
11.10.3. Company Market Share Analysis
11.10.4. Company Product Portfolio
11.10.5. Recent Developments
11.10.6. SWOT Analysis
List of Table
1. Global Green Building Materials Market, By Product Type, 2020-2033 (USD Billion)
2. Global Structural Green Building Materials Market, By Region, 2020-2033 (USD Billion)
3. Global Interior Green Building Materials Market, By Region, 2020-2033 (USD Billion)
4. Global Exterior Green Building Materials Market, By Region, 2020-2033 (USD Billion)
5. Global Others Green Building Materials Market, By Region, 2020-2033 (USD Billion)
6. Global Green Building Materials Market, By Application, 2020-2033 (USD Billion)
7. Global Framing Green Building Materials Market, By Region, 2020-2033 (USD Billion)
8. Global Roofing Green Building Materials Market, By Region, 2020-2033 (USD Billion)
9. Global Interior and Exterior Finishing Green Building Materials Market, By Region, 2020-2033 (USD Billion)
10. Global Insulation Green Building Materials Market, By Region, 2020-2033 (USD Billion)
11. Global Flooring Green Building Materials Market, By Region, 2020-2033 (USD Billion)
12. Global Siding Green Building Materials Market, By Region, 2020-2033 (USD Billion)
13. Global Others Green Building Materials Market, By Region, 2020-2033 (USD Billion)
14. Global Green Building Materials Market, By End User, 2020-2033 (USD Billion)
15. Global Residential Buildings Green Building Materials Market, By Region, 2020-2033 (USD Billion)
16. Global Non-Residential Buildings Green Building Materials Market, By Region, 2020-2033 (USD Billion)
17. Global Green Building Materials Market, By Region, 2020-2033 (USD Billion)
18. North America Green Building Materials Market, By Product Type, 2020-2033 (USD Billion)
19. North America Green Building Materials Market, By Application, 2020-2033 (USD Billion)
20. North America Green Building Materials Market, By End User, 2020-2033 (USD Billion)
21. U.S. Green Building Materials Market, By Product Type, 2020-2033 (USD Billion)
22. U.S. Green Building Materials Market, By Application, 2020-2033 (USD Billion)
23. U.S. Green Building Materials Market, By End User, 2020-2033 (USD Billion)
24. Canada Green Building Materials Market, By Product Type, 2020-2033 (USD Billion)
25. Canada Green Building Materials Market, By Application, 2020-2033 (USD Billion)
26. Canada Green Building Materials Market, By End User, 2020-2033 (USD Billion)
27. Mexico Green Building Materials Market, By Product Type, 2020-2033 (USD Billion)
28. Mexico Green Building Materials Market, By Application, 2020-2033 (USD Billion)
29. Mexico Green Building Materials Market, By End User, 2020-2033 (USD Billion)
30. Europe Green Building Materials Market, By Product Type, 2020-2033 (USD Billion)
31. Europe Green Building Materials Market, By Application, 2020-2033 (USD Billion)
32. Europe Green Building Materials Market, By End User, 2020-2033 (USD Billion)
33. Germany Green Building Materials Market, By Product Type, 2020-2033 (USD Billion)
34. Germany Green Building Materials Market, By Application, 2020-2033 (USD Billion)
35. Germany Green Building Materials Market, By End User, 2020-2033 (USD Billion)
36. France Green Building Materials Market, By Product Type, 2020-2033 (USD Billion)
37. France Green Building Materials Market, By Application, 2020-2033 (USD Billion)
38. France Green Building Materials Market, By End User, 2020-2033 (USD Billion)
39. U.K. Green Building Materials Market, By Product Type, 2020-2033 (USD Billion)
40. U.K. Green Building Materials Market, By Application, 2020-2033 (USD Billion)
41. U.K. Green Building Materials Market, By End User, 2020-2033 (USD Billion)
42. Italy Green Building Materials Market, By Product Type, 2020-2033 (USD Billion)
43. Italy Green Building Materials Market, By Application, 2020-2033 (USD Billion)
44. Italy Green Building Materials Market, By End User, 2020-2033 (USD Billion)
45. Spain Green Building Materials Market, By Product Type, 2020-2033 (USD Billion)
46. Spain Green Building Materials Market, By Application, 2020-2033 (USD Billion)
47. Spain Green Building Materials Market, By End User, 2020-2033 (USD Billion)
48. Asia Pacific Green Building Materials Market, By Product Type, 2020-2033 (USD Billion)
49. Asia Pacific Green Building Materials Market, By Application, 2020-2033 (USD Billion)
50. Asia Pacific Green Building Materials Market, By End User, 2020-2033 (USD Billion)
51. Japan Green Building Materials Market, By Product Type, 2020-2033 (USD Billion)
52. Japan Green Building Materials Market, By Application, 2020-2033 (USD Billion)
53. Japan Green Building Materials Market, By End User, 2020-2033 (USD Billion)
54. China Green Building Materials Market, By Product Type, 2020-2033 (USD Billion)
55. China Green Building Materials Market, By Application, 2020-2033 (USD Billion)
56. China Green Building Materials Market, By End User, 2020-2033 (USD Billion)
57. India Green Building Materials Market, By Product Type, 2020-2033 (USD Billion)
58. India Green Building Materials Market, By Application, 2020-2033 (USD Billion)
59. India Green Building Materials Market, By End User, 2020-2033 (USD Billion)
60. South America Green Building Materials Market, By Product Type, 2020-2033 (USD Billion)
61. South America Green Building Materials Market, By Application, 2020-2033 (USD Billion)
62. South America Green Building Materials Market, By End User, 2020-2033 (USD Billion)
63. Brazil Green Building Materials Market, By Product Type, 2020-2033 (USD Billion)
64. Brazil Green Building Materials Market, By Application, 2020-2033 (USD Billion)
65. Brazil Green Building Materials Market, By End User, 2020-2033 (USD Billion)
66. Middle East and Africa Green Building Materials Market, By Product Type, 2020-2033 (USD Billion)
67. Middle East and Africa Green Building Materials Market, By Application, 2020-2033 (USD Billion)
68. Middle East and Africa Green Building Materials Market, By End User, 2020-2033 (USD Billion)
69. UAE Green Building Materials Market, By Product Type, 2020-2033 (USD Billion)
70. UAE Green Building Materials Market, By Application, 2020-2033 (USD Billion)
71. UAE Green Building Materials Market, By End User, 2020-2033 (USD Billion)
72. South Africa Green Building Materials Market, By Product Type, 2020-2033 (USD Billion)
73. South Africa Green Building Materials Market, By Application, 2020-2033 (USD Billion)
74. South Africa Green Building Materials Market, By End User, 2020-2033 (USD Billion)
List of Figures
1. Global Green Building Materials Market Segmentation
2. Green Building Materials Market: Research Methodology
3. Market Size Estimation Methodology: Bottom-Up Approach
4. Market Size Estimation Methodology: Top-Down Approach
5. Data Triangulation
6. Porter’s Five Forces Analysis
7. Value Chain Analysis
8. Global Green Building Materials Market Attractiveness Analysis by Product Type
9. Global Green Building Materials Market Attractiveness Analysis by Application
10. Global Green Building Materials Market Attractiveness Analysis by End User
11. Global Green Building Materials Market Attractiveness Analysis by Region
12. Global Green Building Materials Market: Dynamics
13. Global Green Building Materials Market Share by Product Type (2023 & 2033)
14. Global Green Building Materials Market Share by Application (2023 & 2033)
15. Global Green Building Materials Market Share by End User (2023 & 2033)
16. Global Green Building Materials Market Share by Regions (2023 & 2033)
17. Global Green Building Materials Market Share by Company (2023)
This study forecasts revenue at global, regional, and country levels from 2020 to 2033. The Brainy Insights has segmented the global green building materials market based on below mentioned segments:
Global Green Building Materials Market by Product Type:
Global Green Building Materials Market by Application:
Global Green Building Materials Market by End User:
Global Green Building Materials Market by Region:
Research has its special purpose to undertake marketing efficiently. In this competitive scenario, businesses need information across all industry verticals; the information about customer wants, market demand, competition, industry trends, distribution channels etc. This information needs to be updated regularly because businesses operate in a dynamic environment. Our organization, The Brainy Insights incorporates scientific and systematic research procedures in order to get proper market insights and industry analysis for overall business success. The analysis consists of studying the market from a miniscule level wherein we implement statistical tools which helps us in examining the data with accuracy and precision.
Our research reports feature both; quantitative and qualitative aspects for any market. Qualitative information for any market research process are fundamental because they reveal the customer needs and wants, usage and consumption for any product/service related to a specific industry. This in turn aids the marketers/investors in knowing certain perceptions of the customers. Qualitative research can enlighten about the different product concepts and designs along with unique service offering that in turn, helps define marketing problems and generate opportunities. On the other hand, quantitative research engages with the data collection process through interviews, e-mail interactions, surveys and pilot studies. Quantitative aspects for the market research are useful to validate the hypotheses generated during qualitative research method, explore empirical patterns in the data with the help of statistical tools, and finally make the market estimations.
The Brainy Insights offers comprehensive research and analysis, based on a wide assortment of factual insights gained through interviews with CXOs and global experts and secondary data from reliable sources. Our analysts and industry specialist assume vital roles in building up statistical tools and analysis models, which are used to analyse the data and arrive at accurate insights with exceedingly informative research discoveries. The data provided by our organization have proven precious to a diverse range of companies, facilitating them to address issues such as determining which products/services are the most appealing, whether or not customers use the product in the manner anticipated, the purchasing intentions of the market and many others.
Our research methodology encompasses an idyllic combination of primary and secondary initiatives. Key phases involved in this process are listed below:

The phase involves the gathering and collecting of market data and its related information with the help of different sources & research procedures.

The data procurement stage involves in data gathering and collecting through various data sources.
This stage involves in extensive research. These data sources includes:
Purchased Database: Purchased databases play a crucial role in estimating the market sizes irrespective of the domain. Our purchased database includes:
Primary Research: The Brainy Insights interacts with leading companies and experts of the concerned domain to develop the analyst team’s market understanding and expertise. It improves and substantiates every single data presented in the market reports. Primary research mainly involves in telephonic interviews, E-mail interactions and face-to-face interviews with the raw material providers, manufacturers/producers, distributors, & independent consultants. The interviews that we conduct provides valuable data on market size and industry growth trends prevailing in the market. Our organization also conducts surveys with the various industry experts in order to gain overall insights of the industry/market. For instance, in healthcare industry we conduct surveys with the pharmacists, doctors, surgeons and nurses in order to gain insights and key information of a medical product/device/equipment which the customers are going to usage. Surveys are conducted in the form of questionnaire designed by our own analyst team. Surveys plays an important role in primary research because surveys helps us to identify the key target audiences of the market. Additionally, surveys helps to identify the key target audience engaged with the market. Our survey team conducts the survey by targeting the key audience, thus gaining insights from them. Based on the perspectives of the customers, this information is utilized to formulate market strategies. Moreover, market surveys helps us to understand the current competitive situation of the industry. To be precise, our survey process typically involve with the 360 analysis of the market. This analytical process begins by identifying the prospective customers for a product or service related to the market/industry to obtain data on how a product/service could fit into customers’ lives.

Secondary Research: The secondary data sources includes information published by the on-profit organizations such as World bank, WHO, company fillings, investor presentations, annual reports, national government documents, statistical databases, blogs, articles, white papers and others. From the annual report, we analyse a company’s revenue to understand the key segment and market share of that organization in a particular region. We analyse the company websites and adopt the product mapping technique which is important for deriving the segment revenue. In the product mapping method, we select and categorize the products offered by the companies catering to domain specific market, deduce the product revenue for each of the companies so as to get overall estimation of the market size. We also source data and analyses trends based on information received from supply side and demand side intermediaries in the value chain. The supply side denotes the data gathered from supplier, distributor, wholesaler and the demand side illustrates the data gathered from the end customers for respective market domain.

The supply side for a domain specific market is analysed by:
The demand side for the market is estimated through:
In-house Library: Apart from these third-party sources, we have our in-house library of qualitative and quantitative information. Our in-house database includes market data for various industry and domains. These data are updated on regular basis as per the changing market scenario. Our library includes, historic databases, internal audit reports and archives.
Sometimes there are instances where there is no metadata or raw data available for any domain specific market. For those cases, we use our expertise to forecast and estimate the market size in order to generate comprehensive data sets. Our analyst team adopt a robust research technique in order to produce the estimates:
Data Synthesis: This stage involves the analysis & mapping of all the information obtained from the previous step. It also involves in scrutinizing the data for any discrepancy observed while data gathering related to the market. The data is collected with consideration to the heterogeneity of sources. Robust scientific techniques are in place for synthesizing disparate data sets and provide the essential contextual information that can orient market strategies. The Brainy Insights has extensive experience in data synthesis where the data passes through various stages:


Market Deduction & Formulation: The final stage comprises of assigning data points at appropriate market spaces so as to deduce feasible conclusions. Analyst perspective & subject matter expert based holistic form of market sizing coupled with industry analysis also plays a crucial role in this stage.
This stage involves in finalization of the market size and numbers that we have collected from data integration step. With data interpolation, it is made sure that there is no gap in the market data. Successful trend analysis is done by our analysts using extrapolation techniques, which provide the best possible forecasts for the market.
Data Validation & Market Feedback: Validation is the most important step in the process. Validation & re-validation via an intricately designed process helps us finalize data-points to be used for final calculations.

The Brainy Insights interacts with leading companies and experts of the concerned domain to develop the analyst team’s market understanding and expertise. It improves and substantiates every single data presented in the market reports. The data validation interview and discussion panels are typically composed of the most experienced industry members. The participants include, however, are not limited to:
Moreover, we always validate our data and findings through primary respondents from all the major regions we are working on.


Free Customization
Fortune 500 Clients
Free Yearly Update On Purchase Of Multi/Corporate License
Companies Served Till Date