- +1-315-215-1633
- sales@thebrainyinsights.com

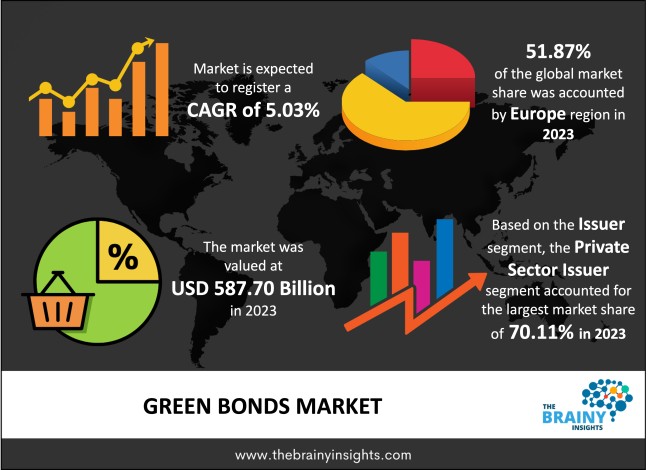
The global green bonds market was valued at USD 587.70 billion in 2023 and is anticipated to grow at a CAGR of 5.03% from 2024 to 2033. The global green bonds market is expected to reach USD 960.04 billion by 2033. The Asia Pacific is expected to grow the fastest during the forecast period. These green bonds are debt instruments that raise capital to finance climate-related or environmental projects. They are similar to conventional bonds due to fixed or variable interest rates. However, they are different as they are particularly assigned for financing or refinancing environmental projects that have a positive effect on the climate or environment, such as renewable energy use, clean energy, energy-efficient transportation, sustainable water management, and decreased greenhouse gas emissions.
The term "green bond" describes a sustainable fixed-income instrument that raises money to finance projects that have favorable effects on the environment and the climate. The International Capital Market Association's Green Bond Principles must be followed to issue green bonds. Green projects, such as those involving renewable energy, environmentally friendly transportation, sustainable water management, etc., are funded with the help of green bonds. Sectors including government-backed entities, non-financial corporates, financial corporates, sovereign, development banks, local government, ABS, and loans are frequently used to green segment bonds. Additionally, the green bond can be categorized according to issuer kinds, issuing currencies, issuing deal sizes, etc. Growing potential to finance the realization of Sustainable Development Goals, Nationally Determined Contributions, and the development of bond markets presents other green growth initiatives. In addition to highlighting the significance of sustainable bonds, a UN conference on the Sustainable Development Goals in 2021 claimed that only 1% of the approximately €300 trillion in financial assets currently traded on the market would be required to accomplish the SDGs. Green bonds are a type of green finance that is becoming increasingly popular, especially for constructing clean and sustainable infrastructure and its significant funding requirements. They provide a way to deliver green effects that can measure against standards and access capital market financing. According to the Business and Sustainable Development Commission, sustainable business strategies can open up a market potential of at least US$12 trillion. According to UN estimates, $2.5 trillion in annual investment is required to meet the Sustainable Development Goals (SDGs), of which US$1 trillion is needed for sustainable energy.
Get an overview of this study by requesting a free sample
Growing Numbers of Investors – A rising number of investors want to benefit society while reaping financial rewards. This should increase the number of potential buyers for the bond, lower borrowing costs, and improve everyone's reputation. These thematic connections have countless potential applications.
Expensive- During the forecast period, the market for green bonds would see growth restraint from the presence of inexpensive alternatives, bad press, and side effects. Tying bond proceeds to particular public spending—also known as "Ear-marking" — may result in more expensive funding or underfunding.
The growing interest of government bodies in green bonds – During the forecast period, there will be chances for growth due to rising demand in developing countries, which is expected to provide growth opportunities for the green bonds market.
Side effects associated with green bonds- As the purchase of green bonds contain some side effects, it will be considered a challenge for the market's growth over the forecast period.
The regions analyzed for the market include North America, Europe, South America, Asia Pacific, the Middle East, and Africa. Europe emerged as the largest market for the global green bonds market, with a 51.87% share of the market revenue in 2023.
Europe currently dominates the green bonds market. Green bonds have swiftly spread across global financial markets since their introduction in 2007. Geographically, it is not surprising that developed economies have the biggest green bond markets. The largest issuers are European nations, with over 750 billion US dollars in green bonds issued in Europe. Green and sustainable strategies to transform economies, increase energy efficiency, and lower emissions, to mention a few, have spurred the rapid expansion of green bonds.
The Asia Pacific is expected to be the fastest-growing region. A recent survey found that nearly two-thirds of Asian investors are eager to make their investments more sustainable, indicating that investors are generally becoming more aware of the need for sustainable investment. Governments in the region are now interested in issuing green bonds. In 2023, around 44% of the region's issuance volume was from China.
Europe Region Green Bonds Market Share in 2023 - 51.87%
www.thebrainyinsights.com
Check the geographical analysis of this market by requesting a free sample
The issuer segment is divided into public-sector issuers and private-sector issuers. The private sector issuers segment dominated, with a market share of around 70.11% in 2023. Numerous financial corporations issue green bonds across the globe under the category of private sector issuers. In 2020, public sector issuers will increasingly take the lead in the global issuing of green bonds. HSBC, BNP Paribas, Credit Agricole, and Citi Group are a few financial corporations highlighted along with their financial data and pertinent business plans.
The sector segment is divided into government-backed entities, non-financial corporates, financial corporates, sovereigns, development banks, local government, ABS, and loans. Over the forecast period, the government-backed entities segment is expected to grow at the fastest CAGR of 7.03%. As the market for green bonds is increasing, the government is excessively taking part in this, propelling the segment's growth.
| Attribute | Description |
|---|---|
| Market Size | Revenue (USD Billion) |
| Market size value in 2023 | USD 587.70 Billion |
| Market size value in 2033 | USD 960.04 Billion |
| CAGR (2024 to 2033) | 5.03% |
| Historical data | 2020-2022 |
| Base Year | 2023 |
| Forecast | 2024-2033 |
| Regional Segments | North America, Asia Pacific, Europe, Latin America, Middle East and Africa |
| Segments | Issuer, Sectors |
As per The Brainy Insights, the size of the green bonds market was valued at USD 587.70 billion in 2023 to USD 960.04 billion by 2033.
The global green bonds market is growing at a CAGR of 5.03% during the forecast period 2024-2033.
Europe emerged as the largest market for green bonds.
Key players in the green bonds market are HSBC Holdings plc, Credit Agricole, Citigroup Inc., Deutsche Bank AG, JPMorgan Chase & Co., BofA Securities, Inc., Barclays plc, TD Securities, and Morgan Stanley.
1. Introduction
1.1. Objectives of the Study
1.2. Market Definition
1.3. Research Scope
1.4. Currency
1.5. Key Target Audience
2. Research Methodology and Assumptions
3. Executive Summary
4. Premium Insights
4.1. Porter’s Five Forces Analysis
4.2. Value Chain Analysis
4.3. Top Investment Pockets
4.3.1. Market Attractiveness Analysis By Issuer
4.3.2. Market Attractiveness Analysis By Sectors
4.3.3. Market Attractiveness Analysis By Region
4.4. Industry Trends
5. Market Dynamics
5.1. Market Evaluation
5.2. Drivers
5.2.1. Growing Numbers of Investors
5.3. Restraints
5.3.1. Expensive
5.4. Opportunities
5.4.1. Growing interest of government bodies in green bonds
5.5. Challenges
5.5.1. Side effects associated with the green bonds
1. Global Green Bonds Market Analysis and Forecast, By Issuer
1.1. Segment Overview
1.2. Public Sector Issuers
1.3. Private Sector Issuers
2. Global Green Bonds Market Analysis and Forecast, By Sectors
2.1. Segment Overview
2.2. Government-Backed Entities
2.3. Non-Financial Corporates
2.4. Financial Corporates
2.5. Sovereign
2.6. Development Banks
2.7. Local Government
2.8. ABS
2.9. Loan
3. Global Green Bonds Market Analysis and Forecast, By Regional Analysis
3.1. Segment Overview
3.2. North America
3.2.1. U.S.
3.2.2. Canada
3.2.3. Mexico
3.3. Europe
3.3.1. Germany
3.3.2. France
3.3.3. U.K.
3.3.4. Italy
3.3.5. Spain
3.4. Asia-Pacific
3.4.1. Japan
3.4.2. China
3.4.3. India
3.5. South America
3.5.1. Brazil
3.6. Middle East and Africa
3.6.1. UAE
3.6.2. South Africa
4. Global Green Bonds Market-Competitive Landscape
4.1. Overview
4.2. Market Share of Key Players in Global Green Bonds Market
4.2.1. Global Company Market Share
4.2.2. North America Company Market Share
4.2.3. Europe Company Market Share
4.2.4. APAC Company Market Share
4.3. Competitive Situations and Trends
4.3.1. Product Launches and Developments
4.3.2. Partnerships, Collaborations, and Agreements
4.3.3. Mergers & Acquisitions
4.3.4. Expansions
5. Company Profiles
5.1. HSBC Holdings plc
5.1.1. Business Overview
5.1.2. Company Snapshot
5.1.3. Company Market Share Analysis
5.1.4. Company Product Portfolio
5.1.5. Recent Developments
5.1.6. SWOT Analysis
5.2. Credit Agricole
5.2.1. Business Overview
5.2.2. Company Snapshot
5.2.3. Company Market Share Analysis
5.2.4. Company Product Portfolio
5.2.5. Recent Developments
5.2.6. SWOT Analysis
5.3. Citigroup Inc.
5.3.1. Business Overview
5.3.2. Company Snapshot
5.3.3. Company Market Share Analysis
5.3.4. Company Product Portfolio
5.3.5. Recent Developments
5.3.6. SWOT Analysis
5.4. Deutsche Bank AG
5.4.1. Business Overview
5.4.2. Company Snapshot
5.4.3. Company Market Share Analysis
5.4.4. Company Product Portfolio
5.4.5. Recent Developments
5.4.6. SWOT Analysis
5.5. JPMorgan Chase & Co
5.5.1. Business Overview
5.5.2. Company Snapshot
5.5.3. Company Market Share Analysis
5.5.4. Company Product Portfolio
5.5.5. Recent Developments
5.5.6. SWOT Analysis
5.6. BofA Securities, Inc.
5.6.1. Business Overview
5.6.2. Company Snapshot
5.6.3. Company Market Share Analysis
5.6.4. Company Product Portfolio
5.6.5. Recent Developments
5.6.6. SWOT Analysis
5.7. Barclays plc
5.7.1. Business Overview
5.7.2. Company Snapshot
5.7.3. Company Market Share Analysis
5.7.4. Company Product Portfolio
5.7.5. Recent Developments
5.7.6. SWOT Analysis
5.8. TD Securities
5.8.1. Business Overview
5.8.2. Company Snapshot
5.8.3. Company Market Share Analysis
5.8.4. Company Product Portfolio
5.8.5. Recent Developments
5.8.6. SWOT Analysis
5.9. Morgan Stanley
5.9.1. Business Overview
5.9.2. Company Snapshot
5.9.3. Company Market Share Analysis
5.9.4. Company Product Portfolio
5.9.5. Recent Developments
5.9.6. SWOT Analysis
List of Table
1. Global Green Bonds Market, Issuer, 2020-2033 (USD Billion)
2. Global Public Sector Issuers, Green Bonds Market, By Region, 2020-2033 (USD Billion)
3. Global Private Sector Issuers, Green Bonds Market, By Region, 2020-2033 (USD Billion)
4. Global Green Bonds Market, By Sectors, 2020-2033 (USD Billion)
5. Global Government Backed Entities, Green Bonds Market, By Region, 2020-2033 (USD Billion)
6. Global Non-Financial Corporates, Green Bonds Market, By Region, 2020-2033 (USD Billion)
7. Global Financial Corporates, Green Bonds Market, By Region, 2020-2033 (USD Billion)
8. Global Sovereign, Green Bonds Market, By Region, 2020-2033 (USD Billion)
9. Global Development Banks, Green Bonds Market, By Region, 2020-2033 (USD Billion)
10. Global Local Government, Green Bonds Market, By Region, 2020-2033 (USD Billion)
11. Global ABS, Green Bonds Market, By Region, 2020-2033 (USD Billion)
12. Global Loan, Green Bonds Market, By Region, 2020-2033 (USD Billion)
13. North America Green Bonds Market, Issuer, 2020-2033 (USD Billion)
14. North America Green Bonds Market, By Sectors, 2020-2033 (USD Billion)
15. U.S. Green Bonds Market, Issuer, 2020-2033 (USD Billion)
16. U.S. Green Bonds Market, By Sectors, 2020-2033 (USD Billion)
17. Canada Green Bonds Market, Issuer, 2020-2033 (USD Billion)
18. Canada Green Bonds Market, By Sectors, 2020-2033 (USD Billion)
19. Mexico Green Bonds Market, Issuer, 2020-2033 (USD Billion)
20. Mexico Green Bonds Market, By Sectors, 2020-2033 (USD Billion)
21. Europe Green Bonds Market, Issuer, 2020-2033 (USD Billion)
22. Europe Green Bonds Market, By Sectors, 2020-2033 (USD Billion)
23. Germany Green Bonds Market, Issuer, 2020-2033 (USD Billion)
24. Germany Green Bonds Market, By Sectors, 2020-2033 (USD Billion)
25. France Green Bonds Market, Issuer, 2020-2033 (USD Billion)
26. France Green Bonds Market, By Sectors, 2020-2033 (USD Billion)
27. U.K. Green Bonds Market, Issuer, 2020-2033 (USD Billion)
28. U.K. Green Bonds Market, By Sectors, 2020-2033 (USD Billion)
29. Italy Green Bonds Market, Issuer, 2020-2033 (USD Billion)
30. Italy Green Bonds Market, By Sectors, 2020-2033 (USD Billion)
31. Spain Green Bonds Market, Issuer, 2020-2033 (USD Billion)
32. Spain Green Bonds Market, By Sectors, 2020-2033 (USD Billion)
33. Asia Pacific Green Bonds Market, Issuer, 2020-2033 (USD Billion)
34. Asia Pacific Green Bonds Market, By Sectors, 2020-2033 (USD Billion)
35. Japan Green Bonds Market, Issuer, 2020-2033 (USD Billion)
36. Japan Green Bonds Market, By Sectors, 2020-2033 (USD Billion)
37. China Green Bonds Market, Issuer, 2020-2033 (USD Billion)
38. China Green Bonds Market, By Sectors, 2020-2033 (USD Billion)
39. India Green Bonds Market, Issuer, 2020-2033 (USD Billion)
40. India Green Bonds Market, By Sectors, 2020-2033 (USD Billion)
41. South America Green Bonds Market, Issuer, 2020-2033 (USD Billion)
42. South America Green Bonds Market, By Sectors, 2020-2033 (USD Billion)
43. Brazil Green Bonds Market, Issuer, 2020-2033 (USD Billion)
44. Brazil Green Bonds Market, By Sectors, 2020-2033 (USD Billion)
45. Middle East and Africa Green Bonds Market, Issuer, 2020-2033 (USD Billion)
46. Middle East and Africa Green Bonds Market, By Sectors, 2020-2033 (USD Billion)
47. UAE Green Bonds Market, Issuer, 2020-2033 (USD Billion)
48. UAE Green Bonds Market, By Sectors, 2020-2033 (USD Billion)
49. South Africa Green Bonds Market, Issuer, 2020-2033 (USD Billion)
50. South Africa Green Bonds Market, By Sectors, 2020-2033 (USD Billion)
List of Figures
1. Global Green Bonds Market Segmentation
2. Global Green Bonds Market: Research Methodology
3. Market Size Estimation Methodology: Bottom-Up Approach
4. Market Size Estimation Methodology: Top-Down Approach
5. Data Triangulation
6. Porter’s Five Forces Analysis
7. Value Chain Analysis
8. Global Green Bonds Market Attractiveness Analysis Issuer
9. Global Green Bonds Market Attractiveness Analysis By Sectors
10. Global Green Bonds Market Attractiveness Analysis By Region
11. Global Green Bonds Market: Dynamics
12. Global Green Bonds Market Share Issuer (2023 & 2033)
13. Global Green Bonds Market Share By Sectors (2023 & 2033)
14. Global Green Bonds Market Share By Regions (2023 & 2033)
15. Global Green Bonds Market Share By Company (2023)
This study forecasts global, regional, and country revenue from 2020 to 2033. Brainy Insights has segmented the global green bonds market based on the below-mentioned segments:
Global Green Bonds Market by Issuer:
Global Green Bonds Market by Sectors:
Global Green Bonds Market by Region:
Research has its special purpose to undertake marketing efficiently. In this competitive scenario, businesses need information across all industry verticals; the information about customer wants, market demand, competition, industry trends, distribution channels etc. This information needs to be updated regularly because businesses operate in a dynamic environment. Our organization, The Brainy Insights incorporates scientific and systematic research procedures in order to get proper market insights and industry analysis for overall business success. The analysis consists of studying the market from a miniscule level wherein we implement statistical tools which helps us in examining the data with accuracy and precision.
Our research reports feature both; quantitative and qualitative aspects for any market. Qualitative information for any market research process are fundamental because they reveal the customer needs and wants, usage and consumption for any product/service related to a specific industry. This in turn aids the marketers/investors in knowing certain perceptions of the customers. Qualitative research can enlighten about the different product concepts and designs along with unique service offering that in turn, helps define marketing problems and generate opportunities. On the other hand, quantitative research engages with the data collection process through interviews, e-mail interactions, surveys and pilot studies. Quantitative aspects for the market research are useful to validate the hypotheses generated during qualitative research method, explore empirical patterns in the data with the help of statistical tools, and finally make the market estimations.
The Brainy Insights offers comprehensive research and analysis, based on a wide assortment of factual insights gained through interviews with CXOs and global experts and secondary data from reliable sources. Our analysts and industry specialist assume vital roles in building up statistical tools and analysis models, which are used to analyse the data and arrive at accurate insights with exceedingly informative research discoveries. The data provided by our organization have proven precious to a diverse range of companies, facilitating them to address issues such as determining which products/services are the most appealing, whether or not customers use the product in the manner anticipated, the purchasing intentions of the market and many others.
Our research methodology encompasses an idyllic combination of primary and secondary initiatives. Key phases involved in this process are listed below:

The phase involves the gathering and collecting of market data and its related information with the help of different sources & research procedures.

The data procurement stage involves in data gathering and collecting through various data sources.
This stage involves in extensive research. These data sources includes:
Purchased Database: Purchased databases play a crucial role in estimating the market sizes irrespective of the domain. Our purchased database includes:
Primary Research: The Brainy Insights interacts with leading companies and experts of the concerned domain to develop the analyst team’s market understanding and expertise. It improves and substantiates every single data presented in the market reports. Primary research mainly involves in telephonic interviews, E-mail interactions and face-to-face interviews with the raw material providers, manufacturers/producers, distributors, & independent consultants. The interviews that we conduct provides valuable data on market size and industry growth trends prevailing in the market. Our organization also conducts surveys with the various industry experts in order to gain overall insights of the industry/market. For instance, in healthcare industry we conduct surveys with the pharmacists, doctors, surgeons and nurses in order to gain insights and key information of a medical product/device/equipment which the customers are going to usage. Surveys are conducted in the form of questionnaire designed by our own analyst team. Surveys plays an important role in primary research because surveys helps us to identify the key target audiences of the market. Additionally, surveys helps to identify the key target audience engaged with the market. Our survey team conducts the survey by targeting the key audience, thus gaining insights from them. Based on the perspectives of the customers, this information is utilized to formulate market strategies. Moreover, market surveys helps us to understand the current competitive situation of the industry. To be precise, our survey process typically involve with the 360 analysis of the market. This analytical process begins by identifying the prospective customers for a product or service related to the market/industry to obtain data on how a product/service could fit into customers’ lives.

Secondary Research: The secondary data sources includes information published by the on-profit organizations such as World bank, WHO, company fillings, investor presentations, annual reports, national government documents, statistical databases, blogs, articles, white papers and others. From the annual report, we analyse a company’s revenue to understand the key segment and market share of that organization in a particular region. We analyse the company websites and adopt the product mapping technique which is important for deriving the segment revenue. In the product mapping method, we select and categorize the products offered by the companies catering to domain specific market, deduce the product revenue for each of the companies so as to get overall estimation of the market size. We also source data and analyses trends based on information received from supply side and demand side intermediaries in the value chain. The supply side denotes the data gathered from supplier, distributor, wholesaler and the demand side illustrates the data gathered from the end customers for respective market domain.

The supply side for a domain specific market is analysed by:
The demand side for the market is estimated through:
In-house Library: Apart from these third-party sources, we have our in-house library of qualitative and quantitative information. Our in-house database includes market data for various industry and domains. These data are updated on regular basis as per the changing market scenario. Our library includes, historic databases, internal audit reports and archives.
Sometimes there are instances where there is no metadata or raw data available for any domain specific market. For those cases, we use our expertise to forecast and estimate the market size in order to generate comprehensive data sets. Our analyst team adopt a robust research technique in order to produce the estimates:
Data Synthesis: This stage involves the analysis & mapping of all the information obtained from the previous step. It also involves in scrutinizing the data for any discrepancy observed while data gathering related to the market. The data is collected with consideration to the heterogeneity of sources. Robust scientific techniques are in place for synthesizing disparate data sets and provide the essential contextual information that can orient market strategies. The Brainy Insights has extensive experience in data synthesis where the data passes through various stages:


Market Deduction & Formulation: The final stage comprises of assigning data points at appropriate market spaces so as to deduce feasible conclusions. Analyst perspective & subject matter expert based holistic form of market sizing coupled with industry analysis also plays a crucial role in this stage.
This stage involves in finalization of the market size and numbers that we have collected from data integration step. With data interpolation, it is made sure that there is no gap in the market data. Successful trend analysis is done by our analysts using extrapolation techniques, which provide the best possible forecasts for the market.
Data Validation & Market Feedback: Validation is the most important step in the process. Validation & re-validation via an intricately designed process helps us finalize data-points to be used for final calculations.

The Brainy Insights interacts with leading companies and experts of the concerned domain to develop the analyst team’s market understanding and expertise. It improves and substantiates every single data presented in the market reports. The data validation interview and discussion panels are typically composed of the most experienced industry members. The participants include, however, are not limited to:
Moreover, we always validate our data and findings through primary respondents from all the major regions we are working on.


Free Customization
Fortune 500 Clients
Free Yearly Update On Purchase Of Multi/Corporate License
Companies Served Till Date