- +1-315-215-1633
- sales@thebrainyinsights.com

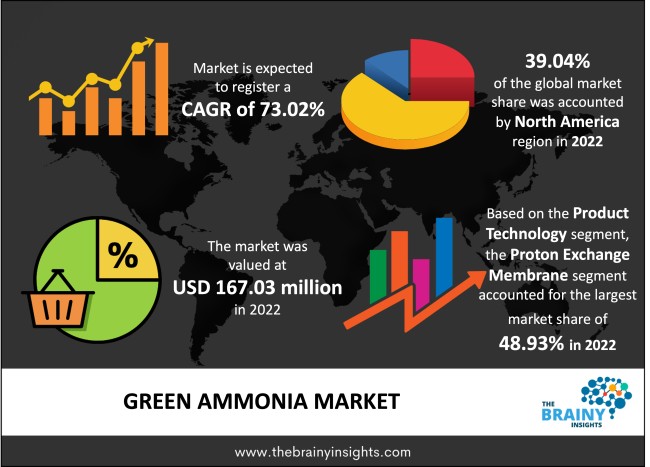
The global green ammonia market was valued at USD 167.03 Million in 2022 and grew at a CAGR of 73.02% from 2023 to 2032. The market is expected to reach USD 35748.97 Million by 2032. The demand for green ammonia is increasing among transportation and power generation applications. Further, increasing investment in renewable energy by regional agencies will provide lucrative opportunities to the market.
Green ammonia is made carbon-free by employing renewable energy to produce green hydrogen. Green ammonia manufacturing uses renewable energy sources like wind turbines, hydroelectric, or solar power. Also, it can be utilized in several enterprises like marine, agriculture, and energy storage. One mode of producing green ammonia is employing hydrogen from water electrolysis & nitrogen separated from the air. These are then provided into the Haber process, all powered by sustainable electricity. In the Haber method, nitrogen & hydrogen are reacted together at high pressures & temperatures to produce NH3 and ammonia. However, green ammonia is essential to tackling the existential challenges of making enough food to feed an increasing worldwide population & generating CO2-free energy.
Get an overview of this study by requesting a free sample
Increasing use of green ammonia in energy-efficient applications: Green ammonia can significantly decarbonize the power industry by substituting green ammonia for fossil fuels in thermal power plants that generate electricity. Through the employment of several fuel cell types, it is possible to generate green electricity. The transportation and power sectors can be decarbonized to attain net zero targets using green ammonia as a key option. The adoption of energy-efficient technologies by industrial businesses is one of the developed strategies to reduce greenhouse gas emissions. The global community has proposed encouraging the use of energy efficiency as a way to reduce greenhouse gas emissions and our contribution to climate change. The European Union and national governments are collaborating to promote the adoption of green ammonia in energy efficiency applications. Therefore, the objectives of manufacturing companies should be aided by the increased use of energy-efficient technologies.
High production cost: Green ammonia plants' high capital requirements constrain the market's expansion. The initial cost of manufacturing green ammonia is also very costly, and the lack of infrastructure to transport and store it creates additional difficulties. Additionally, the fixed cost necessary to set up the production facility is a problem, and transporting green ammonia has extra economic and safety issues. Additionally, the need for more commercialization of green ammonia restricts its growth. This element is also limiting market expansion.
Increasing investment in the renewable energy sector: Government agencies are interested in green ammonia because it can decarbonize various industries. It can reduce carbon footprints in the chemical industry, the agricultural sector, and the transportation business, including trains, trucks, and aeroplanes. In the first half of 2023, new investments in renewable energy soared to $358 billion, a 22% increase from the beginning of last year. Several variables, such as periods of rapid economic expansion and unstable fossil fuel prices that sparked worries about energy security have encouraged investments in clean energy in recent years. The respective nations' governments' involvement is vital for developing an ecosystem that accepts green ammonia as an alternate power.
The regions analyzed for the market include North America, Europe, South America, Asia Pacific, the Middle East, and Africa. North America emerged as the most significant green ammonia market, with a 39.04% market revenue share in 2022.
North America region will account for the largest market share with revenue growth. Nations such as the U.S., Canada and Mexico have a tremendous demand for green ammonia due to growing usage in transportation and energy applications. Further, the rising initiatives by the regional government and increasing investments by investors are promoting the use of green ammonia in the region. The growing production of renewable energy will lead to high adoption of green ammonia. Further, many production companies are entering into joint ventures and mergers, providing lucrative opportunities for the green ammonia market.
North American region Green Ammonia Market Share in 2022 - 39.04%
www.thebrainyinsights.com
Check the geographical analysis of this market by requesting a free sample
The technology segment is divided into solid oxide electrolysis, alkaline water electrolysis and proton exchange membrane. The proton exchange membrane segment dominated the market, with a share of around 48.93% in 2022. In addition to serving as an electrical insulator and reactive barrier, such as oxygen and hydrogen gas, it is a semipermeable membrane that transports protons. They separate reactants, convey protons, and obstruct a straight electrical channel through the membrane.
The application segment is divided into transportation, fertilizer, power generation, refrigeration, and others. The transportation segment dominated the market, with a share of around 35.04% in 2022. Green ammonia is used for transportation applications depending upon performance measures such as system effectiveness, fuel tank compactness, driving range, and cost of driving per kilometre. Green ammonia has a cooling effect, which is considered when calculating efficiency in transportation applications.
The sales channel segment is divided into direct and indirect. The indirect segment dominated the market, with a share of around 67.95% in 2022. Indirect sales channels include online marketplaces and conventional importers, retailers and distributors, who purchase from the business and resell the product. The channel length is determined based on the existence of other intermediaries, such as wholesalers and agents, in addition to retailers. It may be short in the first instance or long in the second.
| Attribute | Description |
|---|---|
| Market Size | Revenue (USD Million) |
| Market size value in 2022 | USD 167.03 Million |
| Market size value in 2032 | USD 35748.97 Million |
| CAGR (2023 to 2032) | 73.02% |
| Historical data | 2019-2021 |
| Base Year | 2022 |
| Forecast | 2023-2032 |
| Region | The regions analyzed for the market are Asia Pacific, Europe, South America, North America, and Middle East & Africa. Furthermore, the regions are further analyzed at the country level. |
| Segments | Technology, Application and Sales Channel |
As per The Brainy Insights, the size of the green ammonia market was valued USD 167.03 million in 2022 to USD 35748.97 million by 2032.
Global green ammonia market is growing at a CAGR of 73.02% during the forecast period 2023-2032.
North America region emerged as the largest market for the green ammonia.
The market's growth will be influenced by the rising usage of green ammonia in increasing energy efficiency.
The fluctuating cost of raw materials can hamper the market growth.
The rising investment in renewable energy is providing lucrative opportunities to the market.
1. Introduction
1.1. Objectives of the Study
1.2. Market Definition
1.3. Research Scope
1.4. Currency
1.5. Key Target Audience
2. Research Methodology and Assumptions
3. Executive Summary
4. Premium Insights
4.1. Porter’s Five Forces Analysis
4.2. Value Chain Analysis
4.3. Top Investment Pockets
4.3.1. Market Attractiveness Analysis by Technology
4.3.2. Market Attractiveness Analysis by Application
4.3.3. Market Attractiveness Analysis by Sales Channel
4.3.4. Market Attractiveness Analysis by Region
4.4. Industry Trends
5. Market Dynamics
5.1. Market Evaluation
5.2. Drivers
5.2.1. Increasing use of green ammonia in different applications
5.3. Restraints
5.3.1. High production cost
5.4. Opportunities
5.4.1. Rising investment in renewable energy
5.5. Challenges
5.5.1. Lack of awareness
6. Global Green Ammonia Market Analysis and Forecast, By Technology
6.1. Segment Overview
6.2. Solid Oxide Electrolysis
6.3. Alkaline Water Electrolysis
6.4. Proton Exchange Membrane
7. Global Green Ammonia Market Analysis and Forecast, By Application
7.1. Segment Overview
7.2. Transportation
7.3. Fertilizer
7.4. Power Generation
7.5. Refrigeration
7.6. Others
8. Global Green Ammonia Market Analysis and Forecast, By Sales Channel
8.1. Segment Overview
8.2. Direct
8.3. Indirect
9. Global Green Ammonia Market Analysis and Forecast, By Regional Analysis
9.1. Segment Overview
9.2. North America
9.2.1. U.S.
9.2.2. Canada
9.2.3. Mexico
9.3. Europe
9.3.1. Germany
9.3.2. France
9.3.3. U.K.
9.3.4. Italy
9.3.5. Spain
9.4. Asia-Pacific
9.4.1. Japan
9.4.2. China
9.4.3. India
9.5. South America
9.5.1. Brazil
9.6. Middle East and Africa
9.6.1. UAE
9.6.2. South Africa
10. Global Green Ammonia Market-Competitive Landscape
10.1. Overview
10.2. Market Share of Key Players in the Green Ammonia Market
10.2.1. Global Company Market Share
10.2.2. North America Company Market Share
10.2.3. Europe Company Market Share
10.2.4. APAC Company Market Share
10.3. Competitive Situations and Trends
10.3.1. Product Launches and Developments
10.3.2. Partnerships, Collaborations, and Agreements
10.3.3. Mergers & Acquisitions
10.3.4. Expansions
11. Company Profiles
11.1. Hiringa Energy
11.1.1. Business Overview
11.1.2. Company Snapshot
11.1.3. Company Market Share Analysis
11.1.4. Company Product Portfolio
11.1.5. Recent Developments
11.1.6. SWOT Analysis
11.2. MAN Energy Solutions
11.2.1. Business Overview
11.2.2. Company Snapshot
11.2.3. Company Market Share Analysis
11.2.4. Company Product Portfolio
11.2.5. Recent Developments
11.2.6. SWOT Analysis
11.3. ITM Power PLC
11.3.1. Business Overview
11.3.2. Company Snapshot
11.3.3. Company Market Share Analysis
11.3.4. Company Product Portfolio
11.3.5. Recent Developments
11.3.6. SWOT Analysis
11.4. Siemens Energy
11.4.1. Business Overview
11.4.2. Company Snapshot
11.4.3. Company Market Share Analysis
11.4.4. Company Product Portfolio
11.4.5. Recent Developments
11.4.6. SWOT Analysis
11.5. Nel Hydrogen
11.5.1. Business Overview
11.5.2. Company Snapshot
11.5.3. Company Market Share Analysis
11.5.4. Company Product Portfolio
11.5.5. Recent Developments
11.5.6. SWOT Analysis
11.6. ThyssenKrupp AG
11.6.1. Business Overview
11.6.2. Company Snapshot
11.6.3. Company Market Share Analysis
11.6.4. Company Product Portfolio
11.6.5. Recent Developments
11.6.6. SWOT Analysis
11.7. Hydrogenics
11.7.1. Business Overview
11.7.2. Company Snapshot
11.7.3. Company Market Share Analysis
11.7.4. Company Product Portfolio
11.7.5. Recent Developments
11.7.6. SWOT Analysis
11.8. McPhy Energy
11.8.1. Business Overview
11.8.2. Company Snapshot
11.8.3. Company Market Share Analysis
11.8.4. Company Product Portfolio
11.8.5. Recent Developments
11.8.6. SWOT Analysis
11.9. EXYTRON
11.9.1. Business Overview
11.9.2. Company Snapshot
11.9.3. Company Market Share Analysis
11.9.4. Company Product Portfolio
11.9.5. Recent Developments
11.9.6. SWOT Analysis
11.10. Green Hydrogen Systems
11.10.1. Business Overview
11.10.2. Company Snapshot
11.10.3. Company Market Share Analysis
11.10.4. Company Product Portfolio
11.10.5. Recent Developments
11.10.6. SWOT Analysis
11.11. Electrochaea
11.11.1. Business Overview
11.11.2. Company Snapshot
11.11.3. Company Market Share Analysis
11.11.4. Company Product Portfolio
11.11.5. Recent Developments
11.11.6. SWOT Analysis
11.12. AquaHydrex
11.12.1. Business Overview
11.12.2. Company Snapshot
11.12.3. Company Market Share Analysis
11.12.4. Company Product Portfolio
11.12.5. Recent Developments
11.12.6. SWOT Analysis
11.13. Enapter
11.13.1. Business Overview
11.13.2. Company Snapshot
11.13.3. Company Market Share Analysis
11.13.4. Company Product Portfolio
11.13.5. Recent Developments
11.13.6. SWOT Analysis
11.14. BASF SE
11.14.1. Business Overview
11.14.2. Company Snapshot
11.14.3. Company Market Share Analysis
11.14.4. Company Product Portfolio
11.14.5. Recent Developments
11.14.6. SWOT Analysis
11.15. Yara International
11.15.1. Business Overview
11.15.2. Company Snapshot
11.15.3. Company Market Share Analysis
11.15.4. Company Product Portfolio
11.15.5. Recent Developments
11.15.6. SWOT Analysis
11.16. Uniper ENGIE
11.16.1. Business Overview
11.16.2. Company Snapshot
11.16.3. Company Market Share Analysis
11.16.4. Company Product Portfolio
11.16.5. Recent Developments
11.16.6. SWOT Analysis
11.17. Haldor Topsoe
11.17.1. Business Overview
11.17.2. Company Snapshot
11.17.3. Company Market Share Analysis
11.17.4. Company Product Portfolio
11.17.5. Recent Developments
11.17.6. SWOT Analysis
11.18. Starfire Energy
11.18.1. Business Overview
11.18.2. Company Snapshot
11.18.3. Company Market Share Analysis
11.18.4. Company Product Portfolio
11.18.5. Recent Developments
11.18.6. SWOT Analysis
11.19. Queensland Nitrates Pty Ltd.
11.19.1. Business Overview
11.19.2. Company Snapshot
11.19.3. Company Market Share Analysis
11.19.4. Company Product Portfolio
11.19.5. Recent Developments
11.19.6. SWOT Analysis
List of Table
1. Global Green Ammonia Market, By Technology, 2019-2032 (USD Million)
2. Global Solid Oxide Electrolysis, Green Ammonia Market, By Region, 2019-2032 (USD Million)
3. Global Alkaline Water Electrolysis, Green Ammonia Market, By Region, 2019-2032 (USD Million)
4. Global Proton Exchange Membrane, Green Ammonia Market, By Region, 2019-2032 (USD Million)
5. Global Green Ammonia Market, By Application, 2019-2032 (USD Million)
6. Global Transportation, Green Ammonia Market, By Region, 2019-2032 (USD Million)
7. Global Fertilizer, Green Ammonia Market, By Region, 2019-2032 (USD Million)
8. Global Power Generation, Green Ammonia Market, By Region, 2019-2032 (USD Million)
9. Global Refrigeration, Green Ammonia Market, By Region, 2019-2032 (USD Million)
10. Global Others, Green Ammonia Market, By Region, 2019-2032 (USD Million)
11. Global Green Ammonia Market, By Sales Channel, 2019-2032 (USD Million)
12. Global Direct, Green Ammonia Market, By Region, 2019-2032 (USD Million)
13. Global Indirect, Green Ammonia Market, By Region, 2019-2032 (USD Million)
14. Global Green Ammonia Market, By Region, 2019-2032 (USD Million)
15. North America Green Ammonia Market, By Technology, 2019-2032 (USD Million)
16. North America Green Ammonia Market, By Application, 2019-2032 (USD Million)
17. North America Green Ammonia Market, By Sales Channel, 2019-2032 (USD Million)
18. U.S. Green Ammonia Market, By Technology, 2019-2032 (USD Million)
19. U.S. Green Ammonia Market, By Application, 2019-2032 (USD Million)
20. U.S. Green Ammonia Market, By Sales Channel, 2019-2032 (USD Million)
21. Canada Green Ammonia Market, By Technology, 2019-2032 (USD Million)
22. Canada Green Ammonia Market, By Application, 2019-2032 (USD Million)
23. Canada Green Ammonia Market, By Sales Channel, 2019-2032 (USD Million)
24. Mexico Green Ammonia Market, By Technology, 2019-2032 (USD Million)
25. Mexico Green Ammonia Market, By Application, 2019-2032 (USD Million)
26. Mexico Green Ammonia Market, By Sales Channel, 2019-2032 (USD Million)
27. Europe Green Ammonia Market, By Technology, 2019-2032 (USD Million)
28. Europe Green Ammonia Market, By Application, 2019-2032 (USD Million)
29. Europe Green Ammonia Market, By Sales Channel, 2019-2032 (USD Million)
30. Germany Green Ammonia Market, By Technology, 2019-2032 (USD Million)
31. Germany Green Ammonia Market, By Application, 2019-2032 (USD Million)
32. Germany Green Ammonia Market, By Sales Channel, 2019-2032 (USD Million)
33. France Green Ammonia Market, By Technology, 2019-2032 (USD Million)
34. France Green Ammonia Market, By Application, 2019-2032 (USD Million)
35. France Green Ammonia Market, By Sales Channel, 2019-2032 (USD Million)
36. U.K. Green Ammonia Market, By Technology, 2019-2032 (USD Million)
37. U.K. Green Ammonia Market, By Application, 2019-2032 (USD Million)
38. U.K. Green Ammonia Market, By Sales Channel, 2019-2032 (USD Million)
39. Italy Green Ammonia Market, By Technology, 2019-2032 (USD Million)
40. Italy Green Ammonia Market, By Application, 2019-2032 (USD Million)
41. Italy Green Ammonia Market, By Sales Channel, 2019-2032 (USD Million)
42. Spain Green Ammonia Market, By Technology, 2019-2032 (USD Million)
43. Spain Green Ammonia Market, By Application, 2019-2032 (USD Million)
44. Spain Green Ammonia Market, By Sales Channel, 2019-2032 (USD Million)
45. Asia Pacific Green Ammonia Market, By Technology, 2019-2032 (USD Million)
46. Asia Pacific Green Ammonia Market, By Application, 2019-2032 (USD Million)
47. Asia Pacific Green Ammonia Market, By Sales Channel, 2019-2032 (USD Million)
48. Japan Green Ammonia Market, By Technology, 2019-2032 (USD Million)
49. Japan Green Ammonia Market, By Application, 2019-2032 (USD Million)
50. Japan Green Ammonia Market, By Sales Channel, 2019-2032 (USD Million)
51. China Green Ammonia Market, By Technology, 2019-2032 (USD Million)
52. China Green Ammonia Market, By Application, 2019-2032 (USD Million)
53. China Green Ammonia Market, By Sales Channel, 2019-2032 (USD Million)
54. India Green Ammonia Market, By Technology, 2019-2032 (USD Million)
55. India Green Ammonia Market, By Application, 2019-2032 (USD Million)
56. India Green Ammonia Market, By Sales Channel, 2019-2032 (USD Million)
57. South America Green Ammonia Market, By Technology, 2019-2032 (USD Million)
58. South America Green Ammonia Market, By Application, 2019-2032 (USD Million)
59. South America Green Ammonia Market, By Sales Channel, 2019-2032 (USD Million)
60. Brazil Green Ammonia Market, By Technology, 2019-2032 (USD Million)
61. Brazil Green Ammonia Market, By Application, 2019-2032 (USD Million)
62. Brazil Green Ammonia Market, By Sales Channel, 2019-2032 (USD Million)
63. Middle East and Africa Green Ammonia Market, By Technology, 2019-2032 (USD Million)
64. Middle East and Africa Green Ammonia Market, By Application, 2019-2032 (USD Million)
65. Middle East and Africa Green Ammonia Market, By Sales Channel, 2019-2032 (USD Million)
66. UAE Green Ammonia Market, By Technology, 2019-2032 (USD Million)
67. UAE Green Ammonia Market, By Application, 2019-2032 (USD Million)
68. UAE Green Ammonia Market, By Sales Channel, 2019-2032 (USD Million)
69. South Africa Green Ammonia Market, By Technology, 2019-2032 (USD Million)
70. South Africa Green Ammonia Market, By Application, 2019-2032 (USD Million)
71. South Africa Green Ammonia Market, By Sales Channel, 2019-2032 (USD Million)
List of Figures
1. Global Green Ammonia Market Segmentation
2. Green Ammonia Market: Research Methodology
3. Market Size Estimation Methodology: Bottom-Up Approach
4. Market Size Estimation Methodology: Top-Down Approach
5. Data Triangulation
6. Porter’s Five Forces Analysis
7. Value Chain Analysis
8. Global Green Ammonia Market Attractiveness Analysis by Technology
9. Global Green Ammonia Market Attractiveness Analysis by Application
10. Global Green Ammonia Market Attractiveness Analysis by Sales Channel
11. Global Green Ammonia Market Attractiveness Analysis by Region
12. Global Green Ammonia Market: Dynamics
13. Global Green Ammonia Market Share by Technology (2022 & 2032)
14. Global Green Ammonia Market Share by Application (2022 & 2032)
15. Global Green Ammonia Market Share by Sales Channel (2022 & 2032)
16. Global Green Ammonia Market Share by Regions (2022 & 2032)
17. Global Green Ammonia Market Share by Company (2022)
This study forecasts revenue at global, regional, and country levels from 2019 to 2032. The Brainy Insights has segmented the global green ammonia market based on below mentioned segments:
Global Green Ammonia Market by Technology:
Global Green Ammonia Market by Application:
Global Green Ammonia Market by Sales Channel:
Global Green Ammonia Market by Region:
Research has its special purpose to undertake marketing efficiently. In this competitive scenario, businesses need information across all industry verticals; the information about customer wants, market demand, competition, industry trends, distribution channels etc. This information needs to be updated regularly because businesses operate in a dynamic environment. Our organization, The Brainy Insights incorporates scientific and systematic research procedures in order to get proper market insights and industry analysis for overall business success. The analysis consists of studying the market from a miniscule level wherein we implement statistical tools which helps us in examining the data with accuracy and precision.
Our research reports feature both; quantitative and qualitative aspects for any market. Qualitative information for any market research process are fundamental because they reveal the customer needs and wants, usage and consumption for any product/service related to a specific industry. This in turn aids the marketers/investors in knowing certain perceptions of the customers. Qualitative research can enlighten about the different product concepts and designs along with unique service offering that in turn, helps define marketing problems and generate opportunities. On the other hand, quantitative research engages with the data collection process through interviews, e-mail interactions, surveys and pilot studies. Quantitative aspects for the market research are useful to validate the hypotheses generated during qualitative research method, explore empirical patterns in the data with the help of statistical tools, and finally make the market estimations.
The Brainy Insights offers comprehensive research and analysis, based on a wide assortment of factual insights gained through interviews with CXOs and global experts and secondary data from reliable sources. Our analysts and industry specialist assume vital roles in building up statistical tools and analysis models, which are used to analyse the data and arrive at accurate insights with exceedingly informative research discoveries. The data provided by our organization have proven precious to a diverse range of companies, facilitating them to address issues such as determining which products/services are the most appealing, whether or not customers use the product in the manner anticipated, the purchasing intentions of the market and many others.
Our research methodology encompasses an idyllic combination of primary and secondary initiatives. Key phases involved in this process are listed below:

The phase involves the gathering and collecting of market data and its related information with the help of different sources & research procedures.

The data procurement stage involves in data gathering and collecting through various data sources.
This stage involves in extensive research. These data sources includes:
Purchased Database: Purchased databases play a crucial role in estimating the market sizes irrespective of the domain. Our purchased database includes:
Primary Research: The Brainy Insights interacts with leading companies and experts of the concerned domain to develop the analyst team’s market understanding and expertise. It improves and substantiates every single data presented in the market reports. Primary research mainly involves in telephonic interviews, E-mail interactions and face-to-face interviews with the raw material providers, manufacturers/producers, distributors, & independent consultants. The interviews that we conduct provides valuable data on market size and industry growth trends prevailing in the market. Our organization also conducts surveys with the various industry experts in order to gain overall insights of the industry/market. For instance, in healthcare industry we conduct surveys with the pharmacists, doctors, surgeons and nurses in order to gain insights and key information of a medical product/device/equipment which the customers are going to usage. Surveys are conducted in the form of questionnaire designed by our own analyst team. Surveys plays an important role in primary research because surveys helps us to identify the key target audiences of the market. Additionally, surveys helps to identify the key target audience engaged with the market. Our survey team conducts the survey by targeting the key audience, thus gaining insights from them. Based on the perspectives of the customers, this information is utilized to formulate market strategies. Moreover, market surveys helps us to understand the current competitive situation of the industry. To be precise, our survey process typically involve with the 360 analysis of the market. This analytical process begins by identifying the prospective customers for a product or service related to the market/industry to obtain data on how a product/service could fit into customers’ lives.

Secondary Research: The secondary data sources includes information published by the on-profit organizations such as World bank, WHO, company fillings, investor presentations, annual reports, national government documents, statistical databases, blogs, articles, white papers and others. From the annual report, we analyse a company’s revenue to understand the key segment and market share of that organization in a particular region. We analyse the company websites and adopt the product mapping technique which is important for deriving the segment revenue. In the product mapping method, we select and categorize the products offered by the companies catering to domain specific market, deduce the product revenue for each of the companies so as to get overall estimation of the market size. We also source data and analyses trends based on information received from supply side and demand side intermediaries in the value chain. The supply side denotes the data gathered from supplier, distributor, wholesaler and the demand side illustrates the data gathered from the end customers for respective market domain.

The supply side for a domain specific market is analysed by:
The demand side for the market is estimated through:
In-house Library: Apart from these third-party sources, we have our in-house library of qualitative and quantitative information. Our in-house database includes market data for various industry and domains. These data are updated on regular basis as per the changing market scenario. Our library includes, historic databases, internal audit reports and archives.
Sometimes there are instances where there is no metadata or raw data available for any domain specific market. For those cases, we use our expertise to forecast and estimate the market size in order to generate comprehensive data sets. Our analyst team adopt a robust research technique in order to produce the estimates:
Data Synthesis: This stage involves the analysis & mapping of all the information obtained from the previous step. It also involves in scrutinizing the data for any discrepancy observed while data gathering related to the market. The data is collected with consideration to the heterogeneity of sources. Robust scientific techniques are in place for synthesizing disparate data sets and provide the essential contextual information that can orient market strategies. The Brainy Insights has extensive experience in data synthesis where the data passes through various stages:


Market Deduction & Formulation: The final stage comprises of assigning data points at appropriate market spaces so as to deduce feasible conclusions. Analyst perspective & subject matter expert based holistic form of market sizing coupled with industry analysis also plays a crucial role in this stage.
This stage involves in finalization of the market size and numbers that we have collected from data integration step. With data interpolation, it is made sure that there is no gap in the market data. Successful trend analysis is done by our analysts using extrapolation techniques, which provide the best possible forecasts for the market.
Data Validation & Market Feedback: Validation is the most important step in the process. Validation & re-validation via an intricately designed process helps us finalize data-points to be used for final calculations.

The Brainy Insights interacts with leading companies and experts of the concerned domain to develop the analyst team’s market understanding and expertise. It improves and substantiates every single data presented in the market reports. The data validation interview and discussion panels are typically composed of the most experienced industry members. The participants include, however, are not limited to:
Moreover, we always validate our data and findings through primary respondents from all the major regions we are working on.


Free Customization
Fortune 500 Clients
Free Yearly Update On Purchase Of Multi/Corporate License
Companies Served Till Date