- +1-315-215-1633
- sales@thebrainyinsights.com

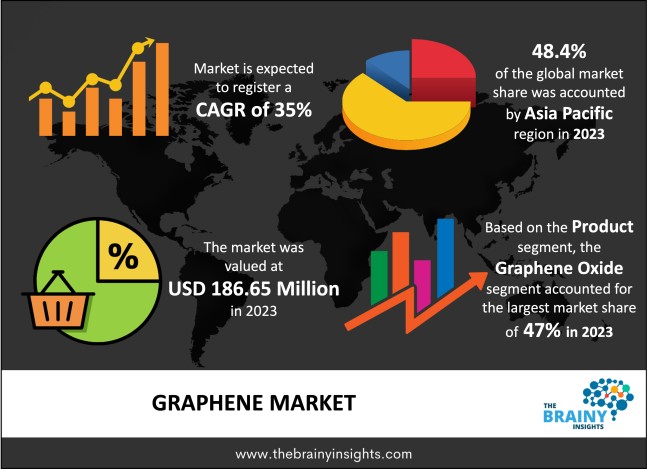
Global graphene market is expected to reach USD 3,752.83 million by 2033, at a CAGR of 35% from 2024 to 2033. Growing purchasing power and increased consumer electronics demand, such as mobile phones and tablets, are likely to propel the graphene market worldwide. Furthermore, transparent conductive films made of graphene oxide are used as a raw material in automobiles to make them safer and lighter. The market is predicted to grow because to the increasing usage of renewable energy in various sectors around the world. Furthermore, strict rules enforced by various countries to limit carbon emissions are expected to drive product demand for energy storage applications even higher. Graphene is used in composites and cuttings. It helps improve the strength, durability, and flexibility of coatings and composites, which makes it useful in industries such as automotive, aerospace, and construction.
Graphene is a carbon allotrope made up of a single layer of atoms organised in a honeycomb lattice nanostructure in two dimensions. The name comes from the words "graphite" and the suffix -ene, which refers to the fact that the graphite allotrope of carbon has a lot of double bonds. Carbon atoms are closely bonded in a hexagonal honeycomb lattice to form graphene, which is a single layer (monolayer). It's a carbon allotrope with a molecular bond length of 0.142 nanometres and a plane of sp2-bonded atoms. Graphite is made up of layers of graphene stacked on top of each other with an interplanar spacing of 0.335 nanometres. Van der Waals forces hold the individual layers of graphene in graphite together, which can be overcome during graphene exfoliation. Because of its unique combination of exceptional properties, graphene has emerged as one of the most promising nanomaterials: it conducts heat better than all other materials; it is not only the thinnest but also one of the strongest materials; it is optically transparent but so dense that it is impermeable to gases – not even the smallest gas atom can pass through it, and it is an excellent conductor of electricity. Ultrasensitive sensors, wearable and superfast electronics, medicine and biotechnology, multifunctional composites and coatings, membranes, energy harvesting and storage – graphene's unique combination of exclusive properties makes it a fascinating material platform for the development of next-generation technologies in several areas. Graphene has extraordinary properties, which is why it is used in industries where high tensile strength and durability are required. These properties improve the reinforcement property of the structure by making it wear and tear-resistant, which increases its life.
Get an overview of this study by requesting a free sample
Rapid industrialization and rising global need for flexible, lightweight, and renewable materials are two significant drivers driving the market's growth. In addition, the integration of nanotechnology into the electronics industry is helping to drive market growth. Graphene nanoplatelets are utilised to improve the physical properties of thermoplastic and thermoset composites, natural and synthetic rubber, paints, coatings, and elastomers, among other polymer materials. Graphene films are increasingly being used to make protective coatings on flexible electronic devices, batteries, and smartphones, which is fueling market growth.
Rising need for printed electronics is expected to improve market demand in the medium term. Semi-conductive or conductive ink is a key component in printed electronics. Graphene-based inks have a higher printing speed, which has resulted in the increased focus on graphene-based inks for printed electronics, which has become one of graphene's most important uses.
Over the forecast period, the toxic nature of graphene and the risk involved in the graphene production process are predicted to hinder global graphene market growth.
The market is expected to grow due to intensive research and development (R&D) operations to improve the electrical and thermal conductivity properties of graphene, as well as the widespread use of graphene in the manufacture of lightweight sports equipment.
Graphene is the world's thinnest and strongest material, with extremely high thermal and electrical conductivity. All these characteristics, along with others like high permeability and electron mobility, have generated a lot of interest in this material and its potential applications. The material is still in the early stages of its product lifetime, but it is expected to grow significantly over the next few years as it prepares to enter the graphene market.
The limitation that are diminishing the growth of the graphene market are the high cost of production, technical constraints in the production of commercial products, health and environmental issue associated with the manufacturing of 2d graphene material, due to its highly nonflammable characteristic.
Different factors, such as the lack of consumer awareness and commercial production along with limited application scope, are anticipated to hamper the growth of the global graphene market.
The global graphene market has been segmented based on product, application, and regions.
the regions analyzed for the market include north america, europe, south america, asia pacific, and the middle east and africa. Asia pacific region emerged as the largest market for the global graphene market with a 48.4% share of the market revenue in 2023.
Asia Pacific Region Graphene Market Share in 2023 - 48.4%
www.thebrainyinsights.com
Check the geographical analysis of this market by requesting a free sample
The key players are now concentrating on implementing strategies such as adopting new technology, product innovations, mergers & acquisitions, joint venture, alliances and partnerships to improve their market position in the global graphene industry.
Perpetuus Advanced Materials PLC and XG Sciences Inc. signed an agreement in December 2019 to provide graphene to North American tires manufacturers.
Directa Plus, which is a graphene production company, has acquired Setcar, and it will be operating to produce eco-friendly solutions. Also, it has collaborated with Italian based company to manufacture tires for trucks and buses, which are enhanced by graphene.
As per The Brainy Insights, the size of the graphene market was valued at USD 186.65 million in 2023 to USD 3,752.83 million by 2033.
Global graphene market is growing at a CAGR of 35% during the forecast period 2024-2033.
The global graphene market has been segmented based on product, application and regions. The electronics segment led the application segment in 2023. The graphene oxide segment led the product segment in 2023.
The Asia Pacific region emerged as the largest market for the Graphene.
Rapid industrialization is the key driving factor for the Graphene market.
The toxicity of graphene could hamper the market growth.
Research and development (R&D) activities will provide huge opportunities to the market.
Key players are ACS Material Llc, CVD Equipment Corporation, Bluestone Global Tech, Graphenea S.A., Graphene Nanochem Plc, Haydale Limited, G6 Materials, Vorbeck Materials, Nanotek Instruments, Inc., and XG Sciences.
1. Introduction
1.1. Objectives of the Study
1.2. Market Definition
1.3. Research Scope
1.4. Currency
1.5. Key Target Audience
2. Research Methodology and Assumptions
3. Executive Summary
4. Premium Insights
4.1. Porter’s Five Forces Analysis
4.2. Value Chain Analysis
4.3. Top Investment Pockets
4.3.1. Market Attractiveness Analysis By Product
4.3.2. Market Attractiveness Analysis By Application
4.3.3. Market Attractiveness Analysis By Region
4.4. Industry Trends
5. Market Dynamics
5.1. Market Evaluation
5.2. Drivers
5.2.1. Rapid industrialization
5.2.2. Increasing demand for printed electronics
5.3. Restraints
5.3.1. The toxicity of graphene
5.4. Opportunities
5.4.1. Research and development (R&D) activities
5.4.2. Exclusive features
5.5. Challenges
5.5.1. High cost of production
5.5.2. Lack of commercial production
6. Global Graphene Market Analysis and Forecast, By Product
6.1. Segment Overview
6.2. Graphene oxide
6.3. Graphene nanoplatelets
6.4. Others
7. Global Graphene Market Analysis and Forecast, By Application
7.1. Segment Overview
7.2. Electronics
7.3. Energy
7.4. Composites
7.5. Others
8. Global Graphene Market Analysis and Forecast, By Regional Analysis
8.1. Segment Overview
8.2. North America
8.2.1. U.S.
8.2.2. Canada
8.2.3. Mexico
8.3. Europe
8.3.1. Germany
8.3.2. France
8.3.3. U.K.
8.3.4. Italy
8.3.5. Spain
8.4. Asia-Pacific
8.4.1. Japan
8.4.2. China
8.4.3. India
8.5. South America
8.5.1. Brazil
8.6. Middle East and Africa
8.6.1. UAE
8.6.2. South Africa
9. Global Graphene Market-Competitive Landscape
9.1. Overview
9.2. Market Share of Key Players in Global Graphene Market
9.2.1. Global Company Market Share
9.2.2. North America Company Market Share
9.2.3. Europe Company Market Share
9.2.4. APAC Company Market Share
9.3. Competitive Situations and Trends
9.3.1. Product Launches and Developments
9.3.2. Partnerships, Collaborations, and Agreements
9.3.3. Mergers & Acquisitions
9.3.4. Expansions
10. Company Profiles
10.1. ACS Material LLC
10.1.1. Business Overview
10.1.2. Company Snapshot
10.1.3. Company Market Share Analysis
10.1.4. Company Product Portfolio
10.1.5. Recent Developments
10.1.6. SWOT Analysis
10.2. CVD Equipment Corporation
10.2.1. Business Overview
10.2.2. Company Snapshot
10.2.3. Company Market Share Analysis
10.2.4. Company Product Portfolio
10.2.5. Recent Developments
10.2.6. SWOT Analysis
10.3. Bluestone Global Tech
10.3.1. Business Overview
10.3.2. Company Snapshot
10.3.3. Company Market Share Analysis
10.3.4. Company Product Portfolio
10.3.5. Recent Developments
10.3.6. SWOT Analysis
10.4. Graphenea S.A.
10.4.1. Business Overview
10.4.2. Company Snapshot
10.4.3. Company Market Share Analysis
10.4.4. Company Product Portfolio
10.4.5. Recent Developments
10.4.6. SWOT Analysis
10.5. Graphene Nanochem Plc
10.5.1. Business Overview
10.5.2. Company Snapshot
10.5.3. Company Market Share Analysis
10.5.4. Company Product Portfolio
10.5.5. Recent Developments
10.5.6. SWOT Analysis
10.6. Haydale Limited
10.6.1. Business Overview
10.6.2. Company Snapshot
10.6.3. Company Market Share Analysis
10.6.4. Company Product Portfolio
10.6.5. Recent Developments
10.6.6. SWOT Analysis
10.7. G6 Materials
10.7.1. Business Overview
10.7.2. Company Snapshot
10.7.3. Company Market Share Analysis
10.7.4. Company Product Portfolio
10.7.5. Recent Developments
10.7.6. SWOT Analysis
10.8. Vorbeck Materials
10.8.1. Business Overview
10.8.2. Company Snapshot
10.8.3. Company Market Share Analysis
10.8.4. Company Product Portfolio
10.8.5. Recent Developments
10.8.6. SWOT Analysis
10.9. Nanotek Instruments, Inc.
10.9.1. Business Overview
10.9.2. Company Snapshot
10.9.3. Company Market Share Analysis
10.9.4. Company Product Portfolio
10.9.5. Recent Developments
10.9.6. SWOT Analysis
10.10. XG Sciences
10.10.1. Business Overview
10.10.2. Company Snapshot
10.10.3. Company Market Share Analysis
10.10.4. Company Product Portfolio
10.10.5. Recent Developments
10.10.6. SWOT Analysis
List of Table
1. Global Graphene Market, By Product, 2020–2033 (USD Million)
2. Global Graphene oxide Graphene Market, By Region, 2020–2033 (USD Million)
3. Global Graphene nanoplatelets Graphene Market, By Region, 2020–2033 (USD Million)
4. Global Graphene Market, By Application, 2020–2033 (USD Million)
5. Global Electronics Graphene Market, By Region, 2020–2033 (USD Million)
6. Global Energy Graphene Market, By Region, 2020–2033 (USD Million)
7. Global Composites Graphene Market, By Region, 2020–2033 (USD Million)
8. Global Others Graphene Market, By Region, 2020–2033 (USD Million)
9. Global Graphene Market, By Region, 2020–2033 (USD Million)
10. Global Graphene Market, By North America, 2020–2033 (USD Million)
11. North America Graphene Market, By Product, 2020–2033 (USD Million)
12. North America Graphene Market, By Application, 2020–2033 (USD Million)
13. U.S. Graphene Market, By Product, 2020–2033 (USD Million)
14. U.S. Graphene Market, By Application, 2020–2033 (USD Million)
15. Canada Graphene Market, By Product, 2020–2033 (USD Million)
16. Canada Graphene Market, By Application, 2020–2033 (USD Million)
17. Mexico Graphene Market, By Product, 2020–2033 (USD Million)
18. Mexico Graphene Market, By Application, 2020–2033 (USD Million)
19. Europe Graphene Market, By Product, 2020–2033 (USD Million)
20. Europe Graphene Market, By Application, 2020–2033 (USD Million)
21. Germany Graphene Market, By Product, 2020–2033 (USD Million)
22. Germany Graphene Market, By Application, 2020–2033 (USD Million)
23. France Graphene Market, By Product, 2020–2033 (USD Million)
24. France Graphene Market, By Application, 2020–2033 (USD Million)
25. U.K. Graphene Market, By Product, 2020–2033 (USD Million)
26. U.K. Graphene Market, By Application, 2020–2033 (USD Million)
27. Italy Graphene Market, By Product, 2020–2033 (USD Million)
28. Italy Graphene Market, By Application, 2020–2033 (USD Million)
29. Spain Graphene Market, By Product, 2020–2033 (USD Million)
30. Spain Graphene Market, By Application, 2020–2033 (USD Million)
31. Asia Pacific Graphene Market, By Product, 2020–2033 (USD Million)
32. Asia Pacific Graphene Market, By Application, 2020–2033 (USD Million)
33. Japan Graphene Market, By Product, 2020–2033 (USD Million)
34. Japan Graphene Market, By Application, 2020–2033 (USD Million)
35. China Graphene Market, By Product, 2020–2033 (USD Million)
36. China Graphene Market, By Application, 2020–2033 (USD Million)
37. India Graphene Market, By Product, 2020–2033 (USD Million)
38. India Graphene Market, By Application, 2020–2033 (USD Million)
39. South America Graphene Market, By Product, 2020–2033 (USD Million)
40. South America Graphene Market, By Application, 2020–2033 (USD Million)
41. Brazil Graphene Market, By Product, 2020–2033 (USD Million)
42. Brazil Graphene Market, By Application, 2020–2033 (USD Million)
43. Middle East and Africa Graphene Market, By Product, 2020–2033 (USD Million)
44. Middle East and Africa Graphene Market, By Application, 2020–2033 (USD Million)
45. UAE Graphene Market, By Product, 2020–2033 (USD Million)
46. UAE Graphene Market, By Application, 2020–2033 (USD Million)
47. South Africa Graphene Market, By Product, 2020–2033 (USD Million)
48. South Africa Graphene Market, By Application, 2020–2033 (USD Million)
List of Figures
1. Global Graphene Market Segmentation
2. Graphene Market: Research Methodology
3. Market Size Estimation Methodology: Bottom-Up Approach
4. Market Size Estimation Methodology: Top-Down Approach
5. Data Triangulation
6. Porter’s Five Forces Analysis
7. Value Chain Analysis
8. Global Graphene Market Attractiveness Analysis By Product
9. Global Graphene Market Attractiveness Analysis By Application
10. Global Graphene Market Attractiveness Analysis By Region
11. Global Graphene Market: Dynamics
12. Global Graphene Market Share By Product (2023 & 2033)
13. Global Graphene Market Share By Application (2023 & 2033)
14. Global Graphene Market Share by Regions (2023 & 2033)
15. Global Graphene Market Share by Company (2023)
This study forecasts revenue at global, regional, and country levels from 2020 to 2033. The Brainy Insights has segmented the global graphene market based on below mentioned segments:
Global Graphene Market by Product:
Global Graphene Market by Application:
Global Graphene Market by Region:
Research has its special purpose to undertake marketing efficiently. In this competitive scenario, businesses need information across all industry verticals; the information about customer wants, market demand, competition, industry trends, distribution channels etc. This information needs to be updated regularly because businesses operate in a dynamic environment. Our organization, The Brainy Insights incorporates scientific and systematic research procedures in order to get proper market insights and industry analysis for overall business success. The analysis consists of studying the market from a miniscule level wherein we implement statistical tools which helps us in examining the data with accuracy and precision.
Our research reports feature both; quantitative and qualitative aspects for any market. Qualitative information for any market research process are fundamental because they reveal the customer needs and wants, usage and consumption for any product/service related to a specific industry. This in turn aids the marketers/investors in knowing certain perceptions of the customers. Qualitative research can enlighten about the different product concepts and designs along with unique service offering that in turn, helps define marketing problems and generate opportunities. On the other hand, quantitative research engages with the data collection process through interviews, e-mail interactions, surveys and pilot studies. Quantitative aspects for the market research are useful to validate the hypotheses generated during qualitative research method, explore empirical patterns in the data with the help of statistical tools, and finally make the market estimations.
The Brainy Insights offers comprehensive research and analysis, based on a wide assortment of factual insights gained through interviews with CXOs and global experts and secondary data from reliable sources. Our analysts and industry specialist assume vital roles in building up statistical tools and analysis models, which are used to analyse the data and arrive at accurate insights with exceedingly informative research discoveries. The data provided by our organization have proven precious to a diverse range of companies, facilitating them to address issues such as determining which products/services are the most appealing, whether or not customers use the product in the manner anticipated, the purchasing intentions of the market and many others.
Our research methodology encompasses an idyllic combination of primary and secondary initiatives. Key phases involved in this process are listed below:

The phase involves the gathering and collecting of market data and its related information with the help of different sources & research procedures.

The data procurement stage involves in data gathering and collecting through various data sources.
This stage involves in extensive research. These data sources includes:
Purchased Database: Purchased databases play a crucial role in estimating the market sizes irrespective of the domain. Our purchased database includes:
Primary Research: The Brainy Insights interacts with leading companies and experts of the concerned domain to develop the analyst team’s market understanding and expertise. It improves and substantiates every single data presented in the market reports. Primary research mainly involves in telephonic interviews, E-mail interactions and face-to-face interviews with the raw material providers, manufacturers/producers, distributors, & independent consultants. The interviews that we conduct provides valuable data on market size and industry growth trends prevailing in the market. Our organization also conducts surveys with the various industry experts in order to gain overall insights of the industry/market. For instance, in healthcare industry we conduct surveys with the pharmacists, doctors, surgeons and nurses in order to gain insights and key information of a medical product/device/equipment which the customers are going to usage. Surveys are conducted in the form of questionnaire designed by our own analyst team. Surveys plays an important role in primary research because surveys helps us to identify the key target audiences of the market. Additionally, surveys helps to identify the key target audience engaged with the market. Our survey team conducts the survey by targeting the key audience, thus gaining insights from them. Based on the perspectives of the customers, this information is utilized to formulate market strategies. Moreover, market surveys helps us to understand the current competitive situation of the industry. To be precise, our survey process typically involve with the 360 analysis of the market. This analytical process begins by identifying the prospective customers for a product or service related to the market/industry to obtain data on how a product/service could fit into customers’ lives.

Secondary Research: The secondary data sources includes information published by the on-profit organizations such as World bank, WHO, company fillings, investor presentations, annual reports, national government documents, statistical databases, blogs, articles, white papers and others. From the annual report, we analyse a company’s revenue to understand the key segment and market share of that organization in a particular region. We analyse the company websites and adopt the product mapping technique which is important for deriving the segment revenue. In the product mapping method, we select and categorize the products offered by the companies catering to domain specific market, deduce the product revenue for each of the companies so as to get overall estimation of the market size. We also source data and analyses trends based on information received from supply side and demand side intermediaries in the value chain. The supply side denotes the data gathered from supplier, distributor, wholesaler and the demand side illustrates the data gathered from the end customers for respective market domain.

The supply side for a domain specific market is analysed by:
The demand side for the market is estimated through:
In-house Library: Apart from these third-party sources, we have our in-house library of qualitative and quantitative information. Our in-house database includes market data for various industry and domains. These data are updated on regular basis as per the changing market scenario. Our library includes, historic databases, internal audit reports and archives.
Sometimes there are instances where there is no metadata or raw data available for any domain specific market. For those cases, we use our expertise to forecast and estimate the market size in order to generate comprehensive data sets. Our analyst team adopt a robust research technique in order to produce the estimates:
Data Synthesis: This stage involves the analysis & mapping of all the information obtained from the previous step. It also involves in scrutinizing the data for any discrepancy observed while data gathering related to the market. The data is collected with consideration to the heterogeneity of sources. Robust scientific techniques are in place for synthesizing disparate data sets and provide the essential contextual information that can orient market strategies. The Brainy Insights has extensive experience in data synthesis where the data passes through various stages:


Market Deduction & Formulation: The final stage comprises of assigning data points at appropriate market spaces so as to deduce feasible conclusions. Analyst perspective & subject matter expert based holistic form of market sizing coupled with industry analysis also plays a crucial role in this stage.
This stage involves in finalization of the market size and numbers that we have collected from data integration step. With data interpolation, it is made sure that there is no gap in the market data. Successful trend analysis is done by our analysts using extrapolation techniques, which provide the best possible forecasts for the market.
Data Validation & Market Feedback: Validation is the most important step in the process. Validation & re-validation via an intricately designed process helps us finalize data-points to be used for final calculations.

The Brainy Insights interacts with leading companies and experts of the concerned domain to develop the analyst team’s market understanding and expertise. It improves and substantiates every single data presented in the market reports. The data validation interview and discussion panels are typically composed of the most experienced industry members. The participants include, however, are not limited to:
Moreover, we always validate our data and findings through primary respondents from all the major regions we are working on.


Free Customization
Fortune 500 Clients
Free Yearly Update On Purchase Of Multi/Corporate License
Companies Served Till Date