- +1-315-215-1633
- sales@thebrainyinsights.com

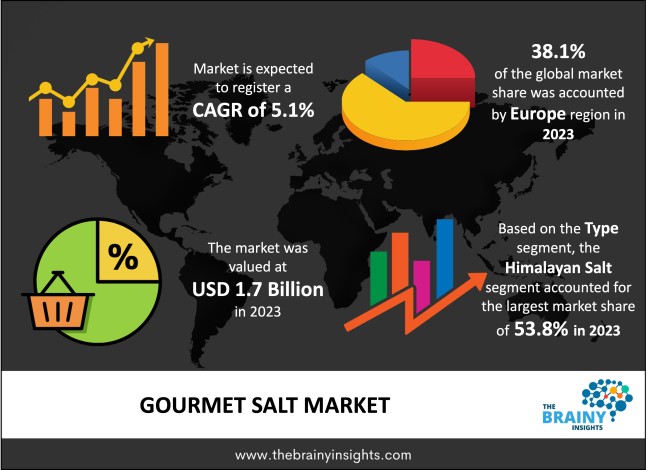
The Gourmet Salts Market was valued at USD 1.7 billion in 2023 and grew at a CAGR of 5.1% from 2024 to 2033. Gourmet salts are raw sea salts that are similar to table salt in every respects but texture and size. Compared to regular salt, it has a brighter color and a more intense, unique flavor. Salads, soups, pasta dishes, stews, and several other recipes call for it. Gourmet salt is more soluble and has a higher mineral concentration. It can be applied to herbs and other spices to bring out their color and flavor. Gourmet salt is utilized in a lot of things, like chicken, savory dishes, baked goods, and confections. Food products in cans are preserved with it to lengthen their shelf life.
Special salts that are naturally harvested and unrefined are called gourmet salts. They often have a lower salt level and are additive-free. Gourmet salts give meals a distinct flavor and are high in minerals. Gourmet salts are prized not only for their nutritional content but also for their vivid hues. Gourmet salts that are well-known include pink salt from the Himalayas, pink salt from Peru, red and black Hawaiian salt, and Australian salt. Gourmet chefs elevate foods' organoleptic properties and lend them a refined touch by utilizing specialty salts.
Get an overview of this study by requesting a free sample
The abundance of gourmet salt variants, such as fleur de sel, smoked salt, sea salt, Himalayan salt, and black lava salt, gives consumers the freedom to try a variety of flavors and textures. Additionally, consumers are searching for unusual ingredients, such as gourmet salts, to improve their cooking experiences and produce different flavors, due to the increasing curiosity in cooking and culinary exploration.
Gourmet salts are frequently more expensive than ordinary table salt, and since they are seen as luxury goods by some customers, affordability issues may arise. Notwithstanding initiatives to increase awareness, some customers might still be ignorant of the varieties, tastes, and applications of gourmet salts, which would restrict their uptake.
Opportunities for market expansion can arise from funding educational programs to raise consumer understanding of the numerous kinds of gourmet salts, their flavors, and their culinary applications. Furthermore, highlighting the nutritional advantages of gourmet salts—such as their high mineral content—can draw in health-conscious customers looking for table salt substitutes.
Europe led the market in 2023 with the largest market share of 38.1%. Gourmet cuisine and its many culinary traditions are well-known in Europe. The market for premium gourmet salts is driven by the love of fine dining and culinary exploration in nations like France, Italy, and Spain. Additionally, customers in Europe are becoming more aware of their wellness and health. Gourmet salts fit well with these wellness trends and draw in health-conscious customers because they are frequently thought of as natural and mineral-rich.
Europe Region Gourmet Salts Market Share in 2023 - 38.1%
www.thebrainyinsights.com
Check the geographical analysis of this market by requesting a free sample
The Himalayan salt segment dominated the global market in 2023 with a market share of 53.8%. The unique pink hue of Himalayan salt is a result of its high concentration of trace minerals, such as iron, potassium, and magnesium. Customers believe that these minerals are good for their overall health and well-being. Additionally, consumers' interest is piqued by the belief that Himalayan salt is a better option than regular table salt because of its mineral content, particularly among those looking for raw and unprocessed solutions.
The Bakery and confectionary segment dominated the global market in 2023 with a market share of 33.8%. To balance and enhance flavors, gourmet salts are used in bakeries and confectioneries. Their distinct mineral profiles—like the delicate sweetness of Himalayan salt—improve the flavor profile. Additionally, gourmet salts are used to provide baked goods texture and crunch, adding a sensory element to the eating experience. Particularly, these salts are utilized to create unique textures, such as flake salts or pyramid-shaped crystals.
The offline segment dominated the global market in 2023 with a market share of 68.7%. Gourmet salts have distinctive smells and uses, and in-store tastings and product demonstrations by experienced employees or brand ambassadors can inform customers about these features and entice them to buy. Additionally, gourmet salt items frequently have a prominent place in premium and specialty shops, offering a designated area for customers looking for distinctive and high-quality cooking components. Additionally, specialty physical stores frequently stock a unique assortment of gourmet salt variants, such as rare or limited editions, giving customers access to distinctive choices.
| Attribute | Description |
|---|---|
| Market Size | Revenue (USD Billion) |
| Market size value in 2023 | USD 1.7 Billion |
| Market size value in 2033 | USD 2.6 Billion |
| CAGR (2024 to 2033) | 5.1% |
| Historical data | 2020-2022 |
| Base Year | 2023 |
| Forecast | 2024-2033 |
| Region | The regions analyzed for the market are Asia Pacific, Europe, South America, North America, and Middle East & Africa. Furthermore, the regions are further analyzed at the country level. |
| Segments | Type, Source, Distribution Channel |
As per The Brainy Insights, the size of the gourmet salt market was valued at USD 1.7 billion in 2023 to USD 2.6 billion by 2033.
The global gourmet salt market is growing at a CAGR of 5.1% during the forecast period 2024-2033.
The Europe region emerged as the largest market for the gourmet salt.
The increasing consumer interest in gourmet and specialty foods will influence the market's growth.
1. Introduction
1.1. Objectives of the Study
1.2. Market Definition
1.3. Research Scope
1.4. Currency
1.5. Key Target Audience
2. Research Methodology and Assumptions
3. Executive Summary
4. Premium Insights
4.1. Porter’s Five Forces Analysis
4.2. Value Chain Analysis
4.3. Top Investment Pockets
4.3.1. Market Attractiveness Analysis by Type
4.3.2. Market Attractiveness Analysis by Source
4.3.3. Market Attractiveness Analysis by Distribution Channel
4.3.4. Market Attractiveness Analysis by Region
4.4. Industry Trends
5. Market Dynamics
5.1. Market Evaluation
5.2. Drivers
5.2.1. Increasing Consumer Interest in Gourmet and Specialty Foods
5.3. Restraints
5.3.1. Price Sensitivity
5.4. Opportunities
5.4.1. E-commerce and Online Retailing
5.5. Challenges
5.5.1. Lack of Standardization
6. Global Gourmet Salt Market Analysis and Forecast, By Type
6.1. Segment Overview
6.2. Sel Gris
6.3. Flakey Salt
6.4. Himalayan Salt
6.5. Fleur de Sel
6.6. Specialty Salt
7. Global Gourmet Salt Market Analysis and Forecast, By Source
7.1. Segment Overview
7.2. Bakery & Confectionary
7.3. Meat & Poultry
7.4. Seafood
7.5. Savouries & Sauces
8. Global Gourmet Salt Market Analysis and Forecast, By Distribution Channel
8.1. Segment Overview
8.2. Online
8.3. Offline
9. Global Gourmet Salt Market Analysis and Forecast, By Regional Analysis
9.1. Segment Overview
9.2. North America
9.2.1. U.S.
9.2.2. Canada
9.2.3. Mexico
9.3. Europe
9.3.1. Germany
9.3.2. France
9.3.3. U.K.
9.3.4. Italy
9.3.5. Spain
9.4. Asia-Pacific
9.4.1. Japan
9.4.2. China
9.4.3. India
9.5. South America
9.5.1. Brazil
9.6. Middle East and Africa
9.6.1. UAE
9.6.2. South Africa
10. Global Gourmet Salt Market-Competitive Landscape
10.1. Overview
10.2. Market Share of Key Players in the Gourmet Salt Market
10.2.1. Global Company Market Share
10.2.2. North America Company Market Share
10.2.3. Europe Company Market Share
10.2.4. APAC Company Market Share
10.3. Competitive Situations and Trends
10.3.1. Product Launches and Developments
10.3.2. Partnerships, Collaborations, and Agreements
10.3.3. Mergers & Acquisitions
10.3.4. Expansions
11. Company Profiles
11.1. Morton Salt Inc.
11.1.1. Business Overview
11.1.2. Company Snapshot
11.1.3. Company Market Share Analysis
11.1.4. Company Product Portfolio
11.1.5. Recent Developments
11.1.6. SWOT Analysis
11.2. Saltworks Inc.
11.2.1. Business Overview
11.2.2. Company Snapshot
11.2.3. Company Market Share Analysis
11.2.4. Company Product Portfolio
11.2.5. Recent Developments
11.2.6. SWOT Analysis
11.3. Cargill Inc.
11.3.1. Business Overview
11.3.2. Company Snapshot
11.3.3. Company Market Share Analysis
11.3.4. Company Product Portfolio
11.3.5. Recent Developments
11.3.6. SWOT Analysis
11.4. Murray River Gourmet Salt
11.4.1. Business Overview
11.4.2. Company Snapshot
11.4.3. Company Market Share Analysis
11.4.4. Company Product Portfolio
11.4.5. Recent Developments
11.4.6. SWOT Analysis
11.5. Cheetham Salt Ltd.
11.5.1. Business Overview
11.5.2. Company Snapshot
11.5.3. Company Market Share Analysis
11.5.4. Company Product Portfolio
11.5.5. Recent Developments
11.5.6. SWOT Analysis
11.6. Alaska Pure Sea Salt Co.
11.6.1. Business Overview
11.6.2. Company Snapshot
11.6.3. Company Market Share Analysis
11.6.4. Company Product Portfolio
11.6.5. Recent Developments
11.6.6. SWOT Analysis
11.7. Amagansett Sea Salt Co.
11.7.1. Business Overview
11.7.2. Company Snapshot
11.7.3. Company Market Share Analysis
11.7.4. Company Product Portfolio
11.7.5. Recent Developments
11.7.6. SWOT Analysis
11.8. Infosa
11.8.1. Business Overview
11.8.2. Company Snapshot
11.8.3. Company Market Share Analysis
11.8.4. Company Product Portfolio
11.8.5. Recent Developments
11.8.6. SWOT Analysis
11.9. Pyramid Salt Pty. Ltd.
11.9.1. Business Overview
11.9.2. Company Snapshot
11.9.3. Company Market Share Analysis
11.9.4. Company Product Portfolio
11.9.5. Recent Developments
11.9.6. SWOT Analysis
11.10. Maldon Crystal Salt Company Ltd
11.10.1. Business Overview
11.10.2. Company Snapshot
11.10.3. Company Market Share Analysis
11.10.4. Company Product Portfolio
11.10.5. Recent Developments
11.10.6. SWOT Analysis
List of Table
1. Global Gourmet Salt Market, By Type, 2020-2033 (USD Billion)
2. Global Sel Gris Gourmet Salt Market, By Region, 2020-2033 (USD Billion)
3. Global Flakey Salt Gourmet Salt Market, By Region, 2020-2033 (USD Billion)
4. Global Himalayan Salt Gourmet Salt Market, By Region, 2020-2033 (USD Billion)
5. Global Fleur de Sel Gourmet Salt Market, By Region, 2020-2033 (USD Billion)
6. Global Specialty Salt Gourmet Salt Market, By Region, 2020-2033 (USD Billion)
7. Global Gourmet Salt Market, By Source, 2020-2033 (USD Billion)
8. Global Bakery & Confectionary Gourmet Salt Market, By Region, 2020-2033 (USD Billion)
9. Global Meat & Poultry Gourmet Salt Market, By Region, 2020-2033 (USD Billion)
10. Global Seafood Gourmet Salt Market, By Region, 2020-2033 (USD Billion)
11. Global Savouries & Sauces Gourmet Salt Market, By Region, 2020-2033 (USD Billion)
12. Global Gourmet Salt Market, By Distribution Channel, 2020-2033 (USD Billion)
13. Global Online Gourmet Salt Market, By Region, 2020-2033 (USD Billion)
14. Global Offline Gourmet Salt Market, By Region, 2020-2033 (USD Billion)
15. Global Gourmet Salt Market, By Region, 2020-2033 (USD Billion)
16. North America Gourmet Salt Market, By Type, 2020-2033 (USD Billion)
17. North America Gourmet Salt Market, By Source, 2020-2033 (USD Billion)
18. North America Gourmet Salt Market, By Distribution Channel, 2020-2033 (USD Billion)
19. U.S. Gourmet Salt Market, By Type, 2020-2033 (USD Billion)
20. U.S. Gourmet Salt Market, By Source, 2020-2033 (USD Billion)
21. U.S. Gourmet Salt Market, By Distribution Channel, 2020-2033 (USD Billion)
22. Canada Gourmet Salt Market, By Type, 2020-2033 (USD Billion)
23. Canada Gourmet Salt Market, By Source, 2020-2033 (USD Billion)
24. Canada Gourmet Salt Market, By Distribution Channel, 2020-2033 (USD Billion)
25. Mexico Gourmet Salt Market, By Type, 2020-2033 (USD Billion)
26. Mexico Gourmet Salt Market, By Source, 2020-2033 (USD Billion)
27. Mexico Gourmet Salt Market, By Distribution Channel, 2020-2033 (USD Billion)
28. Europe Gourmet Salt Market, By Type, 2020-2033 (USD Billion)
29. Europe Gourmet Salt Market, By Source, 2020-2033 (USD Billion)
30. Europe Gourmet Salt Market, By Distribution Channel, 2020-2033 (USD Billion)
31. Germany Gourmet Salt Market, By Type, 2020-2033 (USD Billion)
32. Germany Gourmet Salt Market, By Source, 2020-2033 (USD Billion)
33. Germany Gourmet Salt Market, By Distribution Channel, 2020-2033 (USD Billion)
34. France Gourmet Salt Market, By Type, 2020-2033 (USD Billion)
35. France Gourmet Salt Market, By Source, 2020-2033 (USD Billion)
36. France Gourmet Salt Market, By Distribution Channel, 2020-2033 (USD Billion)
37. U.K. Gourmet Salt Market, By Type, 2020-2033 (USD Billion)
38. U.K. Gourmet Salt Market, By Source, 2020-2033 (USD Billion)
39. U.K. Gourmet Salt Market, By Distribution Channel, 2020-2033 (USD Billion)
40. Italy Gourmet Salt Market, By Type, 2020-2033 (USD Billion)
41. Italy Gourmet Salt Market, By Source, 2020-2033 (USD Billion)
42. Italy Gourmet Salt Market, By Distribution Channel, 2020-2033 (USD Billion)
43. Spain Gourmet Salt Market, By Type, 2020-2033 (USD Billion)
44. Spain Gourmet Salt Market, By Source, 2020-2033 (USD Billion)
45. Spain Gourmet Salt Market, By Distribution Channel, 2020-2033 (USD Billion)
46. Asia Pacific Gourmet Salt Market, By Type, 2020-2033 (USD Billion)
47. Asia Pacific Gourmet Salt Market, By Source, 2020-2033 (USD Billion)
48. Asia Pacific Gourmet Salt Market, By Distribution Channel, 2020-2033 (USD Billion)
49. Japan Gourmet Salt Market, By Type, 2020-2033 (USD Billion)
50. Japan Gourmet Salt Market, By Source, 2020-2033 (USD Billion)
51. Japan Gourmet Salt Market, By Distribution Channel, 2020-2033 (USD Billion)
52. China Gourmet Salt Market, By Type, 2020-2033 (USD Billion)
53. China Gourmet Salt Market, By Source, 2020-2033 (USD Billion)
54. China Gourmet Salt Market, By Distribution Channel, 2020-2033 (USD Billion)
55. India Gourmet Salt Market, By Type, 2020-2033 (USD Billion)
56. India Gourmet Salt Market, By Source, 2020-2033 (USD Billion)
57. India Gourmet Salt Market, By Distribution Channel, 2020-2033 (USD Billion)
58. South America Gourmet Salt Market, By Type, 2020-2033 (USD Billion)
59. South America Gourmet Salt Market, By Source, 2020-2033 (USD Billion)
60. South America Gourmet Salt Market, By Distribution Channel, 2020-2033 (USD Billion)
61. Brazil Gourmet Salt Market, By Type, 2020-2033 (USD Billion)
62. Brazil Gourmet Salt Market, By Source, 2020-2033 (USD Billion)
63. Brazil Gourmet Salt Market, By Distribution Channel, 2020-2033 (USD Billion)
64. Middle East and Africa Gourmet Salt Market, By Type, 2020-2033 (USD Billion)
65. Middle East and Africa Gourmet Salt Market, By Source, 2020-2033 (USD Billion)
66. Middle East and Africa Gourmet Salt Market, By Distribution Channel, 2020-2033 (USD Billion)
67. UAE Gourmet Salt Market, By Type, 2020-2033 (USD Billion)
68. UAE Gourmet Salt Market, By Source, 2020-2033 (USD Billion)
69. UAE Gourmet Salt Market, By Distribution Channel, 2020-2033 (USD Billion)
70. South Africa Gourmet Salt Market, By Type, 2020-2033 (USD Billion)
71. South Africa Gourmet Salt Market, By Source, 2020-2033 (USD Billion)
72. South Africa Gourmet Salt Market, By Distribution Channel, 2020-2033 (USD Billion)
List of Figures
1. Global Gourmet Salt Market Segmentation
2. Gourmet Salt Market: Research Methodology
3. Market Size Estimation Methodology: Bottom-Up Approach
4. Market Size Estimation Methodology: Top-Down Approach
5. Data Triangulation
6. Porter’s Five Forces Analysis
7. Value Chain Analysis
8. Global Gourmet Salt Market Attractiveness Analysis by Type
9. Global Gourmet Salt Market Attractiveness Analysis by Source
10. Global Gourmet Salt Market Attractiveness Analysis by Distribution Channel
11. Global Gourmet Salt Market Attractiveness Analysis by Region
12. Global Gourmet Salt Market: Dynamics
13. Global Gourmet Salt Market Share by Type (2023 & 2033)
14. Global Gourmet Salt Market Share by Source (2023 & 2033)
15. Global Gourmet Salt Market Share by Distribution Channel (2023 & 2033)
16. Global Gourmet Salt Market Share by Regions (2023 & 2033)
17. Global Gourmet Salt Market Share by Company (2023)
This study forecasts revenue at global, regional, and country levels from 2020 to 2033. The Brainy Insights has segmented the global gourmet salt market based on below-mentioned segments:
Global Gourmet Salt Market by Type:
Global Gourmet Salt Market by Source:
Global Gourmet Salt Market by Distribution Channel:
Global Gourmet Salt Market by Region:
Research has its special purpose to undertake marketing efficiently. In this competitive scenario, businesses need information across all industry verticals; the information about customer wants, market demand, competition, industry trends, distribution channels etc. This information needs to be updated regularly because businesses operate in a dynamic environment. Our organization, The Brainy Insights incorporates scientific and systematic research procedures in order to get proper market insights and industry analysis for overall business success. The analysis consists of studying the market from a miniscule level wherein we implement statistical tools which helps us in examining the data with accuracy and precision.
Our research reports feature both; quantitative and qualitative aspects for any market. Qualitative information for any market research process are fundamental because they reveal the customer needs and wants, usage and consumption for any product/service related to a specific industry. This in turn aids the marketers/investors in knowing certain perceptions of the customers. Qualitative research can enlighten about the different product concepts and designs along with unique service offering that in turn, helps define marketing problems and generate opportunities. On the other hand, quantitative research engages with the data collection process through interviews, e-mail interactions, surveys and pilot studies. Quantitative aspects for the market research are useful to validate the hypotheses generated during qualitative research method, explore empirical patterns in the data with the help of statistical tools, and finally make the market estimations.
The Brainy Insights offers comprehensive research and analysis, based on a wide assortment of factual insights gained through interviews with CXOs and global experts and secondary data from reliable sources. Our analysts and industry specialist assume vital roles in building up statistical tools and analysis models, which are used to analyse the data and arrive at accurate insights with exceedingly informative research discoveries. The data provided by our organization have proven precious to a diverse range of companies, facilitating them to address issues such as determining which products/services are the most appealing, whether or not customers use the product in the manner anticipated, the purchasing intentions of the market and many others.
Our research methodology encompasses an idyllic combination of primary and secondary initiatives. Key phases involved in this process are listed below:

The phase involves the gathering and collecting of market data and its related information with the help of different sources & research procedures.

The data procurement stage involves in data gathering and collecting through various data sources.
This stage involves in extensive research. These data sources includes:
Purchased Database: Purchased databases play a crucial role in estimating the market sizes irrespective of the domain. Our purchased database includes:
Primary Research: The Brainy Insights interacts with leading companies and experts of the concerned domain to develop the analyst team’s market understanding and expertise. It improves and substantiates every single data presented in the market reports. Primary research mainly involves in telephonic interviews, E-mail interactions and face-to-face interviews with the raw material providers, manufacturers/producers, distributors, & independent consultants. The interviews that we conduct provides valuable data on market size and industry growth trends prevailing in the market. Our organization also conducts surveys with the various industry experts in order to gain overall insights of the industry/market. For instance, in healthcare industry we conduct surveys with the pharmacists, doctors, surgeons and nurses in order to gain insights and key information of a medical product/device/equipment which the customers are going to usage. Surveys are conducted in the form of questionnaire designed by our own analyst team. Surveys plays an important role in primary research because surveys helps us to identify the key target audiences of the market. Additionally, surveys helps to identify the key target audience engaged with the market. Our survey team conducts the survey by targeting the key audience, thus gaining insights from them. Based on the perspectives of the customers, this information is utilized to formulate market strategies. Moreover, market surveys helps us to understand the current competitive situation of the industry. To be precise, our survey process typically involve with the 360 analysis of the market. This analytical process begins by identifying the prospective customers for a product or service related to the market/industry to obtain data on how a product/service could fit into customers’ lives.

Secondary Research: The secondary data sources includes information published by the on-profit organizations such as World bank, WHO, company fillings, investor presentations, annual reports, national government documents, statistical databases, blogs, articles, white papers and others. From the annual report, we analyse a company’s revenue to understand the key segment and market share of that organization in a particular region. We analyse the company websites and adopt the product mapping technique which is important for deriving the segment revenue. In the product mapping method, we select and categorize the products offered by the companies catering to domain specific market, deduce the product revenue for each of the companies so as to get overall estimation of the market size. We also source data and analyses trends based on information received from supply side and demand side intermediaries in the value chain. The supply side denotes the data gathered from supplier, distributor, wholesaler and the demand side illustrates the data gathered from the end customers for respective market domain.

The supply side for a domain specific market is analysed by:
The demand side for the market is estimated through:
In-house Library: Apart from these third-party sources, we have our in-house library of qualitative and quantitative information. Our in-house database includes market data for various industry and domains. These data are updated on regular basis as per the changing market scenario. Our library includes, historic databases, internal audit reports and archives.
Sometimes there are instances where there is no metadata or raw data available for any domain specific market. For those cases, we use our expertise to forecast and estimate the market size in order to generate comprehensive data sets. Our analyst team adopt a robust research technique in order to produce the estimates:
Data Synthesis: This stage involves the analysis & mapping of all the information obtained from the previous step. It also involves in scrutinizing the data for any discrepancy observed while data gathering related to the market. The data is collected with consideration to the heterogeneity of sources. Robust scientific techniques are in place for synthesizing disparate data sets and provide the essential contextual information that can orient market strategies. The Brainy Insights has extensive experience in data synthesis where the data passes through various stages:


Market Deduction & Formulation: The final stage comprises of assigning data points at appropriate market spaces so as to deduce feasible conclusions. Analyst perspective & subject matter expert based holistic form of market sizing coupled with industry analysis also plays a crucial role in this stage.
This stage involves in finalization of the market size and numbers that we have collected from data integration step. With data interpolation, it is made sure that there is no gap in the market data. Successful trend analysis is done by our analysts using extrapolation techniques, which provide the best possible forecasts for the market.
Data Validation & Market Feedback: Validation is the most important step in the process. Validation & re-validation via an intricately designed process helps us finalize data-points to be used for final calculations.

The Brainy Insights interacts with leading companies and experts of the concerned domain to develop the analyst team’s market understanding and expertise. It improves and substantiates every single data presented in the market reports. The data validation interview and discussion panels are typically composed of the most experienced industry members. The participants include, however, are not limited to:
Moreover, we always validate our data and findings through primary respondents from all the major regions we are working on.


Free Customization
Fortune 500 Clients
Free Yearly Update On Purchase Of Multi/Corporate License
Companies Served Till Date