- +1-315-215-1633
- sales@thebrainyinsights.com

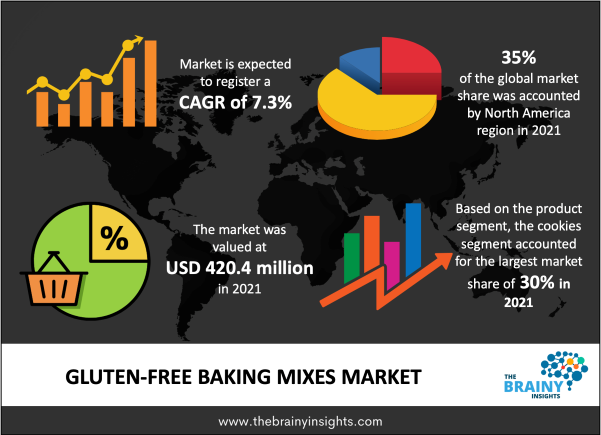
The gluten-free baking mixes market was valued at USD 420.4 million in 2021 and is expected to reach USD 750 million by 2030, expanding at a CAGR of 7.3% from 2022 to 2030. Increasing awareness about gluten-free products, coupled with growing demand from developed markets such as Europe and North America, is expected to drive and propel the market growth. Moreover, the rising availability of a variety of products is also expected to boost growth.
The increasing prevalence of celiac diseases and gluten sensitivity is also expected to propel the consumption of gluten-free products. According to Celiac Disease Foundation, celiac disease affects 1 in 100 people but only 30% of people are diagnosed with it. Thus, a large number of people are still undiagnosed which represents a significant opportunity for manufacturing companies to tap this untapped market.
The gluten-free baking mixes are made from rice flour, maize flour, tapioca flour, and other types of flour. These baking mixes are available for cookies, muffins, cakes, donuts, bread, and others. The increasing popularity of gluten-free baking mixes among consumers is expected to increase the market demand.
Get an overview of this study by requesting a free sample
The growing consumer inclination toward convenience food products, owing to busier lifestyles and hectic work schedules, is driving the demand for gluten-free baking mixes, especially cakes and muffins as these are consumed to fulfill cravings. Moreover, gluten-free baking mixes are much healthier than conventional mixes, which is also expected to propel market growth. Additionally, the increasing demand for homemade bakery products among consumers especially after the pandemic has given a boost to this market.
The rising preference for baking mixes is also driven by the numerous benefits of homemade food. For instance, making food at home is a lot more economical than eating out at a restaurant. Consumers are also willing to pay more for products that save them time. The rising demand for high-quality, organic, and vegan baking mixes could provide further opportunities in this market.
The cookies baking mixes dominated the market and held a share of over 30% in 2021. The growth of the segment can be attributed to the popularity of cookies among all age groups of people from children to adults to the older population. Further, high consumption of cookies during festive seasons such as Halloween, New Year, and Christmas is also expected to drive the growth of this segment.
Other baking mixes that include pancake, and waffles, are anticipated to expand at the highest CAGR of 7.9% during the forecast period. The product launches in this segment are also driving the segment’s growth. For instance, in December 2021, GoodSam Foods introduced gluten-free chocolate cake baking mix, fudgy brownie baking mix, and cacao pancake mix, which are available on its website for USD 10.99.
Supermarkets & hypermarkets led the market with a share of over 40% in 2021. The growth of this segment can be attributed to the presence of numerous supermarkets and grocery stores across all big and small economies. This distribution channel has always had maximum customer penetration, as they are the most convenient channel for all kinds of food products.
The increase in the number of supermarket & hypermarket chains across the world owing to growth and development in countries is driving the demand through this channel. The emergence of these supermarkets has been revolutionizing the nature of food & beverage supply. The Kroger Co, Carrefour France, Loblaws Canada, Aeon Japan, Morrisons, Hy-Vee, and Auchan are some of the key supermarket chains across the globe.
The online channel is anticipated to expand with the highest CAGR of 8.7% from 2022-2030. The shifting consumer preference towards online shopping is expected to boost the demand through this channel. Many small brands and companies have started offering products through their D2C channel and third-party retailers like Amazon, which is likely to boost the demand through this channel in the coming years.
North America accounted for the highest share of more than 35% of the market in 2021. The increasing trend of baking at home in countries like the US and Canada is driving the demand for gluten-free baking mixes. Baking mixes like cookies, pancakes, and muffins are quite popular among millennials and Gen Z. Moreover, product launches in this region are also expected to bode well for market growth. For instance, in November 2022, Gluten Free Please, LLC introduced gluten-free baking mixes such as cake mix, bread mix, and others. Several of the mixes are also free of ingredients like milk and sugar.
Asia Pacific is anticipated to register the fastest growth during the forecast period. The rising awareness about the benefits of eating gluten-free products is likely to increase the adoption of gluten-free baking mixes in the country. Further, the influence of western culture and increasing demand for cookies, cakes, and muffins are likely to propel the demand in the coming years, especially in countries such as China, India, and Australia.
The incidence of celiac disease, gluten sensitivity, and obesity is driving the growth of the gluten-free baking mixes market. According to a study published in The Medical journal of Australia in February 2020, the incidence of self‐reported non‐coeliac wheat sensitivity (SR‐NCWS) in Australia increased by 1.8% per year from 2015 to 2018. However, the majority of consumers avoid dietary gluten for abdominal symptoms, weight loss, and general health considerations and do not suffer from coeliac disease.
The players operating in this market are focused on expansion, product launches, strengthening the D2C channel, and mergers & acquisitions. For instance, in October 2018, Conagra Brands, Inc. acquired Pinnacle Foods Inc., which offers products such as gluten-free baking mixes, packaged meat, condiments, and frozen food.
Segments Covered in the Report
1. Introduction
1.1. Objectives of the Study
1.2. Market Definition
1.3. Research Scope
1.4. Currency
1.5. Key Target Audience
2. Research Methodology and Assumptions
3. Executive Summary
4. Premium Insights
4.1. Porter’s Five Forces Analysis
4.2. Value Chain Analysis
4.3. Top Investment Pockets
4.3.1. Market Attractiveness Analysis by Product
4.3.2. Market Attractiveness Analysis by Distribution Channel
4.3.3. Market Attractiveness Analysis by Region
4.4. Industry Trends
5. Market Dynamics
5.1. Market Evaluation
5.2. Drivers
5.2.1. Rising prevalence of celiac diseases and gluten sensitivity
5.3. Restraints
5.3.1. Inconvenience in production process
5.4. Opportunities
5.4.1. Increasing awareness about gluten-free products
5.5. Challenges
5.5.1. High Price
6. Global Gluten-free Baking Mixes Market Analysis and Forecast, By Product
6.1. Segment Overview
6.2. Cookies
6.3. Cakes & Pastries
6.4. Bread
6.5. Pizza
6.6. Others
7. Global Gluten-free Baking Mixes Market Analysis and Forecast, By Distribution Channel
7.1. Segment Overview
7.2. Supermarkets & Hypermarkets
7.3. Specialty Stores
7.4. Online
7.5. Others
8. Global Gluten-free Baking Mixes Market Analysis and Forecast, By Regional Analysis
8.1. Segment Overview
8.2. North America
8.2.1. U.S.
8.2.2. Canada
8.2.3. Mexico
8.3. Europe
8.3.1. Germany
8.3.2. France
8.3.3. U.K.
8.3.4. Italy
8.3.5. Spain
8.4. Asia-Pacific
8.4.1. Japan
8.4.2. China
8.4.3. India
8.5. South America
8.5.1. Brazil
8.6. Middle East and Africa
8.6.1. UAE
8.6.2. South Africa
9. Global Gluten-free Baking Mixes Market-Competitive Landscape
9.1. Overview
9.2. Market Share of Key Players in the Gluten-free Baking Mixes Market
9.2.1. Global Company Market Share
9.2.2. North America Company Market Share
9.2.3. Europe Company Market Share
9.2.4. APAC Company Market Share
9.3. Competitive Situations and Trends
9.3.1. Product Launches and Developments
9.3.2. Partnerships, Collaborations, and Agreements
9.3.3. Mergers & Acquisitions
9.3.4. Expansions
10. Company Profiles
10.1. General Mills Inc.
10.1.1. Business Overview
10.1.2. Company Snapshot
10.1.3. Company Market Share Analysis
10.1.4. Company Product Portfolio
10.1.5. Recent Developments
10.1.6. SWOT Analysis
10.2. Conagra Brands, Inc.
10.2.1. Business Overview
10.2.2. Company Snapshot
10.2.3. Company Market Share Analysis
10.2.4. Company Product Portfolio
10.2.5. Recent Developments
10.2.6. SWOT Analysis
10.3. Kinnikinnick Foods Inc.
10.3.1. Business Overview
10.3.2. Company Snapshot
10.3.3. Company Market Share Analysis
10.3.4. Company Product Portfolio
10.3.5. Recent Developments
10.3.6. SWOT Analysis
10.4. Simple Mills
10.4.1. Business Overview
10.4.2. Company Snapshot
10.4.3. Company Market Share Analysis
10.4.4. Company Product Portfolio
10.4.5. Recent Developments
10.4.6. SWOT Analysis
10.5. SalDoce Fine Foods
10.5.1. Business Overview
10.5.2. Company Snapshot
10.5.3. Company Market Share Analysis
10.5.4. Company Product Portfolio
10.5.5. Recent Developments
10.5.6. SWOT Analysis
10.6. Bob's Red Mill
10.6.1. Business Overview
10.6.2. Company Snapshot
10.6.3. Company Market Share Analysis
10.6.4. Company Product Portfolio
10.6.5. Recent Developments
10.6.6. SWOT Analysis
10.7. Pamela’s
10.7.1. Business Overview
10.7.2. Company Snapshot
10.7.3. Company Market Share Analysis
10.7.4. Company Product Portfolio
10.7.5. Recent Developments
10.7.6. SWOT Analysis
10.8. The Krusteaz Company
10.8.1. Business Overview
10.8.2. Company Snapshot
10.8.3. Company Market Share Analysis
10.8.4. Company Product Portfolio
10.8.5. Recent Developments
10.8.6. SWOT Analysis
10.9. Continental Mills, Inc.
10.9.1. Business Overview
10.9.2. Company Snapshot
10.9.3. Company Market Share Analysis
10.9.4. Company Product Portfolio
10.9.5. Recent Developments
10.9.6. SWOT Analysis
10.10. Partake Foods
10.10.1. Business Overview
10.10.2. Company Snapshot
10.10.3. Company Market Share Analysis
10.10.4. Company Product Portfolio
10.10.5. Recent Developments
10.10.6. SWOT Analysis
10.11. King Arthur Baking Company, Inc.
10.11.1. Business Overview
10.11.2. Company Snapshot
10.11.3. Company Market Share Analysis
10.11.4. Company Product Portfolio
10.11.5. Recent Developments
10.11.6. SWOT Analysis
List of Table
1. Global Gluten-free Baking Mixes Market, By Product, 2019-2030 (USD Billion)
2. Global Cookies Gluten-free Baking Mixes Market, By Region, 2019-2030 (USD Billion)
3. Global Cakes & Pastries Gluten-free Baking Mixes Market, By Region, 2019-2030 (USD Billion)
4. Global Bread Gluten-free Baking Mixes Market, By Region, 2019-2030 (USD Billion)
5. Global Pizza Gluten-free Baking Mixes Market, By Region, 2019-2030 (USD Billion)
6. Global Others Gluten-free Baking Mixes Market, By Region, 2019-2030 (USD Billion)
7. Global Gluten-free Baking Mixes Market, By Distribution Channel, 2019-2030 (USD Billion)
8. Global Supermarkets & Hypermarkets Gluten-free Baking Mixes Market, By Region, 2019-2030 (USD Billion)
9. Global Specialty Stores Gluten-free Baking Mixes Market, By Region, 2019-2030 (USD Billion)
10. Global Online Gluten-free Baking Mixes Market, By Region, 2019-2030 (USD Billion)
11. Global Others Gluten-free Baking Mixes Market, By Region, 2019-2030 (USD Billion)
12. Global Gluten-free Baking Mixes Market, By Region, 2019-2030 (USD Billion)
13. North America Gluten-free Baking Mixes Market, By Product, 2019-2030 (USD Billion)
14. North America Gluten-free Baking Mixes Market, By Distribution Channel, 2019-2030 (USD Billion)
15. U.S. Gluten-free Baking Mixes Market, By Product, 2019-2030 (USD Billion)
16. U.S. Gluten-free Baking Mixes Market, By Distribution Channel, 2019-2030 (USD Billion)
17. Canada Gluten-free Baking Mixes Market, By Product, 2019-2030 (USD Billion)
18. Canada Gluten-free Baking Mixes Market, By Distribution Channel, 2019-2030 (USD Billion)
19. Mexico Gluten-free Baking Mixes Market, By Product, 2019-2030 (USD Billion)
20. Mexico Gluten-free Baking Mixes Market, By Distribution Channel, 2019-2030 (USD Billion)
21. Europe Gluten-free Baking Mixes Market, By Product, 2019-2030 (USD Billion)
22. Europe Gluten-free Baking Mixes Market, By Distribution Channel, 2019-2030 (USD Billion)
23. Germany Gluten-free Baking Mixes Market, By Product, 2019-2030 (USD Billion)
24. Germany Gluten-free Baking Mixes Market, By Distribution Channel, 2019-2030 (USD Billion)
25. France Gluten-free Baking Mixes Market, By Product, 2019-2030 (USD Billion)
26. France Gluten-free Baking Mixes Market, By Distribution Channel, 2019-2030 (USD Billion)
27. U.K. Gluten-free Baking Mixes Market, By Product, 2019-2030 (USD Billion)
28. U.K. Gluten-free Baking Mixes Market, By Distribution Channel, 2019-2030 (USD Billion)
29. Italy Gluten-free Baking Mixes Market, By Product, 2019-2030 (USD Billion)
30. Italy Gluten-free Baking Mixes Market, By Distribution Channel, 2019-2030 (USD Billion)
31. Spain Gluten-free Baking Mixes Market, By Product, 2019-2030 (USD Billion)
32. Spain Gluten-free Baking Mixes Market, By Distribution Channel, 2019-2030 (USD Billion)
33. Asia Pacific Gluten-free Baking Mixes Market, By Product, 2019-2030 (USD Billion)
34. Asia Pacific Gluten-free Baking Mixes Market, By Distribution Channel, 2019-2030 (USD Billion)
35. Japan Gluten-free Baking Mixes Market, By Product, 2019-2030 (USD Billion)
36. Japan Gluten-free Baking Mixes Market, By Distribution Channel, 2019-2030 (USD Billion)
37. China Gluten-free Baking Mixes Market, By Product, 2019-2030 (USD Billion)
38. China Gluten-free Baking Mixes Market, By Distribution Channel, 2019-2030 (USD Billion)
39. India Gluten-free Baking Mixes Market, By Product, 2019-2030 (USD Billion)
40. India Gluten-free Baking Mixes Market, By Distribution Channel, 2019-2030 (USD Billion)
41. South America Gluten-free Baking Mixes Market, By Product, 2019-2030 (USD Billion)
42. South America Gluten-free Baking Mixes Market, By Distribution Channel, 2019-2030 (USD Billion)
43. Brazil Gluten-free Baking Mixes Market, By Product, 2019-2030 (USD Billion)
44. Brazil Gluten-free Baking Mixes Market, By Distribution Channel, 2019-2030 (USD Billion)
45. Middle East and Africa Gluten-free Baking Mixes Market, By Product, 2019-2030 (USD Billion)
46. Middle East and Africa Gluten-free Baking Mixes Market, By Distribution Channel, 2019-2030 (USD Billion)
47. UAE Gluten-free Baking Mixes Market, By Product, 2019-2030 (USD Billion)
48. UAE Gluten-free Baking Mixes Market, By Distribution Channel, 2019-2030 (USD Billion)
49. South Africa Gluten-free Baking Mixes Market, By Product, 2019-2030 (USD Billion)
50. South Africa Gluten-free Baking Mixes Market, By Distribution Channel, 2019-2030 (USD Billion)
List of Figures
1. Global Gluten-free Baking Mixes Market Segmentation
2. Gluten-free Baking Mixes Market: Research Methodology
3. Market Size Estimation Methodology: Bottom-Up Approach
4. Market Size Estimation Methodology: Top-Down Approach
5. Data Triangulation
6. Porter’s Five Forces Analysis
7. Value Chain Analysis
8. Global Gluten-free Baking Mixes Market Attractiveness Analysis by Product
9. Global Gluten-free Baking Mixes Market Attractiveness Analysis by Distribution Channel
10. Global Gluten-free Baking Mixes Market Attractiveness Analysis by Region
11. Global Gluten-free Baking Mixes Market: Dynamics
12. Global Gluten-free Baking Mixes Market Share by Product (2022 & 2030)
13. Global Gluten-free Baking Mixes Market Share by Distribution Channel (2022 & 2030)
14. Global Gluten-free Baking Mixes Market Share by Regions (2022 & 2030)
15. Global Gluten-free Baking Mixes Market Share by Company (2021)
Segments Covered in the Report
Research has its special purpose to undertake marketing efficiently. In this competitive scenario, businesses need information across all industry verticals; the information about customer wants, market demand, competition, industry trends, distribution channels etc. This information needs to be updated regularly because businesses operate in a dynamic environment. Our organization, The Brainy Insights incorporates scientific and systematic research procedures in order to get proper market insights and industry analysis for overall business success. The analysis consists of studying the market from a miniscule level wherein we implement statistical tools which helps us in examining the data with accuracy and precision.
Our research reports feature both; quantitative and qualitative aspects for any market. Qualitative information for any market research process are fundamental because they reveal the customer needs and wants, usage and consumption for any product/service related to a specific industry. This in turn aids the marketers/investors in knowing certain perceptions of the customers. Qualitative research can enlighten about the different product concepts and designs along with unique service offering that in turn, helps define marketing problems and generate opportunities. On the other hand, quantitative research engages with the data collection process through interviews, e-mail interactions, surveys and pilot studies. Quantitative aspects for the market research are useful to validate the hypotheses generated during qualitative research method, explore empirical patterns in the data with the help of statistical tools, and finally make the market estimations.
The Brainy Insights offers comprehensive research and analysis, based on a wide assortment of factual insights gained through interviews with CXOs and global experts and secondary data from reliable sources. Our analysts and industry specialist assume vital roles in building up statistical tools and analysis models, which are used to analyse the data and arrive at accurate insights with exceedingly informative research discoveries. The data provided by our organization have proven precious to a diverse range of companies, facilitating them to address issues such as determining which products/services are the most appealing, whether or not customers use the product in the manner anticipated, the purchasing intentions of the market and many others.
Our research methodology encompasses an idyllic combination of primary and secondary initiatives. Key phases involved in this process are listed below:

The phase involves the gathering and collecting of market data and its related information with the help of different sources & research procedures.

The data procurement stage involves in data gathering and collecting through various data sources.
This stage involves in extensive research. These data sources includes:
Purchased Database: Purchased databases play a crucial role in estimating the market sizes irrespective of the domain. Our purchased database includes:
Primary Research: The Brainy Insights interacts with leading companies and experts of the concerned domain to develop the analyst team’s market understanding and expertise. It improves and substantiates every single data presented in the market reports. Primary research mainly involves in telephonic interviews, E-mail interactions and face-to-face interviews with the raw material providers, manufacturers/producers, distributors, & independent consultants. The interviews that we conduct provides valuable data on market size and industry growth trends prevailing in the market. Our organization also conducts surveys with the various industry experts in order to gain overall insights of the industry/market. For instance, in healthcare industry we conduct surveys with the pharmacists, doctors, surgeons and nurses in order to gain insights and key information of a medical product/device/equipment which the customers are going to usage. Surveys are conducted in the form of questionnaire designed by our own analyst team. Surveys plays an important role in primary research because surveys helps us to identify the key target audiences of the market. Additionally, surveys helps to identify the key target audience engaged with the market. Our survey team conducts the survey by targeting the key audience, thus gaining insights from them. Based on the perspectives of the customers, this information is utilized to formulate market strategies. Moreover, market surveys helps us to understand the current competitive situation of the industry. To be precise, our survey process typically involve with the 360 analysis of the market. This analytical process begins by identifying the prospective customers for a product or service related to the market/industry to obtain data on how a product/service could fit into customers’ lives.

Secondary Research: The secondary data sources includes information published by the on-profit organizations such as World bank, WHO, company fillings, investor presentations, annual reports, national government documents, statistical databases, blogs, articles, white papers and others. From the annual report, we analyse a company’s revenue to understand the key segment and market share of that organization in a particular region. We analyse the company websites and adopt the product mapping technique which is important for deriving the segment revenue. In the product mapping method, we select and categorize the products offered by the companies catering to domain specific market, deduce the product revenue for each of the companies so as to get overall estimation of the market size. We also source data and analyses trends based on information received from supply side and demand side intermediaries in the value chain. The supply side denotes the data gathered from supplier, distributor, wholesaler and the demand side illustrates the data gathered from the end customers for respective market domain.

The supply side for a domain specific market is analysed by:
The demand side for the market is estimated through:
In-house Library: Apart from these third-party sources, we have our in-house library of qualitative and quantitative information. Our in-house database includes market data for various industry and domains. These data are updated on regular basis as per the changing market scenario. Our library includes, historic databases, internal audit reports and archives.
Sometimes there are instances where there is no metadata or raw data available for any domain specific market. For those cases, we use our expertise to forecast and estimate the market size in order to generate comprehensive data sets. Our analyst team adopt a robust research technique in order to produce the estimates:
Data Synthesis: This stage involves the analysis & mapping of all the information obtained from the previous step. It also involves in scrutinizing the data for any discrepancy observed while data gathering related to the market. The data is collected with consideration to the heterogeneity of sources. Robust scientific techniques are in place for synthesizing disparate data sets and provide the essential contextual information that can orient market strategies. The Brainy Insights has extensive experience in data synthesis where the data passes through various stages:


Market Deduction & Formulation: The final stage comprises of assigning data points at appropriate market spaces so as to deduce feasible conclusions. Analyst perspective & subject matter expert based holistic form of market sizing coupled with industry analysis also plays a crucial role in this stage.
This stage involves in finalization of the market size and numbers that we have collected from data integration step. With data interpolation, it is made sure that there is no gap in the market data. Successful trend analysis is done by our analysts using extrapolation techniques, which provide the best possible forecasts for the market.
Data Validation & Market Feedback: Validation is the most important step in the process. Validation & re-validation via an intricately designed process helps us finalize data-points to be used for final calculations.

The Brainy Insights interacts with leading companies and experts of the concerned domain to develop the analyst team’s market understanding and expertise. It improves and substantiates every single data presented in the market reports. The data validation interview and discussion panels are typically composed of the most experienced industry members. The participants include, however, are not limited to:
Moreover, we always validate our data and findings through primary respondents from all the major regions we are working on.


Free Customization
Fortune 500 Clients
Free Yearly Update On Purchase Of Multi/Corporate License
Companies Served Till Date