- +1-315-215-1633
- sales@thebrainyinsights.com

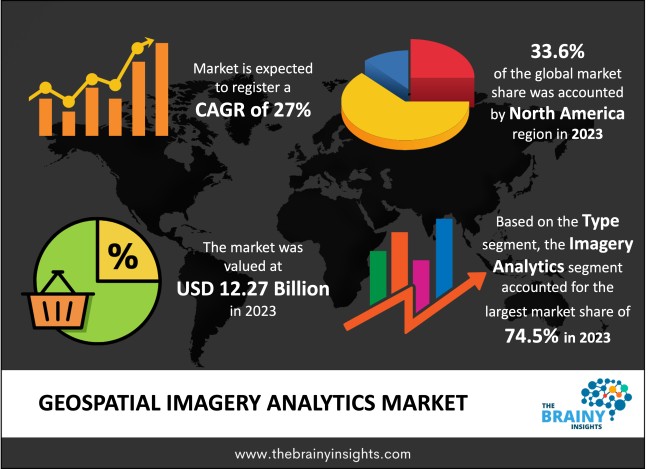
Global geospatial imagery analytics market is expected to reach USD 133.91 billion by 2033, at a CAGR of 27% from 2024 to 2033. The use of big data and artificial intelligence (Al) to develop geospatial imagery analytics solutions, as well as severe competition among market competitors, are driving the geospatial imaging analytics market. Furthermore, increased income and advances in analytics technology are two aspects that will propel the geospatial imaging analytics market forward. The growing demand for real-time monitoring will also drive the growth of the Geospatial Imagery Analytics market. The logistics and defense industries will benefit the most from real-time monitoring. At the same time, governments can use real-time monitoring to plan the development of smart cities well.
Geospatial analytics collects, manipulates, and displays data and imagery from geographic information systems (GIS), such as GPS and satellite pictures. Geographic coordinates and unique identifiers such as street address and zip code are used in geospatial data analytics. They're utilized to make geographic models and data visualizations for more precise trend forecasting and modelling. Geospatial analysts separate relevant from irrelevant information and use it to create and visualize the order that lies beneath the apparent disorder of geographically sorted data. As a result, they can give precise trend analysis, modelling, and predictions. Geospatial analytics is used to add timing and location to traditional data types and to create data visualizations. Maps, graphs, statistics, and cartograms are examples of visualizations that depict historical and current trends. This extra information provides a more detailed picture of the events. Easy-to-recognize visual patterns and images show insights that could otherwise be overlooked in a large spreadsheet. Predictions can be made more quickly, easily, and accurately because of this. Climate change modelling, human population forecasts, weather monitoring, and animal population management are all topics that geospatial imaging analytics may help with. It is a method of using statistical analysis and other types of data analytics in a geographical or spatial context. This information is gathered through satellite imagery, GPS, geotagging, mapping, and a variety of other methods with the goal of generating useful data for important business and organizational decision-making. Such an investigation would use software that could map spatial data, apply analytical procedures to terrestrial or geographical data sets, and so on. Geospatial Imagery Analytics makes decisions such as land use and resource management easy for organizations and governments. It can also reduce the risk of disasters. For example, preparations can be made in advance in areas where an earthquake or flood is possible.
Get an overview of this study by requesting a free sample
The growing need for GIS services by organizations to identify client preferences and enhance sales in the targeted demography is driving the geospatial imagery analytics market. Businesses are turning to geospatial analytics to help them make more informed decisions. Government officials are concentrating on enhancing disaster management by analysing satellite data and using Geographic Information Systems (GIS) to minimize the consequences of natural disasters such as earthquakes, floods, and tsunamis. For national security reasons, the authorities are actively investing in satellite technologies to acquire high-resolution geospatial videos and images to reduce cross-border terrorist activity.
New issues have emerged in the market as the use of geospatial imagery analytics has grown. Operational issues and high costs, the need for interoperable platforms and open standards, legal issues surrounding the use of spatial data, and difficulties integrating enterprise resource management (ERM) and Geographic Information System (GIS) are all restraining the Geospatial Imagery Analytics market.
The global geospatial imagery analytics market is driven by governments throughout the world adopting geospatial analytic solutions in security and defense. Furthermore, many governments and corporate organizations are providing attractive funding packages to encourage many enterprises to enter or excel in the geospatial imagery analytics field.
The geospatial imagery analytics sector is hampered by government regulations and legal limits regarding geospatial data. In addition, the incorporation of geospatial analytics data into enterprise solutions may pose a significant barrier to the market's growth rate throughout the forecast period.
The global geospatial imagery analytics market has been segmented based on type, collection medium, deployment mode, application, and regions.
The regions analyzed for the market include North America, Europe, South America, Asia Pacific, and the Middle East and Africa. North America region emerged as the largest market for the global geospatial imagery analytics market with a 33.6% share of the market revenue in 2023.
North America region Geospatial Imagery Analytics Market Share in 2023 - 33.6%
www.thebrainyinsights.com
Check the geographical analysis of this market by requesting a free sample
The key players are now concentrating on implementing strategies such as adopting new technology, product innovations, mergers & acquisitions, joint venture, alliances, and partnerships to improve their market position in the global geospatial imagery analytics industry.
Hexagon released the Luciad 2020 in March 2020 to deliver quicker and more powerful 3D visualisation and analysis capabilities, and LuciadCPillar to add enhanced geographic visualisation and analysis to their applications.
As per The Brainy Insights, the size of the geospatial imagery analytics market was valued at USD 12.27 Billion in 2023 to USD 133.91 Billion by 2033.
Global geospatial imagery analytics market is growing at a CAGR of 27% during the forecast period 2024-2033.
North America region emerged as the largest market for the geospatial imagery analytics.
The market's growth will be influenced by increasing demand for GIS services by businesses.
Operational issues could hamper the market growth.
Governments are increasingly using geospatial analytic solutions in security and defence , thus offering opportunities to the market.
Key players include Alteryx, Esri, Geocento, Geospin, GeoSpoc, Google, Harris Corporation, Hexagon, Mapidea, Maxar Technologies, Microsoft, Oracle, Orbital Insight, Planet Labs, RMSI, Sparkgeo, TomTom, Trimble, UrtheCast and ZillionInfo.
1. Introduction
1.1. Objectives of the Study
1.2. Market Definition
1.3. Research Scope
1.4. Currency
1.5. Key Target Audience
2. Research Methodology and Assumptions
3. Executive Summary
4. Premium Insights
4.1. Porter’s Five Forces Analysis
4.2. Value Chain Analysis
4.3. Top Investment Pockets
4.3.1. Market Attractiveness Analysis By Type
4.3.2. Market Attractiveness Analysis By Collection Medium
4.3.3. Market Attractiveness Analysis By Deployment Mode
4.3.4. Market Attractiveness Analysis By Application
4.3.5. Market Attractiveness Analysis By Region
4.4. Industry Trends
5. Market Dynamics
5.1. Market Evaluation
5.2. Drivers
5.2.1. Increasing demand for GIS services by businesses
5.3. Restraints
5.3.1. Operational issues
5.4. Opportunities
5.4.1. Governments are increasingly using geospatial analytic solutions in security and defence
5.5. Challenges
5.5.1. Stringent government regulations
6. Global Geospatial Imagery Analytics Market Analysis and Forecast, By Type
6.1. Segment Overview
6.2. Video Analytics
6.3. Imagery Analytics
7. Global Geospatial Imagery Analytics Market Analysis and Forecast, By Collection Medium
7.1. Segment Overview
7.2. Satellites
7.3. Geographic Information System
7.4. Unmanned Aerial Vehicles
7.5. Others
8. Global Geospatial Imagery Analytics Market Analysis and Forecast, By Deployment Mode
8.1. Segment Overview
8.2. Cloud
8.3. On-Premises
9. Global Geospatial Imagery Analytics Market Analysis and Forecast, By Application
9.1. Segment Overview
9.2. Construction and Development
9.3. Surveillance and Monitoring
9.4. Energy and Resource Management
9.5. Disaster Management
9.6. Conservation and Research
9.7. Exhibition and Live Entertainment
9.8. Other Applications
10. Global Geospatial Imagery Analytics Market Analysis and Forecast, By Regional Analysis
10.1. Segment Overview
10.2. North America
10.2.1. U.S.
10.2.2. Canada
10.2.3. Mexico
10.3. Europe
10.3.1. Germany
10.3.2. France
10.3.3. U.K.
10.3.4. Italy
10.3.5. Spain
10.4. Asia-Pacific
10.4.1. Japan
10.4.2. China
10.4.3. India
10.5. South America
10.5.1. Brazil
10.6. Middle East and Africa
10.6.1. UAE
10.6.2. South Africa
11. Global Geospatial Imagery Analytics Market-Competitive Landscape
11.1. Overview
11.2. Market Share of Key Players in the Geospatial Imagery Analytics Market
11.2.1. Global Company Market Share
11.2.2. North America Company Market Share
11.2.3. Europe Company Market Share
11.2.4. APAC Company Market Share
11.3. Competitive Situations and Trends
11.3.1. Product Launches and Developments
11.3.2. Partnerships, Collaborations, and Agreements
11.3.3. Mergers & Acquisitions
11.3.4. Expansions
12. Company Profiles
12.1. Alteryx
12.1.1. Business Overview
12.1.2. Company Snapshot
12.1.3. Company Market Share Analysis
12.1.4. Company Component Portfolio
12.1.5. Recent Developments
12.1.6. SWOT Analysis
12.2. Esri
12.2.1. Business Overview
12.2.2. Company Snapshot
12.2.3. Company Market Share Analysis
12.2.4. Company Component Portfolio
12.2.5. Recent Developments
12.2.6. SWOT Analysis
12.3. Geocento
12.3.1. Business Overview
12.3.2. Company Snapshot
12.3.3. Company Market Share Analysis
12.3.4. Company Component Portfolio
12.3.5. Recent Developments
12.3.6. SWOT Analysis
12.4. Geospin
12.4.1. Business Overview
12.4.2. Company Snapshot
12.4.3. Company Market Share Analysis
12.4.4. Company Component Portfolio
12.4.5. Recent Developments
12.4.6. SWOT Analysis
12.5. GeoSpoc
12.5.1. Business Overview
12.5.2. Company Snapshot
12.5.3. Company Market Share Analysis
12.5.4. Company Component Portfolio
12.5.5. Recent Developments
12.5.6. SWOT Analysis
12.6. Google
12.6.1. Business Overview
12.6.2. Company Snapshot
12.6.3. Company Market Share Analysis
12.6.4. Company Component Portfolio
12.6.5. Recent Developments
12.6.6. SWOT Analysis
12.7. Harris Corporation
12.7.1. Business Overview
12.7.2. Company Snapshot
12.7.3. Company Market Share Analysis
12.7.4. Company Component Portfolio
12.7.5. Recent Developments
12.7.6. SWOT Analysis
12.8. Hexagon
12.8.1. Business Overview
12.8.2. Company Snapshot
12.8.3. Company Market Share Analysis
12.8.4. Company Component Portfolio
12.8.5. Recent Developments
12.8.6. SWOT Analysis
12.9. Mapidea
12.9.1. Business Overview
12.9.2. Company Snapshot
12.9.3. Company Market Share Analysis
12.9.4. Company Component Portfolio
12.9.5. Recent Developments
12.9.6. SWOT Analysis
12.10. Maxar Technologies
12.10.1. Business Overview
12.10.2. Company Snapshot
12.10.3. Company Market Share Analysis
12.10.4. Company Component Portfolio
12.10.5. Recent Developments
12.10.6. SWOT Analysis
12.11. Microsoft
12.11.1. Business Overview
12.11.2. Company Snapshot
12.11.3. Company Market Share Analysis
12.11.4. Company Component Portfolio
12.11.5. Recent Developments
12.11.6. SWOT Analysis
12.12. Oracle
12.12.1. Business Overview
12.12.2. Company Snapshot
12.12.3. Company Market Share Analysis
12.12.4. Company Component Portfolio
12.12.5. Recent Developments
12.12.6. SWOT Analysis
12.13. Orbital Insight
12.13.1. Business Overview
12.13.2. Company Snapshot
12.13.3. Company Market Share Analysis
12.13.4. Company Component Portfolio
12.13.5. Recent Developments
12.13.6. SWOT Analysis
12.14. Planet Labs
12.14.1. Business Overview
12.14.2. Company Snapshot
12.14.3. Company Market Share Analysis
12.14.4. Company Component Portfolio
12.14.5. Recent Developments
12.14.6. SWOT Analysis
12.15. RMSI
12.15.1. Business Overview
12.15.2. Company Snapshot
12.15.3. Company Market Share Analysis
12.15.4. Company Component Portfolio
12.15.5. Recent Developments
12.15.6. SWOT Analysis
12.16. Sparkgeo
12.16.1. Business Overview
12.16.2. Company Snapshot
12.16.3. Company Market Share Analysis
12.16.4. Company Component Portfolio
12.16.5. Recent Developments
12.16.6. SWOT Analysis
12.17. TomTom
12.17.1. Business Overview
12.17.2. Company Snapshot
12.17.3. Company Market Share Analysis
12.17.4. Company Component Portfolio
12.17.5. Recent Developments
12.17.6. SWOT Analysis
12.18. Trimble
12.18.1. Business Overview
12.18.2. Company Snapshot
12.18.3. Company Market Share Analysis
12.18.4. Company Component Portfolio
12.18.5. Recent Developments
12.18.6. SWOT Analysis
12.19. UrtheCast
12.19.1. Business Overview
12.19.2. Company Snapshot
12.19.3. Company Market Share Analysis
12.19.4. Company Component Portfolio
12.19.5. Recent Developments
12.19.6. SWOT Analysis
12.20. ZillionInfo
12.20.1. Business Overview
12.20.2. Company Snapshot
12.20.3. Company Market Share Analysis
12.20.4. Company Component Portfolio
12.20.5. Recent Developments
12.20.6. SWOT Analysis
List of Table
1. Global Geospatial Imagery Analytics Market, By Type, 2020-2033 (USD Billion)
2. Global Video Analytics Geospatial Imagery Analytics Market, By Region, 2020-2033 (USD Billion)
3. Global Imagery Analytics Geospatial Imagery Analytics Market, By Region, 2020-2033 (USD Billion)
4. Global Geospatial Imagery Analytics Market, By Collection Medium, 2020-2033 (USD Billion)
5. Global Satellites Geospatial Imagery Analytics Market, By Region, 2020-2033 (USD Billion)
6. Global Geographic Information System Geospatial Imagery Analytics Market, By Region, 2020-2033 (USD Billion)
7. Global Unmanned Aerial Vehicles Geospatial Imagery Analytics Market, By Region, 2020-2033 (USD Billion)
8. Global Others Food Geospatial Imagery Analytics Market, By Region, 2020-2033 (USD Billion)
9. Global Geospatial Imagery Analytics Market, By Deployment Mode, 2020-2033 (USD Billion)
10. Global Cloud Geospatial Imagery Analytics Market, By Region, 2020-2033 (USD Billion)
11. Global On-Premises Geospatial Imagery Analytics Market, By Region, 2020-2033 (USD Billion)
12. Global Geospatial Imagery Analytics Market, By Application, 2020-2033 (USD Billion)
13. Global Construction and Development Geospatial Imagery Analytics Market, By Region, 2020-2033 (USD Billion)
14. Global Surveillance and Monitoring Geospatial Imagery Analytics Market, By Region, 2020-2033 (USD Billion)
15. Global Energy and Resource Management Geospatial Imagery Analytics Market, By Region, 2020-2033 (USD Billion)
16. Global Disaster Management Geospatial Imagery Analytics Market, By Region, 2020-2033 (USD Billion)
17. Global Conservation and Research Geospatial Imagery Analytics Market, By Region, 2020-2033 (USD Billion)
18. Global Exhibition and Live Entertainment Geospatial Imagery Analytics Market, By Region, 2020-2033 (USD Billion)
19. Global Other Applications Geospatial Imagery Analytics Market, By Region, 2020-2033 (USD Billion)
20. Global Geospatial Imagery Analytics Market, By Region, 2020-2033 (USD Billion)
21. North America Geospatial Imagery Analytics Market, By Type, 2020-2033 (USD Billion)
22. North America Geospatial Imagery Analytics Market, By Collection Medium, 2020-2033 (USD Billion)
23. North America Geospatial Imagery Analytics Market, By Deployment Mode, 2020-2033 (USD Billion)
24. North America Geospatial Imagery Analytics Market, By Application, 2020-2033 (USD Billion)
25. U.S. Geospatial Imagery Analytics Market, By Type, 2020-2033 (USD Billion)
26. U.S. Geospatial Imagery Analytics Market, By Collection Medium, 2020-2033 (USD Billion)
27. U.S. Geospatial Imagery Analytics Market, By Deployment Mode, 2020-2033 (USD Billion)
28. U.S. Geospatial Imagery Analytics Market, By Application, 2020-2033 (USD Billion)
29. Canada Geospatial Imagery Analytics Market, By Type, 2020-2033 (USD Billion)
30. Canada Geospatial Imagery Analytics Market, By Collection Medium, 2020-2033 (USD Billion)
31. Canada Geospatial Imagery Analytics Market, By Deployment Mode, 2020-2033 (USD Billion)
32. Canada Geospatial Imagery Analytics Market, By Application, 2020-2033 (USD Billion)
33. Mexico Geospatial Imagery Analytics Market, By Type, 2020-2033 (USD Billion)
34. Mexico Geospatial Imagery Analytics Market, By Collection Medium, 2020-2033 (USD Billion)
35. Mexico Geospatial Imagery Analytics Market, By Deployment Mode, 2020-2033 (USD Billion)
36. Mexico Geospatial Imagery Analytics Market, By Application, 2020-2033 (USD Billion)
37. Europe Geospatial Imagery Analytics Market, By Type, 2020-2033 (USD Billion)
38. Europe Geospatial Imagery Analytics Market, By Collection Medium, 2020-2033 (USD Billion)
39. Europe Geospatial Imagery Analytics Market, By Deployment Mode, 2020-2033 (USD Billion)
40. Europe Geospatial Imagery Analytics Market, By Application, 2020-2033 (USD Billion)
41. Germany Geospatial Imagery Analytics Market, By Type, 2020-2033 (USD Billion)
42. Germany Geospatial Imagery Analytics Market, By Collection Medium, 2020-2033 (USD Billion)
43. Germany Geospatial Imagery Analytics Market, By Deployment Mode, 2020-2033 (USD Billion)
44. Germany Geospatial Imagery Analytics Market, By Application, 2020-2033 (USD Billion)
45. France Geospatial Imagery Analytics Market, By Type, 2020-2033 (USD Billion)
46. France Geospatial Imagery Analytics Market, By Collection Medium, 2020-2033 (USD Billion)
47. France Geospatial Imagery Analytics Market, By Deployment Mode, 2020-2033 (USD Billion)
48. France Geospatial Imagery Analytics Market, By Application, 2020-2033 (USD Billion)
49. U.K. Geospatial Imagery Analytics Market, By Type, 2020-2033 (USD Billion)
50. U.K. Geospatial Imagery Analytics Market, By Collection Medium, 2020-2033 (USD Billion)
51. U.K. Geospatial Imagery Analytics Market, By Deployment Mode, 2020-2033 (USD Billion)
52. U.K. Geospatial Imagery Analytics Market, By Application, 2020-2033 (USD Billion)
53. Italy Geospatial Imagery Analytics Market, By Type, 2020-2033 (USD Billion)
54. Italy Geospatial Imagery Analytics Market, By Collection Medium, 2020-2033 (USD Billion)
55. Italy Geospatial Imagery Analytics Market, By Deployment Mode, 2020-2033 (USD Billion)
56. Italy Geospatial Imagery Analytics Market, By Application, 2020-2033 (USD Billion)
57. Spain Geospatial Imagery Analytics Market, By Type, 2020-2033 (USD Billion)
58. Spain Geospatial Imagery Analytics Market, By Collection Medium, 2020-2033 (USD Billion)
59. Spain Geospatial Imagery Analytics Market, By Deployment Mode, 2020-2033 (USD Billion)
60. Spain Geospatial Imagery Analytics Market, By Application, 2020-2033 (USD Billion)
61. Asia Pacific Geospatial Imagery Analytics Market, By Type, 2020-2033 (USD Billion)
62. Asia Pacific Geospatial Imagery Analytics Market, By Collection Medium, 2020-2033 (USD Billion)
63. Asia Pacific Geospatial Imagery Analytics Market, By Deployment Mode, 2020-2033 (USD Billion)
64. Asia Pacific Geospatial Imagery Analytics Market, By Application, 2020-2033 (USD Billion)
65. Japan Geospatial Imagery Analytics Market, By Type, 2020-2033 (USD Billion)
66. Japan Geospatial Imagery Analytics Market, By Collection Medium, 2020-2033 (USD Billion)
67. Japan Geospatial Imagery Analytics Market, By Deployment Mode, 2020-2033 (USD Billion)
68. Japan Geospatial Imagery Analytics Market, By Application, 2020-2033 (USD Billion)
69. China Geospatial Imagery Analytics Market, By Type, 2020-2033 (USD Billion)
70. China Geospatial Imagery Analytics Market, By Collection Medium, 2020-2033 (USD Billion)
71. China Geospatial Imagery Analytics Market, By Deployment Mode, 2020-2033 (USD Billion)
72. China Geospatial Imagery Analytics Market, By Application, 2020-2033 (USD Billion)
73. India Geospatial Imagery Analytics Market, By Type, 2020-2033 (USD Billion)
74. India Geospatial Imagery Analytics Market, By Collection Medium, 2020-2033 (USD Billion)
75. India Geospatial Imagery Analytics Market, By Deployment Mode, 2020-2033 (USD Billion)
76. India Geospatial Imagery Analytics Market, By Application, 2020-2033 (USD Billion)
77. South America Geospatial Imagery Analytics Market, By Type, 2020-2033 (USD Billion)
78. South America Geospatial Imagery Analytics Market, By Collection Medium, 2020-2033 (USD Billion)
79. South America Geospatial Imagery Analytics Market, By Deployment Mode, 2020-2033 (USD Billion)
80. South America Geospatial Imagery Analytics Market, By Application, 2020-2033 (USD Billion)
81. Brazil Geospatial Imagery Analytics Market, By Type, 2020-2033 (USD Billion)
82. Brazil Geospatial Imagery Analytics Market, By Collection Medium, 2020-2033 (USD Billion)
83. Brazil Geospatial Imagery Analytics Market, By Deployment Mode, 2020-2033 (USD Billion)
84. Brazil Geospatial Imagery Analytics Market, By Application, 2020-2033 (USD Billion)
85. Middle East and Africa Geospatial Imagery Analytics Market, By Type, 2020-2033 (USD Billion)
86. Middle East and Africa Geospatial Imagery Analytics Market, By Collection Medium, 2020-2033 (USD Billion)
87. Middle East and Africa Geospatial Imagery Analytics Market, By Deployment Mode, 2020-2033 (USD Billion)
88. Middle East and Africa Geospatial Imagery Analytics Market, By Application, 2020-2033 (USD Billion)
89. UAE Geospatial Imagery Analytics Market, By Type, 2020-2033 (USD Billion)
90. UAE Geospatial Imagery Analytics Market, By Collection Medium, 2020-2033 (USD Billion)
91. UAE Geospatial Imagery Analytics Market, By Deployment Mode, 2020-2033 (USD Billion)
92. UAE Geospatial Imagery Analytics Market, By Application, 2020-2033 (USD Billion)
93. South Africa Geospatial Imagery Analytics Market, By Type, 2020-2033 (USD Billion)
94. South Africa Geospatial Imagery Analytics Market, By Collection Medium, 2020-2033 (USD Billion)
95. South Africa Geospatial Imagery Analytics Market, By Deployment Mode, 2020-2033 (USD Billion)
96. South Africa Geospatial Imagery Analytics Market, By Application, 2020-2033 (USD Billion)
List of Figures
1. Global Geospatial Imagery Analytics Market Segmentation
2. Geospatial Imagery Analytics Market: Research Methodology
3. Market Size Estimation Methodology: Bottom-Up Approach
4. Market Size Estimation Methodology: Top-Down Approach
5. Data Triangulation
6. Porter’s Five Forces Analysis
7. Value Chain Analysis
8. Global Geospatial Imagery Analytics Market Attractiveness Analysis By Type
9. Global Geospatial Imagery Analytics Market Attractiveness Analysis By Collection Medium
10. Global Geospatial Imagery Analytics Market Attractiveness Analysis By Deployment Mode
11. Global Geospatial Imagery Analytics Market Attractiveness Analysis By Application
12. Global Geospatial Imagery Analytics Market Attractiveness Analysis By Region
13. Global Geospatial Imagery Analytics Market: Dynamics
14. Global Geospatial Imagery Analytics Market Share by Type (2023 & 2033)
15. Global Geospatial Imagery Analytics Market Share by Collection Medium (2023 & 2033)
16. Global Geospatial Imagery Analytics Market Share by Deployment Mode (2023 & 2033)
17. Global Geospatial Imagery Analytics Market Share by Application (2023 & 2033)
18. Global Geospatial Imagery Analytics Market Share by Regions (2023 & 2033)
19. Global Geospatial Imagery Analytics Market Share by Company (2023)
This study forecasts revenue at global, regional, and country levels from 2020 to 2033. The Brainy Insights has segmented the global Geospatial Imagery Analytics market based on below mentioned segments:
Global Geospatial Imagery Analytics Market by Type:
Global Geospatial Imagery Analytics Market by Collection Medium:
Global Geospatial Imagery Analytics Market by Deployment Mode:
Global Geospatial Imagery Analytics Market by Application:
Global Geospatial Imagery Analytics Market by Region:
Research has its special purpose to undertake marketing efficiently. In this competitive scenario, businesses need information across all industry verticals; the information about customer wants, market demand, competition, industry trends, distribution channels etc. This information needs to be updated regularly because businesses operate in a dynamic environment. Our organization, The Brainy Insights incorporates scientific and systematic research procedures in order to get proper market insights and industry analysis for overall business success. The analysis consists of studying the market from a miniscule level wherein we implement statistical tools which helps us in examining the data with accuracy and precision.
Our research reports feature both; quantitative and qualitative aspects for any market. Qualitative information for any market research process are fundamental because they reveal the customer needs and wants, usage and consumption for any product/service related to a specific industry. This in turn aids the marketers/investors in knowing certain perceptions of the customers. Qualitative research can enlighten about the different product concepts and designs along with unique service offering that in turn, helps define marketing problems and generate opportunities. On the other hand, quantitative research engages with the data collection process through interviews, e-mail interactions, surveys and pilot studies. Quantitative aspects for the market research are useful to validate the hypotheses generated during qualitative research method, explore empirical patterns in the data with the help of statistical tools, and finally make the market estimations.
The Brainy Insights offers comprehensive research and analysis, based on a wide assortment of factual insights gained through interviews with CXOs and global experts and secondary data from reliable sources. Our analysts and industry specialist assume vital roles in building up statistical tools and analysis models, which are used to analyse the data and arrive at accurate insights with exceedingly informative research discoveries. The data provided by our organization have proven precious to a diverse range of companies, facilitating them to address issues such as determining which products/services are the most appealing, whether or not customers use the product in the manner anticipated, the purchasing intentions of the market and many others.
Our research methodology encompasses an idyllic combination of primary and secondary initiatives. Key phases involved in this process are listed below:

The phase involves the gathering and collecting of market data and its related information with the help of different sources & research procedures.

The data procurement stage involves in data gathering and collecting through various data sources.
This stage involves in extensive research. These data sources includes:
Purchased Database: Purchased databases play a crucial role in estimating the market sizes irrespective of the domain. Our purchased database includes:
Primary Research: The Brainy Insights interacts with leading companies and experts of the concerned domain to develop the analyst team’s market understanding and expertise. It improves and substantiates every single data presented in the market reports. Primary research mainly involves in telephonic interviews, E-mail interactions and face-to-face interviews with the raw material providers, manufacturers/producers, distributors, & independent consultants. The interviews that we conduct provides valuable data on market size and industry growth trends prevailing in the market. Our organization also conducts surveys with the various industry experts in order to gain overall insights of the industry/market. For instance, in healthcare industry we conduct surveys with the pharmacists, doctors, surgeons and nurses in order to gain insights and key information of a medical product/device/equipment which the customers are going to usage. Surveys are conducted in the form of questionnaire designed by our own analyst team. Surveys plays an important role in primary research because surveys helps us to identify the key target audiences of the market. Additionally, surveys helps to identify the key target audience engaged with the market. Our survey team conducts the survey by targeting the key audience, thus gaining insights from them. Based on the perspectives of the customers, this information is utilized to formulate market strategies. Moreover, market surveys helps us to understand the current competitive situation of the industry. To be precise, our survey process typically involve with the 360 analysis of the market. This analytical process begins by identifying the prospective customers for a product or service related to the market/industry to obtain data on how a product/service could fit into customers’ lives.

Secondary Research: The secondary data sources includes information published by the on-profit organizations such as World bank, WHO, company fillings, investor presentations, annual reports, national government documents, statistical databases, blogs, articles, white papers and others. From the annual report, we analyse a company’s revenue to understand the key segment and market share of that organization in a particular region. We analyse the company websites and adopt the product mapping technique which is important for deriving the segment revenue. In the product mapping method, we select and categorize the products offered by the companies catering to domain specific market, deduce the product revenue for each of the companies so as to get overall estimation of the market size. We also source data and analyses trends based on information received from supply side and demand side intermediaries in the value chain. The supply side denotes the data gathered from supplier, distributor, wholesaler and the demand side illustrates the data gathered from the end customers for respective market domain.

The supply side for a domain specific market is analysed by:
The demand side for the market is estimated through:
In-house Library: Apart from these third-party sources, we have our in-house library of qualitative and quantitative information. Our in-house database includes market data for various industry and domains. These data are updated on regular basis as per the changing market scenario. Our library includes, historic databases, internal audit reports and archives.
Sometimes there are instances where there is no metadata or raw data available for any domain specific market. For those cases, we use our expertise to forecast and estimate the market size in order to generate comprehensive data sets. Our analyst team adopt a robust research technique in order to produce the estimates:
Data Synthesis: This stage involves the analysis & mapping of all the information obtained from the previous step. It also involves in scrutinizing the data for any discrepancy observed while data gathering related to the market. The data is collected with consideration to the heterogeneity of sources. Robust scientific techniques are in place for synthesizing disparate data sets and provide the essential contextual information that can orient market strategies. The Brainy Insights has extensive experience in data synthesis where the data passes through various stages:


Market Deduction & Formulation: The final stage comprises of assigning data points at appropriate market spaces so as to deduce feasible conclusions. Analyst perspective & subject matter expert based holistic form of market sizing coupled with industry analysis also plays a crucial role in this stage.
This stage involves in finalization of the market size and numbers that we have collected from data integration step. With data interpolation, it is made sure that there is no gap in the market data. Successful trend analysis is done by our analysts using extrapolation techniques, which provide the best possible forecasts for the market.
Data Validation & Market Feedback: Validation is the most important step in the process. Validation & re-validation via an intricately designed process helps us finalize data-points to be used for final calculations.

The Brainy Insights interacts with leading companies and experts of the concerned domain to develop the analyst team’s market understanding and expertise. It improves and substantiates every single data presented in the market reports. The data validation interview and discussion panels are typically composed of the most experienced industry members. The participants include, however, are not limited to:
Moreover, we always validate our data and findings through primary respondents from all the major regions we are working on.


Free Customization
Fortune 500 Clients
Free Yearly Update On Purchase Of Multi/Corporate License
Companies Served Till Date