- +1-315-215-1633
- sales@thebrainyinsights.com

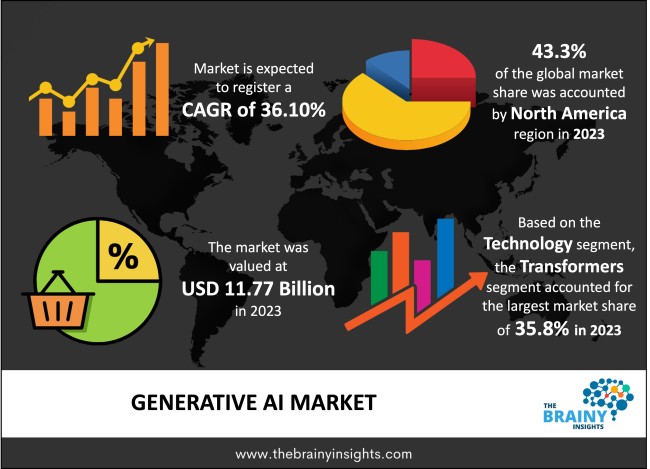
The global Generative AI market is expected to grow from USD 11.77 billion in 2023 to USD 256.72 billion by 2033, at a CAGR of 36.10% during the forecast period 2024-2033. The North American region dominated the market in 2023. Utilizing unsupervised learning algorithms, generative AI enhances spam detection and optimizes image compression by pre-processing data stages, which include eliminating visual noise to enhance picture quality. Additionally, supervised learning is a useful tool for medical imaging and categorizing images. This technology's applications can be found in BFSI, healthcare, automotive & transportation, IT & telecommunications, and media & entertainment industries. Impressively versatile in its uses, generative AI presents an ingenious solution for innovation creation and problem-solving with limitless potential.
Generative AI deploys machine learning techniques to create content like images, text, video, and audio. This technology helps the customer is deceiving the user into thinking that the content is accurate. The technology known as generative AI allows the clients to produce new audio, text, or visual output using the existing data set. With generative AI, hardware can identify the underlying pattern in the input and generate comparable material. Generative AI helps to create digital avatars for people, which can be used in content creation, interviews, etc. In simulation and the real world, generative modeling enables the reinforcement of ML models to be less biased and comprehend more abstract notions. Early detection of loopholes is made possible by generative AI, leading to the development of successful cures. A constrained set of parameters are provided to generative AI software to use during the training phase.
Get an overview of this study by requesting a free sample
Increasing use of machine learning across business verticals: Machine learning and its subsets can be applied to various issues, jobs, and applications. Computer vision, for example, allows computers to see and understand images and movies. Businesses use machine learning across industries in their goods and internal operations. For example, machine learning can help to simplify, streamline, and improve supply chain operations. Business analytics, security, sales, and marketing are just a few applications. Many end-users generally look up to various data sources that may be mined for insights. Thus, many of these companies have a particular need for machine learning. Many sensors and wearable gadgets have been introduced in the healthcare business, which help analyze a patient's health in real time. Thus, generative AI is also required in the healthcare business. Marketing agencies use generative AI to implement marketing campaigns, personalize shopping experiences, inventory supply planning, price optimization, and consumer insights.
High capital investment– A considerable investment is required to install generative AI operations in large corporate offices. In addition to this, regularly scheduled updates and preventive maintenance are necessary for such software, which leads to the additional cost being added to the overall cost that the company is spending. Therefore, substantial initial investment and maintenance cost is one of the critical factors that may hinder the market's growth over the forecast period.
Rising adoption of data-centric production approach- Data-centric design has many benefits for industrial undertakings. Executing a large capital project is a challenging and time-consuming process with a large amount of data set that has to be arranged to deliver quality reports. In the media and entertainment sector, where many operators work with a specialized system integrator, data-centric execution architecture has been around for a while and is becoming more popular. The following phases—feasibility, idea and design foundation, detailed engineering, front-end engineering design, building, and start-up—are the only ones that are changed by adopting a data-centric architecture. The advantages of generative AI in data-centric are numerous, such as cleaned and arranged data sets, interactive dashboards, and better advertisement and marketing campaigns. Therefore, many data-centric productions necessitate generative AI because it improves the efficiency of almost any business operation.
Lack of skilled professionals - The availability of qualified professionals determines the potential use of generative artificial intelligence. Due to the lack of availability of experienced professionals, the market growth is restrained. The different features of generative AI could only be used with the skill of experienced professionals. Thus, lacking skilled professionals limits the ROI on productive AI implementation.
The regions analyzed for the market include North America, Europe, South America, Asia Pacific, the Middle East, and Africa. The North American region emerged as the most significant global generative AI market, with a revenue share of 43.3% in 2023. The region has a high market growth rate due to the presence of established end-user industries. The North American market will be driven by investment in the artificial intelligence and machine learning sector to support the generative AI market. The presence of tech players in the U.S. and Canada is providing lucrative growth opportunities for the market in the region. The Asia-Pacific region is anticipated to grow lucratively during the forecast period. The market is witnessing a lucrative growth rate due to the growth of end-user industries in countries like Japan and China. Further, the increasing investment in artificial intelligence will propel market growth.
North America Region Generative AI Market Share in 2023 - 43.3%
www.thebrainyinsights.com
Check the geographical analysis of this market by requesting a free sample
The technology segment is divided into transformers, diffusion networks, generative adversarial networks, and variational auto-encoders. The transformers segment dominated the market with a revenue share of 35.8% in 2023. Transformers are used for text-to-image applications and are thus used in most end-user industries. The transformers convert the text data in the image, which helps in advertising.
The component segment includes service and software. The software segment dominated the market with a revenue share of 65.2% in 2023. Software is responsible for efficiently working with generative AI and equipping the hardware with IoT and artificial intelligence. Several software advancements have been made in recent years, enhancing generative AI's capabilities.
The vertical segment includes BFSI, media and entertainment, healthcare, IT and telecommunication, automotive and transportation, and others. The media and entertainment segment dominated the market with a revenue share of 31.3% in 2023. Media and entertainment use generative AI for the creation of advertisement campaigns and to attract clients on different social media platforms. Adopting technology in the media and entertainment is providing lucrative growth opportunities to the generative AI market.
| Attribute | Description |
|---|---|
| Market Size | Revenue (USD Billion) |
| Market size value in 2023 | USD 11.77 Billion |
| Market size value in 2033 | USD 256.72 Billion |
| CAGR (2024 to 2033) | 36.10% |
| Historical data | 2020-2022 |
| Base Year | 2023 |
| Forecast | 2024-2033 |
| Region | The regions examined for the market are Europe, Asia Pacific, North America, South America, and Middle East & Africa. |
| Segments | The research segment is based on technology, component, and verticals. |
As per The Brainy Insights, the size of the generative AI market was valued USD 11.77 billion in 2023 to USD 256.72 billion by 2033.
Global generative AI market is growing at a CAGR of 36.10% during the forecast period 2024-2033.
North America region emerged as the largest market for the generative AI.
The market's growth will be influenced by the growing use of generative AI in different applications.
The high cost of installation could hamper the market growth.
The increasing investment in artificial intelligence is providing huge opportunities to the market.
Key players are Synthesia, Genie AI Ltd, MOSTLY AI Inc., IBM, Amazon Web Services, Inc., Google LLC, Adobe, Microsoft, D-ID, Rephrase.ai among others.
1. Introduction
1.1. Objectives of the Study
1.2. Market Definition
1.3. Research Scope
1.4. Currency
1.5. Key Target Audience
2. Research Methodology and Assumptions
3. Executive Summary
4. Premium Insights
4.1. Porter’s Five Forces Analysis
4.2. Value Chain Analysis
4.3. Top Investment Pockets
4.3.1. Market Attractiveness Analysis By Technology
4.3.2. Market Attractiveness Analysis By Component
4.3.3. Market Attractiveness Analysis By Vertical
4.3.4. Market Attractiveness Analysis By Region
4.4. Industry Trends
5. Market Dynamics
5.1. Market Evaluation
5.2. Drivers
5.2.1. Increasing use of generative AI in advertising and marketing applications
5.3. Restraints
5.3.1. High capital cost
5.4. Opportunities
5.4.1. Increasing investment by end-user industries
5.5. Challenges
5.5.1. Less awareness in developing countries
6. Global Generative AI Market Analysis and Forecast, By Technology
6.1. Segment Overview
6.2. Transformers
6.3. Diffusion Networks
6.4. Generative Adversarial Networks
6.5. Variational Auto-encoders
7. Global Generative AI Market Analysis and Forecast, By Component
7.1. Segment Overview
7.2. Service
7.3. Software
8. Global Generative AI Market Analysis and Forecast, By Vertical
8.1. Segment Overview
8.2. BFSI
8.3. Media and Entertainment
8.4. Healthcare
8.5. IT and Telecommunication
8.6. Automotive and Transportation
8.7. Others
9. Global Generative AI Market Analysis and Forecast, By Regional Analysis
9.1. Segment Overview
9.2. North America
9.2.1. U.S.
9.2.2. Canada
9.2.3. Mexico
9.3. Europe
9.3.1. Germany
9.3.2. France
9.3.3. U.K.
9.3.4. Italy
9.3.5. Spain
9.4. Asia-Pacific
9.4.1. Japan
9.4.2. China
9.4.3. India
9.5. South America
9.5.1. Brazil
9.6. Middle East and Africa
9.6.1. UAE
9.6.2. South Africa
10. Global Generative AI Market-Competitive Landscape
10.1. Overview
10.2. Market Share of Key Players in the Generative AI Market
10.2.1. Global Company Market Share
10.2.2. North America Company Market Share
10.2.3. Europe Company Market Share
10.2.4. APAC Company Market Share
10.3. Competitive Situations and Trends
10.3.1. Product Launches and Developments
10.3.2. Partnerships, Collaborations, and Agreements
10.3.3. Mergers & Acquisitions
10.3.4. Expansions
11. Company Profiles
11.1. Synthesia
11.1.1. Business Overview
11.1.2. Company Snapshot
11.1.3. Company Market Share Analysis
11.1.4. Company Product Portfolio
11.1.5. Recent Developments
11.1.6. SWOT Analysis
11.2. Genie AI Ltd.
11.2.1. Business Overview
11.2.2. Company Snapshot
11.2.3. Company Market Share Analysis
11.2.4. Company Product Portfolio
11.2.5. Recent Developments
11.2.6. SWOT Analysis
11.3. MOSTLY AI Inc.
11.3.1. Business Overview
11.3.2. Company Snapshot
11.3.3. Company Market Share Analysis
11.3.4. Company Product Portfolio
11.3.5. Recent Developments
11.3.6. SWOT Analysis
11.4. IBM
11.4.1. Business Overview
11.4.2. Company Snapshot
11.4.3. Company Market Share Analysis
11.4.4. Company Product Portfolio
11.4.5. Recent Developments
11.4.6. SWOT Analysis
11.5. Amazon Web Services, Inc.
11.5.1. Business Overview
11.5.2. Company Snapshot
11.5.3. Company Market Share Analysis
11.5.4. Company Product Portfolio
11.5.5. Recent Developments
11.5.6. SWOT Analysis
11.6. Google LLC
11.6.1. Business Overview
11.6.2. Company Snapshot
11.6.3. Company Market Share Analysis
11.6.4. Company Product Portfolio
11.6.5. Recent Developments
11.6.6. SWOT Analysis
11.7. Adobe
11.7.1. Business Overview
11.7.2. Company Snapshot
11.7.3. Company Market Share Analysis
11.7.4. Company Product Portfolio
11.7.5. Recent Developments
11.7.6. SWOT Analysis
11.8. Microsoft
1.1.1. Business Overview
1.1.2. Company Snapshot
1.1.3. Company Market Share Analysis
1.1.4. Company Product Portfolio
1.1.5. Recent Developments
1.1.6. SWOT Analysis
11.9. D-ID
11.9.1. Business Overview
11.9.2. Company Snapshot
11.9.3. Company Market Share Analysis
11.9.4. Company Product Portfolio
11.9.5. Recent Developments
11.9.6. SWOT Analysis
11.10. Rephrase.ai
11.10.1. Business Overview
11.10.2. Company Snapshot
11.10.3. Company Market Share Analysis
11.10.4. Company Product Portfolio
11.10.5. Recent Developments
11.10.6. SWOT Analysis
List of Table
1. Global Generative AI Market, By Technology, 2020-2033 (USD Billion)
2. Global Transformers, Generative AI Market, By Region, 2020-2033 (USD Billion)
3. Global Diffusion Networks, Generative AI Market, By Region, 2020-2033 (USD Billion)
4. Global Generative Adversarial Networks, Generative AI Market, By Region, 2020-2033 (USD Billion)
5. Global Variational Auto-encoders, Generative AI Market, By Region, 2020-2033 (USD Billion)
6. Global Generative AI Market, By Component, 2020-2033 (USD Billion)
7. Global Service, Generative AI Market, By Region, 2020-2033 (USD Billion)
8. Global Software, Generative AI Market, By Region, 2020-2033 (USD Billion)
9. Global Generative AI Market, By Vertical, 2020-2033 (USD Billion)
10. Global BFSI, Generative AI Market, By Region, 2020-2033 (USD Billion)
11. Global Media and Entertainment, Generative AI Market, By Region, 2020-2033 (USD Billion)
12. Global Healthcare, Generative AI Market, By Region, 2020-2033 (USD Billion)
13. Global IT and Telecommunication, Generative AI Market, By Region, 2020-2033 (USD Billion)
14. Global Automotive and Transportation, Generative AI Market, By Region, 2020-2033 (USD Billion)
15. Global Others, Generative AI Market, By Region, 2020-2033 (USD Billion)
16. Global Generative AI Market, By Region, 2020-2033 (USD Billion)
17. North America Generative AI Market, By Technology, 2020-2033 (USD Billion)
18. North America Generative AI Market, By Component, 2020-2033 (USD Billion)
19. North America Generative AI Market, By Vertical, 2020-2033 (USD Billion)
20. U.S. Generative AI Market, By Technology, 2020-2033 (USD Billion)
21. U.S. Generative AI Market, By Component, 2020-2033 (USD Billion)
22. U.S. Generative AI Market, By Vertical, 2020-2033 (USD Billion)
23. Canada Generative AI Market, By Technology, 2020-2033 (USD Billion)
24. Canada Generative AI Market, By Component, 2020-2033 (USD Billion)
25. Canada Generative AI Market, By Vertical, 2020-2033 (USD Billion)
26. Mexico Generative AI Market, By Technology, 2020-2033 (USD Billion)
27. Mexico Generative AI Market, By Component, 2020-2033 (USD Billion)
28. Mexico Generative AI Market, By Vertical, 2020-2033 (USD Billion)
29. Europe Generative AI Market, By Technology, 2020-2033 (USD Billion)
30. Europe Generative AI Market, By Component, 2020-2033 (USD Billion)
31. Europe Generative AI Market, By Vertical, 2020-2033 (USD Billion)
32. Germany Generative AI Market, By Technology, 2020-2033 (USD Billion)
33. Germany Generative AI Market, By Component, 2020-2033 (USD Billion)
34. Germany Generative AI Market, By Vertical, 2020-2033 (USD Billion)
35. France Generative AI Market, By Technology, 2020-2033 (USD Billion)
36. France Generative AI Market, By Component, 2020-2033 (USD Billion)
37. France Generative AI Market, By Vertical, 2020-2033 (USD Billion)
38. U.K. Generative AI Market, By Technology, 2020-2033 (USD Billion)
39. U.K. Generative AI Market, By Component, 2020-2033 (USD Billion)
40. U.K. Generative AI Market, By Vertical, 2020-2033 (USD Billion)
41. Italy Generative AI Market, By Technology, 2020-2033 (USD Billion)
42. Italy Generative AI Market, By Component, 2020-2033 (USD Billion)
43. Italy Generative AI Market, By Vertical, 2020-2033 (USD Billion)
44. Spain Generative AI Market, By Technology, 2020-2033 (USD Billion)
45. Spain Generative AI Market, By Component, 2020-2033 (USD Billion)
46. Spain Generative AI Market, By Vertical, 2020-2033 (USD Billion)
47. Asia Pacific Generative AI Market, By Technology, 2020-2033 (USD Billion)
48. Asia Pacific Generative AI Market, By Component, 2020-2033 (USD Billion)
49. Asia Pacific Generative AI Market, By Vertical, 2020-2033 (USD Billion)
50. Japan Generative AI Market, By Technology, 2020-2033 (USD Billion)
51. Japan Generative AI Market, By Component 2020-2033 (USD Billion)
52. Japan Generative AI Market, By Vertical, 2020-2033 (USD Billion)
53. China Generative AI Market, By Technology, 2020-2033 (USD Billion)
54. China Generative AI Market, By Component, 2020-2033 (USD Billion)
55. China Generative AI Market, By Vertical, 2020-2033 (USD Billion)
56. India Generative AI Market, By Technology, 2020-2033 (USD Billion)
57. India Generative AI Market, By Component, 2020-2033 (USD Billion)
58. India Generative AI Market, By Vertical, 2020-2033 (USD Billion)
59. South America Generative AI Market, By Technology, 2020-2033 (USD Billion)
60. South America Generative AI Market, By Component, 2020-2033 (USD Billion)
61. South America Generative AI Market, By Vertical, 2020-2033 (USD Billion)
62. Brazil Generative AI Market, By Technology, 2020-2033 (USD Billion)
63. Brazil Generative AI Market, By Component, 2020-2033 (USD Billion)
64. Brazil Generative AI Market, By Vertical, 2020-2033 (USD Billion)
65. Middle East and Africa Generative AI Market, By Technology, 2020-2033 (USD Billion)
66. Middle East and Africa Generative AI Market, By Component, 2020-2033 (USD Billion)
67. Middle East and Africa Generative AI Market, By Vertical, 2020-2033 (USD Billion)
68. UAE Generative AI Market, By Technology, 2020-2033 (USD Billion)
69. UAE Generative AI Market, By Component, 2020-2033 (USD Billion)
70. UAE Generative AI Market, By Vertical, 2020-2033 (USD Billion)
71. South Africa Generative AI Market, By Technology, 2020-2033 (USD Billion)
72. South Africa Generative AI Market, By Component, 2020-2033 (USD Billion)
73. South Africa Generative AI Market, By Vertical, 2020-2033 (USD Billion)
List of Figures
1. Global Generative AI Market Segmentation
2. Generative AI Market: Research Methodology
3. Market Size Estimation Methodology: Bottom-Up Approach
4. Market Size Estimation Methodology: Top-Down Approach
5. Data Triangulation
6. Porter’s Five Forces Analysis
7. Value Chain Analysis
8. Global Generative AI Market Attractiveness Analysis By Technology
9. Global Generative AI Market Attractiveness Analysis By Component
10. Global Generative AI Market Attractiveness Analysis By Vertical
11. Global Generative AI Market Attractiveness Analysis By Region
12. Global Generative AI Market: Dynamics
13. Global Generative AI Market Share by Technology (2023 & 2033)
14. Global Generative AI Market Share by Component (2023 & 2033)
15. Global Generative AI Market Share by Vertical (2023 & 2033)
16. Global Generative AI Market Share by Regions (2023 & 2033)
17. Global Generative AI Market Share by Company (2023)
This study forecasts revenue at global, regional, and country levels from 2020 to 2033. The Brainy Insights has segmented the global generative AI market based on below mentioned segments:
Global Generative AI Market by Technology:
Global Generative AI Market by Component:
Global Generative AI Market by Vertical:
Global Generative AI Market by Region:
Research has its special purpose to undertake marketing efficiently. In this competitive scenario, businesses need information across all industry verticals; the information about customer wants, market demand, competition, industry trends, distribution channels etc. This information needs to be updated regularly because businesses operate in a dynamic environment. Our organization, The Brainy Insights incorporates scientific and systematic research procedures in order to get proper market insights and industry analysis for overall business success. The analysis consists of studying the market from a miniscule level wherein we implement statistical tools which helps us in examining the data with accuracy and precision.
Our research reports feature both; quantitative and qualitative aspects for any market. Qualitative information for any market research process are fundamental because they reveal the customer needs and wants, usage and consumption for any product/service related to a specific industry. This in turn aids the marketers/investors in knowing certain perceptions of the customers. Qualitative research can enlighten about the different product concepts and designs along with unique service offering that in turn, helps define marketing problems and generate opportunities. On the other hand, quantitative research engages with the data collection process through interviews, e-mail interactions, surveys and pilot studies. Quantitative aspects for the market research are useful to validate the hypotheses generated during qualitative research method, explore empirical patterns in the data with the help of statistical tools, and finally make the market estimations.
The Brainy Insights offers comprehensive research and analysis, based on a wide assortment of factual insights gained through interviews with CXOs and global experts and secondary data from reliable sources. Our analysts and industry specialist assume vital roles in building up statistical tools and analysis models, which are used to analyse the data and arrive at accurate insights with exceedingly informative research discoveries. The data provided by our organization have proven precious to a diverse range of companies, facilitating them to address issues such as determining which products/services are the most appealing, whether or not customers use the product in the manner anticipated, the purchasing intentions of the market and many others.
Our research methodology encompasses an idyllic combination of primary and secondary initiatives. Key phases involved in this process are listed below:

The phase involves the gathering and collecting of market data and its related information with the help of different sources & research procedures.

The data procurement stage involves in data gathering and collecting through various data sources.
This stage involves in extensive research. These data sources includes:
Purchased Database: Purchased databases play a crucial role in estimating the market sizes irrespective of the domain. Our purchased database includes:
Primary Research: The Brainy Insights interacts with leading companies and experts of the concerned domain to develop the analyst team’s market understanding and expertise. It improves and substantiates every single data presented in the market reports. Primary research mainly involves in telephonic interviews, E-mail interactions and face-to-face interviews with the raw material providers, manufacturers/producers, distributors, & independent consultants. The interviews that we conduct provides valuable data on market size and industry growth trends prevailing in the market. Our organization also conducts surveys with the various industry experts in order to gain overall insights of the industry/market. For instance, in healthcare industry we conduct surveys with the pharmacists, doctors, surgeons and nurses in order to gain insights and key information of a medical product/device/equipment which the customers are going to usage. Surveys are conducted in the form of questionnaire designed by our own analyst team. Surveys plays an important role in primary research because surveys helps us to identify the key target audiences of the market. Additionally, surveys helps to identify the key target audience engaged with the market. Our survey team conducts the survey by targeting the key audience, thus gaining insights from them. Based on the perspectives of the customers, this information is utilized to formulate market strategies. Moreover, market surveys helps us to understand the current competitive situation of the industry. To be precise, our survey process typically involve with the 360 analysis of the market. This analytical process begins by identifying the prospective customers for a product or service related to the market/industry to obtain data on how a product/service could fit into customers’ lives.

Secondary Research: The secondary data sources includes information published by the on-profit organizations such as World bank, WHO, company fillings, investor presentations, annual reports, national government documents, statistical databases, blogs, articles, white papers and others. From the annual report, we analyse a company’s revenue to understand the key segment and market share of that organization in a particular region. We analyse the company websites and adopt the product mapping technique which is important for deriving the segment revenue. In the product mapping method, we select and categorize the products offered by the companies catering to domain specific market, deduce the product revenue for each of the companies so as to get overall estimation of the market size. We also source data and analyses trends based on information received from supply side and demand side intermediaries in the value chain. The supply side denotes the data gathered from supplier, distributor, wholesaler and the demand side illustrates the data gathered from the end customers for respective market domain.

The supply side for a domain specific market is analysed by:
The demand side for the market is estimated through:
In-house Library: Apart from these third-party sources, we have our in-house library of qualitative and quantitative information. Our in-house database includes market data for various industry and domains. These data are updated on regular basis as per the changing market scenario. Our library includes, historic databases, internal audit reports and archives.
Sometimes there are instances where there is no metadata or raw data available for any domain specific market. For those cases, we use our expertise to forecast and estimate the market size in order to generate comprehensive data sets. Our analyst team adopt a robust research technique in order to produce the estimates:
Data Synthesis: This stage involves the analysis & mapping of all the information obtained from the previous step. It also involves in scrutinizing the data for any discrepancy observed while data gathering related to the market. The data is collected with consideration to the heterogeneity of sources. Robust scientific techniques are in place for synthesizing disparate data sets and provide the essential contextual information that can orient market strategies. The Brainy Insights has extensive experience in data synthesis where the data passes through various stages:


Market Deduction & Formulation: The final stage comprises of assigning data points at appropriate market spaces so as to deduce feasible conclusions. Analyst perspective & subject matter expert based holistic form of market sizing coupled with industry analysis also plays a crucial role in this stage.
This stage involves in finalization of the market size and numbers that we have collected from data integration step. With data interpolation, it is made sure that there is no gap in the market data. Successful trend analysis is done by our analysts using extrapolation techniques, which provide the best possible forecasts for the market.
Data Validation & Market Feedback: Validation is the most important step in the process. Validation & re-validation via an intricately designed process helps us finalize data-points to be used for final calculations.

The Brainy Insights interacts with leading companies and experts of the concerned domain to develop the analyst team’s market understanding and expertise. It improves and substantiates every single data presented in the market reports. The data validation interview and discussion panels are typically composed of the most experienced industry members. The participants include, however, are not limited to:
Moreover, we always validate our data and findings through primary respondents from all the major regions we are working on.


Free Customization
Fortune 500 Clients
Free Yearly Update On Purchase Of Multi/Corporate License
Companies Served Till Date