- +1-315-215-1633
- sales@thebrainyinsights.com

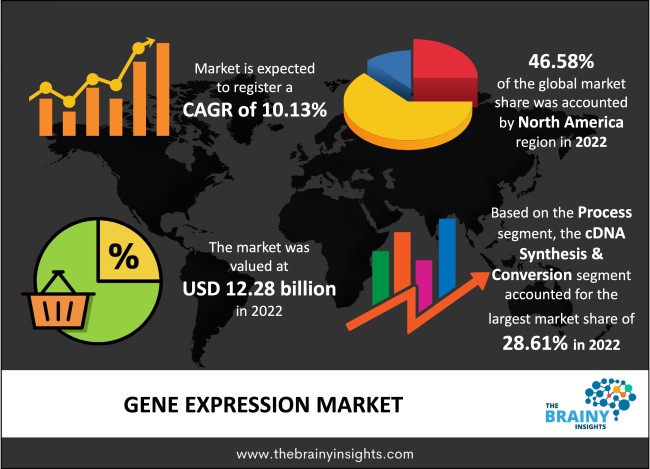
The global gene expression market was valued at USD 12.28 billion in 2022 and is anticipated to grow at a CAGR of 10.13% from 2023 to 2032. The market is expected to reach USD 32.23 billion by 2032. The expansion of genetic disorders, a rising focus on personalized medicine, and the growing utilization of gene expression in drug discovery are the key drivers behind the growth of the gene expression market. Moreover, the continuous advancement of cutting-edge solutions is expected to create substantial growth prospects throughout the forecast period.
Gene expression refers to the fundamental process by which genetic information encoded in DNA is used to create functional gene products, primarily proteins. It implicates the transcription of DNA into RNA, followed by the conversion of RNA into proteins. Gene expression is a highly regulated and complex mechanism crucial in determining an organism's traits, functions, and responses to various stimuli. It is a fundamental process in all living organisms and is vital for their growth, development, and overall biological functioning. Gene expression studies are conducted to understand how genes are activated or suppressed in different cellular contexts. These provide valuable insights into biological processes, disease mechanisms, and potential therapeutic targets in various fields, including medicine, biotechnology, and research.
Get an overview of this study by requesting a free sample
Increasing Prevalence of Genetic Disorders- The growing incidence of genetic diseases and disorders worldwide is one of the primary drivers of the gene expression market. Understanding gene expression patterns helps identify these disorders' root causes and develop targeted therapies for their treatment.
Advancements in Personalized Medicine- The growing awareness and adoption of personalized medicine approaches have significantly influenced the gene expression market. Gene expression profiling enables healthcare professionals to tailor treatments based on an individual's genetic makeup, improving treatment efficacy and patient outcomes.
High Costs- Gene expression analysis involves sophisticated technologies and equipment, which can be costly to get and maintain. The expenses of gene expression studies can be a significant barrier for smaller research institutions and healthcare facilities.
Data Complexity and Analysis- Gene expression data is vast and complex, requiring specialized expertise and computational resources for meaningful interpretation and analysis. The complexity of data analysis can be a challenge for researchers and clinicians, limiting the broader adoption of gene expression techniques.
Biomarker Discovery and Diagnostics- Gene expression analysis offers immense potential to identify biomarkers for early disease detection, classification, and treatment monitoring. The development of reliable biomarkers can revolutionize diagnostics and improve patient outcomes.
Agriculture and Biotechnology Applications- Gene expression analysis is becoming integral to improving crop yields, developing genetically modified organisms (GMOs), and enhancing biotechnological processes in agriculture and related industries.
Ethical and Regulatory Considerations- Gene expression studies often involve using human samples and sensitive genetic information. Ensuring data privacy, obtaining informed consent, and navigating complex ethical and regulatory frameworks can be challenging.
Reproducibility and Standardization- Ensuring consistent and reproducible results across different laboratories and platforms is essential for gene expression research. Variability in experimental protocols, reagents, and technologies can hinder data comparability.
The regions analyzed for the market include North America, Europe, South America, Asia Pacific, the Middle East, and Africa. North America emerged as the most prominent global Gene Expression market, with a 46.58% market revenue share in 2022.
North America, particularly the United States, has a well-established research and development infrastructure in genomics, biotechnology, and life sciences. It is home to many leading academic institutions, research organizations, and biotech companies actively engaging in gene expression research and technology development. Moreover, the region has been at the forefront of technological advancements in gene expression analysis. Many innovative technologies and tools for gene expression profiling have originated from research conducted in North America, leading to a competitive edge in the market. In addition, the gene expression market in North America benefits from significant funding and investments in research and development. Government agencies, private investors, and venture capital firms provide substantial financial support to genomics and biotechnology companies, fostering innovation and commercialization. The Asia Pacific region is anticipated to witness the fastest growth rate over the forecast period. The Asia Pacific region has been increasing its investments in research and development across various scientific fields, including genomics and biotechnology. Governments and private sectors are allocating more resources to advance gene expression research, technology development, and applications.
North America Region Gene Expression Market Share in 2022 - 46.58%
www.thebrainyinsights.com
Check the geographical analysis of this market by requesting a free sample
The process segment is classified into data analysis & interpretation, cDNA synthesis & conversion, purification, PCR analysis and sample collection. The cDNA synthesis & conversion segment dominated the market, with a share of around 28.61% in 2022. cDNA synthesis is a fundamental step in gene expression analysis, especially when studying mRNA levels. It involves the conversion of mRNA (complementary to the gene of interest) into cDNA using reverse transcription (RT) enzymes. cDNA serves as a stable and amplified template for downstream analysis. Additionally, cDNA synthesis enables high sensitivity and specificity in gene expression analysis. RT enzymes facilitate the conversion of minute amounts of mRNA into cDNA, making it suitable for analyzing low-abundance transcripts, essential for understanding gene regulation and disease mechanisms.
The technology segment includes DNA microarray, polymerase chain reaction (PCR), next-generation sequencing (NGS) and others. The polymerase chain reaction (PCR) segment accounted for the largest market share of around 41.82% in 2022. PCR offers high sensitivity and specificity, allowing researchers to accurately detect and quantify gene expression levels even in samples with low mRNA abundance. These factors make PCR suitable for various gene expression analysis applications. Additionally, qPCR, a variation of PCR, enables real-time monitoring and quantification of gene expression levels. It has become a gold standard method for accurate and precise quantification of gene expression and is widely used in research, diagnostics, and drug development.
The product segment is classified into DNA chip/microarray, kits & reagents, and others. The kits & reagents segment dominated the market, with a share of around 74.58% in 2022. Kits and reagents offer comprehensive and ready-to-use solutions for gene expression analysis. They typically contain all the necessary components, enzymes, buffers, and primers for the specific gene expression assay, simplifying the experimental workflow. Commercially available gene expression kits and reagents have standardized protocols and procedures, ensuring consistent and reproducible results across different experiments and laboratories.
The capacity segment is divided into high-plex and low to mid-plex. The high-plex segment held the highest market share of around 66.29% in 2022. High-Plex gene expression analysis enables the simultaneous measurement of the expression levels of 100 to 1,000 genes in a single experiment. These factors significantly increase the efficiency and throughput of gene expression profiling, allowing researchers to analyze multiple genes and samples simultaneously, saving time and resources. Besides, performing high-plex gene expression analysis reduces the per-gene cost compared to running individual assays for each gene of interest. It enables researchers to obtain comprehensive gene expression data at a more cost-effective price point, making it an attractive option for large-scale studies.
The application segment is classified into biotechnology & microbiology, clinical diagnostics, drug discovery & development, and others. The drug discovery & development segment dominated the market, with a share of around 45.83% in 2022. Gene expression analysis is instrumental in identifying and validating potential drug targets. Researchers can identify upregulated or downregulated genes in disease states by analyzing gene expression patterns in diseased and healthy tissues or cells, providing valuable insights into potential drug targets. Furthermore, gene expression profiling helps discover biomarkers indicating disease presence, progression, or treatment response. Biomarkers are crucial in patient stratification and clinical trial design, accelerating drug development.
The end user segment includes academic research centers, diagnostic laboratories, and pharmaceutical and biotechnology companies. The pharmaceutical and biotechnology companies segment accounted for the largest market share of around 51.43% in 2022. Pharmaceutical and biotechnology companies typically have substantial R&D budgets, enabling them to invest heavily in gene expression research, technology development, and commercialization. Drug discovery and development are core activities for pharmaceutical and biotechnology companies. Gene expression analysis is critical in identifying potential drug targets, assessing drug responses, and understanding drug mechanisms of action.
| Attribute | Description |
|---|---|
| Market Size | Revenue (USD Billion) |
| Market size value in 2022 | USD 12.28 Billion |
| Market size value in 2032 | USD 32.23 Billion |
| CAGR (2023 to 2032) | 10.13% |
| Historical data | 2019-2021 |
| Base Year | 2022 |
| Forecast | 2023-2032 |
| Region | The regions analyzed for the market are Asia Pacific, Europe, South America, North America, and Middle East & Africa. Furthermore, the regions are further analyzed at the country level. |
| Segments | Process, Technology, Product, Capacity, Application and End User |
As per The Brainy Insights, the size of the gene expression market was valued at USD 12.28 billion in 2022 to USD 32.23 billion by 2032.
The global gene expression market is growing at a CAGR of 10.13% during the forecast period 2023-2032.
The North American region became the largest market for gene expression.
Increasing prevalence of genetic disorders and advancements in personalized medicine influences the market's growth.
1. Introduction
1.1. Objectives of the Study
1.2. Market Definition
1.3. Research Scope
1.4. Currency
1.5. Key Target Audience
2. Research Methodology and Assumptions
3. Executive Summary
4. Premium Insights
4.1. Porter’s Five Forces Analysis
4.2. Value Chain Analysis
4.3. Top Investment Pockets
4.3.1. Market Attractiveness Analysis by Process
4.3.2. Market Attractiveness Analysis by Technology
4.3.3. Market Attractiveness Analysis by Product
4.3.4. Market Attractiveness Analysis by Capacity
4.3.5. Market Attractiveness Analysis by Application
4.3.6. Market Attractiveness Analysis by End User
4.3.7. Market Attractiveness Analysis by Region
4.4. Industry Trends
5. Market Dynamics
5.1. Market Evaluation
5.2. Drivers
5.2.1. Increasing Prevalence of Genetic Disorders
5.2.2. Advancements in Personalized Medicine
5.3. Restraints
5.3.1. High Costs
5.3.2. Data Complexity and Analysis
5.4. Opportunities
5.4.1. Biomarker Discovery and Diagnostics
5.4.2. Agriculture and Biotechnology Applications
5.5. Challenges
5.5.1. Ethical and Regulatory Considerations
5.5.2. Reproducibility and Standardization
6. Global Gene Expression Market Analysis and Forecast, By Process
6.1. Segment Overview
6.2. Data Analysis & Interpretation
6.3. cDNA Synthesis & Conversion
6.4. Purification
6.5. PCR Analysis
6.6. Sample Collection
7. Global Gene Expression Market Analysis and Forecast, By Technology
7.1. Segment Overview
7.2. DNA Microarray
7.3. Polymerase Chain Reaction (PCR)
7.4. Next-Generation Sequencing (NGS)
7.5. Others
8. Global Gene Expression Market Analysis and Forecast, By Product
8.1. Segment Overview
8.2. DNA Chip/Microarray
8.3. Kits & Reagents
8.4. Others
9. Global Gene Expression Market Analysis and Forecast, By Capacity
9.1. Segment Overview
9.2. High-Plex
9.3. Low to Mid-Plex
10. Global Gene Expression Market Analysis and Forecast, By Application
10.1. Segment Overview
10.2. Biotechnology & Microbiology
10.3. Clinical Diagnostics
10.4. Drug Discovery & Development
10.5. Others
11. Global Gene Expression Market Analysis and Forecast, By End User
11.1. Segment Overview
11.2. Academic Research Centers
11.3. Diagnostic Laboratories
11.4. Pharmaceutical and Biotechnology Companies
12. Global Gene Expression Market Analysis and Forecast, By Regional Analysis
12.1. Segment Overview
12.2. North America
12.2.1. U.S.
12.2.2. Canada
12.2.3. Mexico
12.3. Europe
12.3.1. Germany
12.3.2. France
12.3.3. U.K.
12.3.4. Italy
12.3.5. Spain
12.4. Asia-Pacific
12.4.1. Japan
12.4.2. China
12.4.3. India
12.5. South America
12.5.1. Brazil
12.6. Middle East and Africa
12.6.1. UAE
12.6.2. South Africa
13. Global Gene Expression Market-Competitive Landscape
13.1. Overview
13.2. Market Share of Key Players in the Gene Expression Market
13.2.1. Global Company Market Share
13.2.2. North America Company Market Share
13.2.3. Europe Company Market Share
13.2.4. APAC Company Market Share
13.3. Competitive Situations and Trends
13.3.1. Product Launches and Developments
13.3.2. Partnerships, Collaborations, and Agreements
13.3.3. Mergers & Acquisitions
13.3.4. Expansions
14. Company Profiles
14.1. Agilent Technologies
14.1.1. Business Overview
14.1.2. Company Snapshot
14.1.3. Company Market Share Analysis
14.1.4. Company Product Portfolio
14.1.5. Recent Developments
14.1.6. SWOT Analysis
14.2. AutoGenomics
14.2.1. Business Overview
14.2.2. Company Snapshot
14.2.3. Company Market Share Analysis
14.2.4. Company Product Portfolio
14.2.5. Recent Developments
14.2.6. SWOT Analysis
14.3. Bio-Rad Laboratories
14.3.1. Business Overview
14.3.2. Company Snapshot
14.3.3. Company Market Share Analysis
14.3.4. Company Product Portfolio
14.3.5. Recent Developments
14.3.6. SWOT Analysis
14.4. Biocartis NV
14.4.1. Business Overview
14.4.2. Company Snapshot
14.4.3. Company Market Share Analysis
14.4.4. Company Product Portfolio
14.4.5. Recent Developments
14.4.6. SWOT Analysis
14.5. Danaher Corp.
14.5.1. Business Overview
14.5.2. Company Snapshot
14.5.3. Company Market Share Analysis
14.5.4. Company Product Portfolio
14.5.5. Recent Developments
14.5.6. SWOT Analysis
14.6. ELITechGroup
14.6.1. Business Overview
14.6.2. Company Snapshot
14.6.3. Company Market Share Analysis
14.6.4. Company Product Portfolio
14.6.5. Recent Developments
14.6.6. SWOT Analysis
14.7. F. Hoffmann-La Roche Ltd.
14.7.1. Business Overview
14.7.2. Company Snapshot
14.7.3. Company Market Share Analysis
14.7.4. Company Product Portfolio
14.7.5. Recent Developments
14.7.6. SWOT Analysis
14.8. Fluidigm Corp.
14.8.1. Business Overview
14.8.2. Company Snapshot
14.8.3. Company Market Share Analysis
14.8.4. Company Product Portfolio
14.8.5. Recent Developments
14.8.6. SWOT Analysis
14.9. GE Healthcare
14.9.1. Business Overview
14.9.2. Company Snapshot
14.9.3. Company Market Share Analysis
14.9.4. Company Product Portfolio
14.9.5. Recent Developments
14.9.6. SWOT Analysis
14.10. IntegraGen
14.10.1. Business Overview
14.10.2. Company Snapshot
14.10.3. Company Market Share Analysis
14.10.4. Company Product Portfolio
14.10.5. Recent Developments
14.10.6. SWOT Analysis
14.11. Interpace Biosciences, Inc.
14.11.1. Business Overview
14.11.2. Company Snapshot
14.11.3. Company Market Share Analysis
14.11.4. Company Product Portfolio
14.11.5. Recent Developments
14.11.6. SWOT Analysis
14.12. Illumina, Inc.
14.12.1. Business Overview
14.12.2. Company Snapshot
14.12.3. Company Market Share Analysis
14.12.4. Company Product Portfolio
14.12.5. Recent Developments
14.12.6. SWOT Analysis
14.13. Luminex Corp.
14.13.1. Business Overview
14.13.2. Company Snapshot
14.13.3. Company Market Share Analysis
14.13.4. Company Product Portfolio
14.13.5. Recent Developments
14.13.6. SWOT Analysis
14.14. PerkinElmer, Inc.
14.14.1. Business Overview
14.14.2. Company Snapshot
14.14.3. Company Market Share Analysis
14.14.4. Company Product Portfolio
14.14.5. Recent Developments
14.14.6. SWOT Analysis
14.15. Promega Corp.
14.15.1. Business Overview
14.15.2. Company Snapshot
14.15.3. Company Market Share Analysis
14.15.4. Company Product Portfolio
14.15.5. Recent Developments
14.15.6. SWOT Analysis
14.16. QIAGEN
14.16.1. Business Overview
14.16.2. Company Snapshot
14.16.3. Company Market Share Analysis
14.16.4. Company Product Portfolio
14.16.5. Recent Developments
14.16.6. SWOT Analysis
14.17. Quest Diagnostics, Inc.
14.17.1. Business Overview
14.17.2. Company Snapshot
14.17.3. Company Market Share Analysis
14.17.4. Company Product Portfolio
14.17.5. Recent Developments
14.17.6. SWOT Analysis
14.18. Takara Bio, Inc.
14.18.1. Business Overview
14.18.2. Company Snapshot
14.18.3. Company Market Share Analysis
14.18.4. Company Product Portfolio
14.18.5. Recent Developments
14.18.6. SWOT Analysis
14.19. Thermo Fisher Scientific, Inc.
14.19.1. Business Overview
14.19.2. Company Snapshot
14.19.3. Company Market Share Analysis
14.19.4. Company Product Portfolio
14.19.5. Recent Developments
14.19.6. SWOT Analysis
List of Table
1. Global Gene Expression Market, By Process, 2019-2032 (USD Billion)
2. Global Data Analysis & Interpretation, Gene Expression Market, By Region, 2019-2032 (USD Billion)
3. Global cDNA Synthesis & Conversion, Gene Expression Market, By Region, 2019-2032 (USD Billion)
4. Global Purification Gene Expression Market, By Region, 2019-2032 (USD Billion)
5. Global PCR Analysis Gene Expression Market, By Region, 2019-2032 (USD Billion)
6. Global Sample Collection Gene Expression Market, By Region, 2019-2032 (USD Billion)
7. Global Gene Expression Market, By Technology, 2019-2032 (USD Billion)
8. Global DNA Microarray Gene Expression Market, By Region, 2019-2032 (USD Billion)
9. Global Polymerase Chain Reaction (PCR) Gene Expression Market, By Region, 2019-2032 (USD Billion)
10. Global Next-Generation Sequencing (NGS) Gene Expression Market, By Region, 2019-2032 (USD Billion)
11. Global Others Gene Expression Market, By Region, 2019-2032 (USD Billion)
12. Global Gene Expression Market, By Product, 2019-2032 (USD Billion)
13. Global DNA Chip/Microarray Gene Expression Market, By Region, 2019-2032 (USD Billion)
14. Global Kits & Reagents Gene Expression Market, By Region, 2019-2032 (USD Billion)
15. Global Others Gene Expression Market, By Region, 2019-2032 (USD Billion)
16. Global Gene Expression Market, By Capacity, 2019-2032 (USD Billion)
17. Global High-Plex Gene Expression Market, By Region, 2019-2032 (USD Billion)
18. Global Low to Mid-Plex Gene Expression Market, By Region, 2019-2032 (USD Billion)
19. Global Gene Expression Market, By Application, 2019-2032 (USD Billion)
20. Global Biotechnology & Microbiology Gene Expression Market, By Region, 2019-2032 (USD Billion)
21. Global Clinical Diagnostics Gene Expression Market, By Region, 2019-2032 (USD Billion)
22. Global Drug Discovery & Development Gene Expression Market, By Region, 2019-2032 (USD Billion)
23. Global Others Gene Expression Market, By Region, 2019-2032 (USD Billion)
24. Global Gene Expression Market, By End User, 2019-2032 (USD Billion)
25. Global Academic Research Centers Gene Expression Market, By Region, 2019-2032 (USD Billion)
26. Global Diagnostic Laboratories Gene Expression Market, By Region, 2019-2032 (USD Billion)
27. Global Pharmaceutical and Biotechnology Companies Gene Expression Market, By Region, 2019-2032 (USD Billion)
28. Global Gene Expression Market, By Region, 2019-2032 (USD Billion)
29. North America Gene Expression Market, By Process, 2019-2032 (USD Billion)
30. North America Gene Expression Market, By Technology, 2019-2032 (USD Billion)
31. North America Gene Expression Market, By Product, 2019-2032 (USD Billion)
32. North America Gene Expression Market, By Capacity, 2019-2032 (USD Billion)
33. North America Gene Expression Market, By Application, 2019-2032 (USD Billion)
34. North America Gene Expression Market, By End User, 2019-2032 (USD Billion)
35. U.S. Gene Expression Market, By Process, 2019-2032 (USD Billion)
36. U.S. Gene Expression Market, By Technology, 2019-2032 (USD Billion)
37. U.S. Gene Expression Market, By Product, 2019-2032 (USD Billion)
38. U.S. Gene Expression Market, By Capacity, 2019-2032 (USD Billion)
39. U.S. Gene Expression Market, By Application, 2019-2032 (USD Billion)
40. U.S. Gene Expression Market, By End User, 2019-2032 (USD Billion)
41. Canada Gene Expression Market, By Process, 2019-2032 (USD Billion)
42. Canada Gene Expression Market, By Technology, 2019-2032 (USD Billion)
43. Canada Gene Expression Market, By Product, 2019-2032 (USD Billion)
44. Canada Gene Expression Market, By Capacity, 2019-2032 (USD Billion)
45. Canada Gene Expression Market, By Application, 2019-2032 (USD Billion)
46. Canada Gene Expression Market, By End User, 2019-2032 (USD Billion)
47. Mexico Gene Expression Market, By Process, 2019-2032 (USD Billion)
48. Mexico Gene Expression Market, By Technology, 2019-2032 (USD Billion)
49. Mexico Gene Expression Market, By Product, 2019-2032 (USD Billion)
50. Mexico Gene Expression Market, By Capacity, 2019-2032 (USD Billion)
51. Mexico Gene Expression Market, By Application, 2019-2032 (USD Billion)
52. Mexico Gene Expression Market, By End User, 2019-2032 (USD Billion)
53. Europe Gene Expression Market, By Process, 2019-2032 (USD Billion)
54. Europe Gene Expression Market, By Technology, 2019-2032 (USD Billion)
55. Europe Gene Expression Market, By Product, 2019-2032 (USD Billion)
56. Europe Gene Expression Market, By Capacity, 2019-2032 (USD Billion)
57. Europe Gene Expression Market, By Application, 2019-2032 (USD Billion)
58. Europe Gene Expression Market, By End User, 2019-2032 (USD Billion)
59. Germany Gene Expression Market, By Process, 2019-2032 (USD Billion)
60. Germany Gene Expression Market, By Technology, 2019-2032 (USD Billion)
61. Germany Gene Expression Market, By Product, 2019-2032 (USD Billion)
62. Germany Gene Expression Market, By Capacity, 2019-2032 (USD Billion)
63. Germany Gene Expression Market, By Application, 2019-2032 (USD Billion)
64. Germany Gene Expression Market, By End User, 2019-2032 (USD Billion)
65. France Gene Expression Market, By Process, 2019-2032 (USD Billion)
66. France Gene Expression Market, By Technology, 2019-2032 (USD Billion)
67. France Gene Expression Market, By Product, 2019-2032 (USD Billion)
68. France Gene Expression Market, By Capacity, 2019-2032 (USD Billion)
69. France Gene Expression Market, By Application, 2019-2032 (USD Billion)
70. France Gene Expression Market, By End User, 2019-2032 (USD Billion)
71. U.K. Gene Expression Market, By Process, 2019-2032 (USD Billion)
72. U.K. Gene Expression Market, By Technology, 2019-2032 (USD Billion)
73. U.K. Gene Expression Market, By Product, 2019-2032 (USD Billion)
74. U.K. Gene Expression Market, By Capacity, 2019-2032 (USD Billion)
75. U.K. Gene Expression Market, By Application, 2019-2032 (USD Billion)
76. U.K. Gene Expression Market, By End User, 2019-2032 (USD Billion)
77. Italy Gene Expression Market, By Process, 2019-2032 (USD Billion)
78. Italy Gene Expression Market, By Technology, 2019-2032 (USD Billion)
79. Italy Gene Expression Market, By Product, 2019-2032 (USD Billion)
80. Italy Gene Expression Market, By Capacity, 2019-2032 (USD Billion)
81. Italy Gene Expression Market, By Application, 2019-2032 (USD Billion)
82. Italy Gene Expression Market, By End User, 2019-2032 (USD Billion)
83. Spain Gene Expression Market, By Process, 2019-2032 (USD Billion)
84. Spain Gene Expression Market, By Technology, 2019-2032 (USD Billion)
85. Spain Gene Expression Market, By Product, 2019-2032 (USD Billion)
86. Spain Gene Expression Market, By Capacity, 2019-2032 (USD Billion)
87. Spain Gene Expression Market, By Application, 2019-2032 (USD Billion)
88. Spain Gene Expression Market, By End User, 2019-2032 (USD Billion)
89. Asia Pacific Gene Expression Market, By Process, 2019-2032 (USD Billion)
90. Asia Pacific Gene Expression Market, By Technology, 2019-2032 (USD Billion)
91. Asia Pacific Gene Expression Market, By Product, 2019-2032 (USD Billion)
92. Asia Pacific Gene Expression Market, By Capacity, 2019-2032 (USD Billion)
93. Asia Pacific Gene Expression Market, By Application, 2019-2032 (USD Billion)
94. Asia Pacific Gene Expression Market, By End User, 2019-2032 (USD Billion)
95. Japan Gene Expression Market, By Process, 2019-2032 (USD Billion)
96. Japan Gene Expression Market, By Technology, 2019-2032 (USD Billion)
97. Japan Gene Expression Market, By Product, 2019-2032 (USD Billion)
98. Japan Gene Expression Market, By Capacity, 2019-2032 (USD Billion)
99. Japan Gene Expression Market, By Application, 2019-2032 (USD Billion)
100. Japan Gene Expression Market, By End User, 2019-2032 (USD Billion)
101. China Gene Expression Market, By Process, 2019-2032 (USD Billion)
102. China Gene Expression Market, By Technology, 2019-2032 (USD Billion)
103. China Gene Expression Market, By Product, 2019-2032 (USD Billion)
104. China Gene Expression Market, By Capacity, 2019-2032 (USD Billion)
105. China Gene Expression Market, By Application, 2019-2032 (USD Billion)
106. China Gene Expression Market, By End User, 2019-2032 (USD Billion)
107. India Gene Expression Market, By Process, 2019-2032 (USD Billion)
108. India Gene Expression Market, By Technology, 2019-2032 (USD Billion)
109. India Gene Expression Market, By Product, 2019-2032 (USD Billion)
110. India Gene Expression Market, By Capacity, 2019-2032 (USD Billion)
111. India Gene Expression Market, By Application, 2019-2032 (USD Billion)
112. India Gene Expression Market, By End User, 2019-2032 (USD Billion)
113. South America Gene Expression Market, By Process, 2019-2032 (USD Billion)
114. South America Gene Expression Market, By Technology, 2019-2032 (USD Billion)
115. South America Gene Expression Market, By Product, 2019-2032 (USD Billion)
116. South America Gene Expression Market, By Capacity, 2019-2032 (USD Billion)
117. South America Gene Expression Market, By Application, 2019-2032 (USD Billion)
118. South America Gene Expression Market, By End User, 2019-2032 (USD Billion)
119. Brazil Gene Expression Market, By Process, 2019-2032 (USD Billion)
120. Brazil Gene Expression Market, By Technology, 2019-2032 (USD Billion)
121. Brazil Gene Expression Market, By Product, 2019-2032 (USD Billion)
122. Brazil Gene Expression Market, By Capacity, 2019-2032 (USD Billion)
123. Brazil Gene Expression Market, By Application, 2019-2032 (USD Billion)
124. Brazil Gene Expression Market, By End User, 2019-2032 (USD Billion)
125. Middle East and Africa Gene Expression Market, By Process, 2019-2032 (USD Billion)
126. Middle East and Africa Gene Expression Market, By Technology, 2019-2032 (USD Billion)
127. Middle East and Africa Gene Expression Market, By Product, 2019-2032 (USD Billion)
128. Middle East and Africa Gene Expression Market, By Capacity, 2019-2032 (USD Billion)
129. Middle East and Africa Gene Expression Market, By Application, 2019-2032 (USD Billion)
130. Middle East and Africa Gene Expression Market, By End User, 2019-2032 (USD Billion)
131. UAE Gene Expression Market, By Process, 2019-2032 (USD Billion)
132. UAE Gene Expression Market, By Technology, 2019-2032 (USD Billion)
133. UAE Gene Expression Market, By Product, 2019-2032 (USD Billion)
134. UAE Gene Expression Market, By Capacity, 2019-2032 (USD Billion)
135. UAE Gene Expression Market, By Application, 2019-2032 (USD Billion)
136. UAE Gene Expression Market, By End User, 2019-2032 (USD Billion)
137. South Africa Gene Expression Market, By Process, 2019-2032 (USD Billion)
138. South Africa Gene Expression Market, By Technology, 2019-2032 (USD Billion)
139. South Africa Gene Expression Market, By Product, 2019-2032 (USD Billion)
140. South Africa Gene Expression Market, By Capacity, 2019-2032 (USD Billion)
141. South Africa Gene Expression Market, By Application, 2019-2032 (USD Billion)
142. South Africa Gene Expression Market, By End User, 2019-2032 (USD Billion)
List of Figures
1. Global Gene Expression Market Segmentation
2. Gene Expression Market: Research Methodology
3. Market Size Estimation Methodology: Bottom-Up Approach
4. Market Size Estimation Methodology: Top-Down Approach
5. Data Triangulation
6. Porter’s Five Forces Analysis
7. Value Chain Analysis
8. Global Gene Expression Market Attractiveness Analysis by Process
9. Global Gene Expression Market Attractiveness Analysis by Technology
10. Global Gene Expression Market Attractiveness Analysis by Product
11. Global Gene Expression Market Attractiveness Analysis by Capacity
12. Global Gene Expression Market Attractiveness Analysis by Application
13. Global Gene Expression Market Attractiveness Analysis by End User
14. Global Gene Expression Market Attractiveness Analysis by Region
15. Global Gene Expression Market: Dynamics
16. Global Gene Expression Market Share by Process (2023 & 2032)
17. Global Gene Expression Market Share by Technology (2023 & 2032)
18. Global Gene Expression Market Share by Product (2023 & 2032)
19. Global Gene Expression Market Share by Capacity (2023 & 2032)
20. Global Gene Expression Market Share by Application (2023 & 2032)
21. Global Gene Expression Market Share by End User (2023 & 2032)
22. Global Gene Expression Market Share by Regions (2023 & 2032)
23. Global Gene Expression Market Share by Company (2022)
This study forecasts revenue at global, regional, and country levels from 2019 to 2032. The Brainy Insights has segmented the global gene expression market based on below-mentioned segments:
Global Gene Expression Market by Process:
Global Gene Expression Market by Technology:
Global Gene Expression Market by Product:
Global Gene Expression Market by Capacity:
Global Gene Expression Market by Application:
Global Gene Expression Market by End User:
Global Gene Expression Market by Region:
Research has its special purpose to undertake marketing efficiently. In this competitive scenario, businesses need information across all industry verticals; the information about customer wants, market demand, competition, industry trends, distribution channels etc. This information needs to be updated regularly because businesses operate in a dynamic environment. Our organization, The Brainy Insights incorporates scientific and systematic research procedures in order to get proper market insights and industry analysis for overall business success. The analysis consists of studying the market from a miniscule level wherein we implement statistical tools which helps us in examining the data with accuracy and precision.
Our research reports feature both; quantitative and qualitative aspects for any market. Qualitative information for any market research process are fundamental because they reveal the customer needs and wants, usage and consumption for any product/service related to a specific industry. This in turn aids the marketers/investors in knowing certain perceptions of the customers. Qualitative research can enlighten about the different product concepts and designs along with unique service offering that in turn, helps define marketing problems and generate opportunities. On the other hand, quantitative research engages with the data collection process through interviews, e-mail interactions, surveys and pilot studies. Quantitative aspects for the market research are useful to validate the hypotheses generated during qualitative research method, explore empirical patterns in the data with the help of statistical tools, and finally make the market estimations.
The Brainy Insights offers comprehensive research and analysis, based on a wide assortment of factual insights gained through interviews with CXOs and global experts and secondary data from reliable sources. Our analysts and industry specialist assume vital roles in building up statistical tools and analysis models, which are used to analyse the data and arrive at accurate insights with exceedingly informative research discoveries. The data provided by our organization have proven precious to a diverse range of companies, facilitating them to address issues such as determining which products/services are the most appealing, whether or not customers use the product in the manner anticipated, the purchasing intentions of the market and many others.
Our research methodology encompasses an idyllic combination of primary and secondary initiatives. Key phases involved in this process are listed below:

The phase involves the gathering and collecting of market data and its related information with the help of different sources & research procedures.

The data procurement stage involves in data gathering and collecting through various data sources.
This stage involves in extensive research. These data sources includes:
Purchased Database: Purchased databases play a crucial role in estimating the market sizes irrespective of the domain. Our purchased database includes:
Primary Research: The Brainy Insights interacts with leading companies and experts of the concerned domain to develop the analyst team’s market understanding and expertise. It improves and substantiates every single data presented in the market reports. Primary research mainly involves in telephonic interviews, E-mail interactions and face-to-face interviews with the raw material providers, manufacturers/producers, distributors, & independent consultants. The interviews that we conduct provides valuable data on market size and industry growth trends prevailing in the market. Our organization also conducts surveys with the various industry experts in order to gain overall insights of the industry/market. For instance, in healthcare industry we conduct surveys with the pharmacists, doctors, surgeons and nurses in order to gain insights and key information of a medical product/device/equipment which the customers are going to usage. Surveys are conducted in the form of questionnaire designed by our own analyst team. Surveys plays an important role in primary research because surveys helps us to identify the key target audiences of the market. Additionally, surveys helps to identify the key target audience engaged with the market. Our survey team conducts the survey by targeting the key audience, thus gaining insights from them. Based on the perspectives of the customers, this information is utilized to formulate market strategies. Moreover, market surveys helps us to understand the current competitive situation of the industry. To be precise, our survey process typically involve with the 360 analysis of the market. This analytical process begins by identifying the prospective customers for a product or service related to the market/industry to obtain data on how a product/service could fit into customers’ lives.

Secondary Research: The secondary data sources includes information published by the on-profit organizations such as World bank, WHO, company fillings, investor presentations, annual reports, national government documents, statistical databases, blogs, articles, white papers and others. From the annual report, we analyse a company’s revenue to understand the key segment and market share of that organization in a particular region. We analyse the company websites and adopt the product mapping technique which is important for deriving the segment revenue. In the product mapping method, we select and categorize the products offered by the companies catering to domain specific market, deduce the product revenue for each of the companies so as to get overall estimation of the market size. We also source data and analyses trends based on information received from supply side and demand side intermediaries in the value chain. The supply side denotes the data gathered from supplier, distributor, wholesaler and the demand side illustrates the data gathered from the end customers for respective market domain.

The supply side for a domain specific market is analysed by:
The demand side for the market is estimated through:
In-house Library: Apart from these third-party sources, we have our in-house library of qualitative and quantitative information. Our in-house database includes market data for various industry and domains. These data are updated on regular basis as per the changing market scenario. Our library includes, historic databases, internal audit reports and archives.
Sometimes there are instances where there is no metadata or raw data available for any domain specific market. For those cases, we use our expertise to forecast and estimate the market size in order to generate comprehensive data sets. Our analyst team adopt a robust research technique in order to produce the estimates:
Data Synthesis: This stage involves the analysis & mapping of all the information obtained from the previous step. It also involves in scrutinizing the data for any discrepancy observed while data gathering related to the market. The data is collected with consideration to the heterogeneity of sources. Robust scientific techniques are in place for synthesizing disparate data sets and provide the essential contextual information that can orient market strategies. The Brainy Insights has extensive experience in data synthesis where the data passes through various stages:


Market Deduction & Formulation: The final stage comprises of assigning data points at appropriate market spaces so as to deduce feasible conclusions. Analyst perspective & subject matter expert based holistic form of market sizing coupled with industry analysis also plays a crucial role in this stage.
This stage involves in finalization of the market size and numbers that we have collected from data integration step. With data interpolation, it is made sure that there is no gap in the market data. Successful trend analysis is done by our analysts using extrapolation techniques, which provide the best possible forecasts for the market.
Data Validation & Market Feedback: Validation is the most important step in the process. Validation & re-validation via an intricately designed process helps us finalize data-points to be used for final calculations.

The Brainy Insights interacts with leading companies and experts of the concerned domain to develop the analyst team’s market understanding and expertise. It improves and substantiates every single data presented in the market reports. The data validation interview and discussion panels are typically composed of the most experienced industry members. The participants include, however, are not limited to:
Moreover, we always validate our data and findings through primary respondents from all the major regions we are working on.


Free Customization
Fortune 500 Clients
Free Yearly Update On Purchase Of Multi/Corporate License
Companies Served Till Date