- +1-315-215-1633
- sales@thebrainyinsights.com

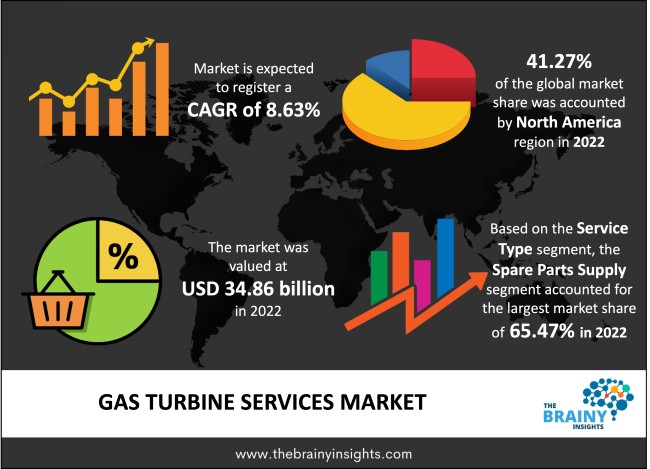
The global gas turbine services market was valued at USD 34.86 billion in 2022 and is anticipated to grow at a CAGR of 8.63% from 2023 to 2032. The market is expected to reach USD 79.77 billion by 2032. The upsurge in multi-year service contracts drives the rise of the gas turbine services market. Additionally, the expanding deployment of combined cycle power plants is another propellant for the gas turbine services market. Furthermore, the escalating use of gas turbines driven by their substantial output capacity presents a favourable prospect for fostering the expansion of the gas turbine services market.
Gas turbine services refer to different ranges of engine maintenance, repair, and optimization activities. Due to their efficiency and power output, gas turbines are broadly used in numerous industries, including marine, power generation, aviation, and industrial applications. Gas turbine services encompass a range of tasks to secure the efficient operation of gas turbine systems. These tasks include routine inspections, preventive maintenance, troubleshooting, component repair or replacement, performance assessments, and efficiency improvements. Regular maintenance involves:
More extensive services might involve overhauls, where significant components like the compressor, combustion chamber, and turbine are disassembled, inspected, repaired, and reassembled to extend the turbine's lifespan and maintain optimal performance. Advanced diagnostic techniques, such as vibration analysis, thermographic imaging, and computational modelling, may be employed to identify potential issues and optimize turbine performance. Gas turbine services contribute significantly to gas turbine systems' longevity, reliability, and efficiency, which are vital for meeting energy demands and operational requirements across different industries. These services help reduce downtime, increase energy efficiency, and minimize environmental impact by ensuring gas turbines operate at peak performance.
Get an overview of this study by requesting a free sample
Growing Energy Demand - The increasing global demand for electricity and power drives the installation and operation of gas turbines in power plants. As economies grow and industries expand, the need for reliable and efficient power generation rises, boosting the demand for gas turbine services.
Aeging Infrastructure - Many existing gas turbines are ageing and require maintenance, repair, and upgrades to extend their operational lifespan. This factor creates a significant market for gas turbine services that can improve the performance of older gas turbines.
Environmental Regulations - Stricter environmental regulations push power producers to improve their gas turbines' efficiency and emissions performance. Service providers offer solutions to retrofit and upgrade gas turbines to meet these regulatory standards. This factor is driving the demand for the gas turbine services market.
High Initial Costs - The investment required to set up gas turbine power plants is significant. It includes the turbines' cost and infrastructure, installation, and commissioning expenses. These high upfront costs can deter some potential investors and limit market growth.
Volatility in Fuel Prices - Gas turbines primarily run on natural gas, subject to price fluctuations due to geopolitical, economic, and supply-demand factors. Uncertainty in fuel prices can affect gas turbine operations' economic viability and lead to investors' hesitancy.
Retrofitting and Upgrades - As gas turbine technology advances, there's a significant opportunity for service providers to offer retrofitting and upgrade solutions to improve the efficiency, performance, and emissions profile of existing gas turbine units. Upgrades can extend the lifespan of older turbines, making them more competitive in a rapidly changing energy market.
Digitalization and IoT Integration - Integrating the Internet of Things (IoT) and digital technologies is anticipated to create new opportunities for remote monitoring, predictive maintenance, and real-time performance optimization. Service providers can develop advanced monitoring and diagnostic tools to enhance turbine reliability and reduce downtime.
Technological Complexity - Gas turbines are intricate machines with complex components. Providing effective maintenance, repair, and upgrade services requires a skilled workforce with expertise in diverse disciplines, which can be challenging to maintain.
Rapid Technological Evolution - Continuous technological advancements characterize the gas turbine industry. Keeping up with these changes and ensuring compatibility with older turbine models can take time and effort for service providers, which can be challenging.
The regions analyzed for the market include North America, Europe, South America, Asia Pacific, the Middle East, and Africa. North American region emerged as the most prominent global gas turbine services market, with a 41.27% market revenue share in 2022.
North America has been at the forefront of technological innovation in the energy sector. The region is home to some of the world's leading gas turbine manufacturers and research institutions, driving the development of cutting-edge turbine technologies and services. The region's well-developed energy infrastructure, including power plants, pipelines, and distribution networks, provides a robust foundation for gas turbine installations and operations. This infrastructure supports the demand for maintenance, repair, and upgrade services. In addition, North America possesses a diverse energy portfolio that includes natural gas, a primary fuel source for gas turbines. Abundant shale gas resources have facilitated the growth of gas-fired power plants, creating a substantial market for gas turbine services. Further, the region's steady economic growth and industrial expansion have increased energy demand. Gas turbines are vital in meeting this demand by providing reliable and efficient power generation, thereby driving the need for associated services. The Asia-Pacific region is anticipated to witness the highest growth rate during the forecast year due to a convergence of factors creating fertile ground for expansion. The Asia-Pacific region comprises some of the world's fastest-growing economies, such as China and India. This economic growth fuels industrialization, urbanization, and rising energy consumption, increasing demand for power generation solutions, including gas turbines.
North America Region Gas Turbine Services Market Share in 2022 - 41.27%
www.thebrainyinsights.com
Check the geographical analysis of this market by requesting a free sample
The service type segment includes maintenance & repair, overhaul and spare parts supply. The spare parts supply segment accounted for the largest market share of around 65.47% in 2022. Gas turbines are complex machines with various components that require periodic replacement due to wear and tear. Spare parts are essential to maintain gas turbines' continuous and reliable operation, ensuring minimal downtime and maximizing power generation output. In addition, gas turbines undergo routine maintenance and repairs to ensure optimal performance and prevent unexpected breakdowns. The availability of genuine and high-quality spare parts is crucial for effective maintenance and timely repairs.
The turbine type segment is classified into aeroderivatives, heavy duty and industrial. The heavy duty segment dominated the market, with a share of around 52.48% in 2022. Heavy-duty gas turbines are designed to produce substantial power, making them well-suited for meeting the energy demands of large-scale industrial processes, power plants, and utility grids. Heavy-duty gas turbines are commonly used in industrial facilities, such as petrochemical plants, refineries, and manufacturing complexes, where a consistent and reliable power supply is critical for operations. Moreover, heavy-duty gas turbines play a significant role in electricity generation, particularly in combined cycle power plants. Their high efficiency and quick start-up capabilities contribute to meeting peak demand and maintaining grid stability.
The turbine capacity segment is classified into <100 MW, 100 to 200 MW and >200 MW. The >200 MW segment dominated the market, with a share of around 39.15% in 2022. Gas turbines with a capacity of over 200 MW are designed to produce a substantial amount of power. This high power output makes them suitable for large-scale industrial processes, utility grids, and power plants that require significant electricity generation. Additionally, gas turbines in this capacity range are often used for base load power generation, providing a consistent and reliable power supply to meet the continuous energy demand of industries and residential areas. They can also meet peak demand during periods of high electricity consumption.
The service provider segment is divided into OEM and Non-OEM. The OEM segment dominated the market, with a share of around 62.39% in 2022. Original Equipment Manufacturers (OEMs) have an intimate understanding of their gas turbine systems, including design specifications, engineering intricacies, and operational nuances. This knowledge enables them to provide comprehensive services that cater to the exact needs of their equipment. Furthermore, OEMs possess unmatched technical expertise in gas turbine technology. This expertise translates into efficient troubleshooting, accurate diagnostics, and effective maintenance and repair services.
The end user segment includes aerospace, power generation, oil & gas, marine and others. The power generation segment dominated the market, with a share of around 68.19% in 2022. The power generation segment is central to providing a stable and reliable electricity supply to residential, commercial, and industrial consumers. Gas turbines are vital to power generation systems, making their services critical to maintaining energy security. Besides, gas turbines excel at meeting peak electricity demand due to their rapid start-up and flexibility. Power Generation companies rely on gas turbines to bridge the gap between base load and peak demand, ensuring grid stability.
| Attribute | Description |
|---|---|
| Market Size | Revenue (USD Billion) |
| Market size value in 2022 | USD 34.86 Billion |
| Market size value in 2032 | USD 79.77 Billion |
| CAGR (2023 to 2032) | 8.63% |
| Historical data | 2019-2021 |
| Base Year | 2022 |
| Forecast | 2023-2032 |
| Region | The regions analyzed for the market are Asia Pacific, Europe, South America, North America, and Middle East & Africa. Furthermore, the regions are further analyzed at the country level. |
| Segments | Service Type, Turbine Type, Turbine Capacity, Service Provider and End User |
As per The Brainy Insights, the size of the gas turbine services market was valued at USD 34.86 billion in 2022 to USD 79.77 billion by 2032.
The global gas turbine services market is growing at a CAGR of 8.63% during the forecast period 2023-2032.
The North American region became the largest market for gas turbine services.
Growing energy demand and strict environmental regulations are influencing the market's growth.
1. Introduction
1.1. Objectives of the Study
1.2. Market Definition
1.3. Research Scope
1.4. Currency
1.5. Key Target Audience
2. Research Methodology and Assumptions
3. Executive Summary
4. Premium Insights
4.1. Porter’s Five Forces Analysis
4.2. Value Chain Analysis
4.3. Top Investment Pockets
4.3.1. Market Attractiveness Analysis by Service Type
4.3.2. Market Attractiveness Analysis by Turbine Type
4.3.3. Market Attractiveness Analysis by Turbine Capacity
4.3.4. Market Attractiveness Analysis by Service Provider
4.3.5. Market Attractiveness Analysis by End User
4.3.6. Market Attractiveness Analysis by Region
4.4. Industry Trends
5. Market Dynamics
5.1. Market Evaluation
5.2. Drivers
5.2.1. Growing Energy Demand
5.2.2. Aging Infrastructure
5.2.3. Environmental Regulations
5.3. Restraints
5.3.1. High Initial Costs
5.3.2. Volatility in Fuel Prices
5.4. Opportunities
5.4.1. Retrofitting and Upgrades
5.4.2. Digitalization and IoT Integration
5.5. Challenges
5.5.1. Technological Complexity
5.5.2. Rapid Technological Evolution
6. Global Gas Turbine Services Market Analysis and Forecast, By Service Type
6.1. Segment Overview
6.2. Maintenance & Repair
6.3. Overhaul
6.4. Spare Parts Supply
7. Global Gas Turbine Services Market Analysis and Forecast, By Turbine Type
7.1. Segment Overview
7.2. Aeroderivatives
7.3. Heavy Duty
7.4. Industrial
8. Global Gas Turbine Services Market Analysis and Forecast, By Turbine Capacity
8.1. Segment Overview
8.2. <100 MW
8.3. 100 to 200 MW
8.4. >200 MW
9. Global Gas Turbine Services Market Analysis and Forecast, By Service Provider
9.1. Segment Overview
9.2. OEM
9.3. Non-OEM
10. Global Gas Turbine Services Market Analysis and Forecast, By End User
10.1. Segment Overview
10.2. Aerospace
10.3. Power Generation
10.4. Oil & Gas
10.5. Marine
10.6. Others
11. Global Gas Turbine Services Market Analysis and Forecast, By Regional Analysis
11.1. Segment Overview
11.2. North America
11.2.1. U.S.
11.2.2. Canada
11.2.3. Mexico
11.3. Europe
11.3.1. Germany
11.3.2. France
11.3.3. U.K.
11.3.4. Italy
11.3.5. Spain
11.4. Asia-Pacific
11.4.1. Japan
11.4.2. China
11.4.3. India
11.5. South America
11.5.1. Brazil
11.6. Middle East and Africa
11.6.1. UAE
11.6.2. South Africa
12. Global Gas Turbine Services Market-Competitive Landscape
12.1. Overview
12.2. Market Share of Key Players in the Gas Turbine Services Market
12.2.1. Global Company Market Share
12.2.2. North America Company Market Share
12.2.3. Europe Company Market Share
12.2.4. APAC Company Market Share
12.3. Competitive Situations and Trends
12.3.1. Product Launches and Developments
12.3.2. Partnerships, Collaborations, and Agreements
12.3.3. Mergers & Acquisitions
12.3.4. Expansions
13. Company Profiles
13.1. General Electric
13.1.1. Business Overview
13.1.2. Company Snapshot
13.1.3. Company Market Share Analysis
13.1.4. Company Product Portfolio
13.1.5. Recent Developments
13.1.6. SWOT Analysis
13.2. Siemens Energy
13.2.1. Business Overview
13.2.2. Company Snapshot
13.2.3. Company Market Share Analysis
13.2.4. Company Product Portfolio
13.2.5. Recent Developments
13.2.6. SWOT Analysis
13.3. Mitsubishi Power, Ltd.
13.3.1. Business Overview
13.3.2. Company Snapshot
13.3.3. Company Market Share Analysis
13.3.4. Company Product Portfolio
13.3.5. Recent Developments
13.3.6. SWOT Analysis
13.4. Kawasaki Heavy Industries, Ltd.
13.4.1. Business Overview
13.4.2. Company Snapshot
13.4.3. Company Market Share Analysis
13.4.4. Company Product Portfolio
13.4.5. Recent Developments
13.4.6. SWOT Analysis
13.5. Solar Turbines Inc.
13.5.1. Business Overview
13.5.2. Company Snapshot
13.5.3. Company Market Share Analysis
13.5.4. Company Product Portfolio
13.5.5. Recent Developments
13.5.6. SWOT Analysis
13.6. Ansaldo Energia
13.6.1. Business Overview
13.6.2. Company Snapshot
13.6.3. Company Market Share Analysis
13.6.4. Company Product Portfolio
13.6.5. Recent Developments
13.6.6. SWOT Analysis
13.7. Bharat Heavy Electricals Ltd.
13.7.1. Business Overview
13.7.2. Company Snapshot
13.7.3. Company Market Share Analysis
13.7.4. Company Product Portfolio
13.7.5. Recent Developments
13.7.6. SWOT Analysis
13.8. OPRA Turbines
13.8.1. Business Overview
13.8.2. Company Snapshot
13.8.3. Company Market Share Analysis
13.8.4. Company Product Portfolio
13.8.5. Recent Developments
13.8.6. SWOT Analysis
13.9. Man Energy Solutions
13.9.1. Business Overview
13.9.2. Company Snapshot
13.9.3. Company Market Share Analysis
13.9.4. Company Product Portfolio
13.9.5. Recent Developments
13.9.6. SWOT Analysis
13.10. Centrax Gas Turbines
13.10.1. Business Overview
13.10.2. Company Snapshot
13.10.3. Company Market Share Analysis
13.10.4. Company Product Portfolio
13.10.5. Recent Developments
13.10.6. SWOT Analysis
13.11. Mubadala Investment Company
13.11.1. Business Overview
13.11.2. Company Snapshot
13.11.3. Company Market Share Analysis
13.11.4. Company Product Portfolio
13.11.5. Recent Developments
13.11.6. SWOT Analysis
13.12. ATLA S.r.l.
13.12.1. Business Overview
13.12.2. Company Snapshot
13.12.3. Company Market Share Analysis
13.12.4. Company Product Portfolio
13.12.5. Recent Developments
13.12.6. SWOT Analysis
13.13. Rolls-Royce plc.
13.13.1. Business Overview
13.13.2. Company Snapshot
13.13.3. Company Market Share Analysis
13.13.4. Company Product Portfolio
13.13.5. Recent Developments
13.13.6. SWOT Analysis
13.14. Sulzer AG
13.14.1. Business Overview
13.14.2. Company Snapshot
13.14.3. Company Market Share Analysis
13.14.4. Company Product Portfolio
13.14.5. Recent Developments
13.14.6. SWOT Analysis
13.15. Hitachi Ltd.
13.15.1. Business Overview
13.15.2. Company Snapshot
13.15.3. Company Market Share Analysis
13.15.4. Company Product Portfolio
13.15.5. Recent Developments
13.15.6. SWOT Analysis
13.16. EthosEnergy
13.16.1. Business Overview
13.16.2. Company Snapshot
13.16.3. Company Market Share Analysis
13.16.4. Company Product Portfolio
13.16.5. Recent Developments
13.16.6. SWOT Analysis
13.17. HPI LLC
13.17.1. Business Overview
13.17.2. Company Snapshot
13.17.3. Company Market Share Analysis
13.17.4. Company Product Portfolio
13.17.5. Recent Developments
13.17.6. SWOT Analysis
13.18. Ethosenergy
13.18.1. Business Overview
13.18.2. Company Snapshot
13.18.3. Company Market Share Analysis
13.18.4. Company Product Portfolio
13.18.5. Recent Developments
13.18.6. SWOT Analysis
13.19. MJB International
13.19.1. Business Overview
13.19.2. Company Snapshot
13.19.3. Company Market Share Analysis
13.19.4. Company Product Portfolio
13.19.5. Recent Developments
13.19.6. SWOT Analysis
13.20. Mechanical Dynamics & Analysis
13.20.1. Business Overview
13.20.2. Company Snapshot
13.20.3. Company Market Share Analysis
13.20.4. Company Product Portfolio
13.20.5. Recent Developments
13.20.6. SWOT Analysis
13.21. Proenergy Services LLC
13.21.1. Business Overview
13.21.2. Company Snapshot
13.21.3. Company Market Share Analysis
13.21.4. Company Product Portfolio
13.21.5. Recent Developments
13.21.6. SWOT Analysis
13.22. MTU Aero Engines Ag
13.22.1. Business Overview
13.22.2. Company Snapshot
13.22.3. Company Market Share Analysis
13.22.4. Company Product Portfolio
13.22.5. Recent Developments
13.22.6. SWOT Analysis
13.23. Incorporated Turbine Services and Solutions LLC.
13.23.1. Business Overview
13.23.2. Company Snapshot
13.23.3. Company Market Share Analysis
13.23.4. Company Product Portfolio
13.23.5. Recent Developments
13.23.6. SWOT Analysis
List of Table
1. Global Gas Turbine Services Market, By Service Type, 2019-2032 (USD Billion)
2. Global Maintenance & Repair, Gas Turbine Services Market, By Region, 2019-2032 (USD Billion)
3. Global Overhaul, Gas Turbine Services Market, By Region, 2019-2032 (USD Billion)
4. Global Spare Parts Supply, Gas Turbine Services Market, By Region, 2019-2032 (USD Billion)
5. Global Gas Turbine Services Market, By Turbine Type, 2019-2032 (USD Billion)
6. Global Aeroderivatives Gas Turbine Services Market, By Region, 2019-2032 (USD Billion)
7. Global Heavy Duty Gas Turbine Services Market, By Region, 2019-2032 (USD Billion)
8. Global Industrial Gas Turbine Services Market, By Region, 2019-2032 (USD Billion)
9. Global Gas Turbine Services Market, By Turbine Capacity, 2019-2032 (USD Billion)
10. Global <100 MW Gas Turbine Services Market, By Region, 2019-2032 (USD Billion)
11. Global 100 to 200 MW Gas Turbine Services Market, By Region, 2019-2032 (USD Billion)
12. Global >200 MW Gas Turbine Services Market, By Region, 2019-2032 (USD Billion)
13. Global Gas Turbine Services Market, By Service Provider, 2019-2032 (USD Billion)
14. Global OEM Gas Turbine Services Market, By Region, 2019-2032 (USD Billion)
15. Global Non-OEM Gas Turbine Services Market, By Region, 2019-2032 (USD Billion)
16. Global Gas Turbine Services Market, By End User, 2019-2032 (USD Billion)
17. Global Aerospace Gas Turbine Services Market, By Region, 2019-2032 (USD Billion)
18. Global Power Generation Gas Turbine Services Market, By Region, 2019-2032 (USD Billion)
19. Global Oil & Gas, Gas Turbine Services Market, By Region, 2019-2032 (USD Billion)
20. Global Marine, Gas Turbine Services Market, By Region, 2019-2032 (USD Billion)
21. Global Others Gas Turbine Services Market, By Region, 2019-2032 (USD Billion)
22. Global Gas Turbine Services Market, By Region, 2019-2032 (USD Billion)
23. North America Gas Turbine Services Market, By Service Type, 2019-2032 (USD Billion)
24. North America Gas Turbine Services Market, By Turbine Type, 2019-2032 (USD Billion)
25. North America Gas Turbine Services Market, By Turbine Capacity, 2019-2032 (USD Billion)
26. North America Gas Turbine Services Market, By Service Provider, 2019-2032 (USD Billion)
27. North America Gas Turbine Services Market, By End User, 2019-2032 (USD Billion)
28. U.S. Gas Turbine Services Market, By Service Type, 2019-2032 (USD Billion)
29. U.S. Gas Turbine Services Market, By Turbine Type, 2019-2032 (USD Billion)
30. U.S. Gas Turbine Services Market, By Turbine Capacity, 2019-2032 (USD Billion)
31. U.S. Gas Turbine Services Market, By Service Provider, 2019-2032 (USD Billion)
32. U.S. Gas Turbine Services Market, By End User, 2019-2032 (USD Billion)
33. Canada Gas Turbine Services Market, By Service Type, 2019-2032 (USD Billion)
34. Canada Gas Turbine Services Market, By Turbine Type, 2019-2032 (USD Billion)
35. Canada Gas Turbine Services Market, By Turbine Capacity, 2019-2032 (USD Billion)
36. Canada Gas Turbine Services Market, By Service Provider, 2019-2032 (USD Billion)
37. Canada Gas Turbine Services Market, By End User, 2019-2032 (USD Billion)
38. Mexico Gas Turbine Services Market, By Service Type, 2019-2032 (USD Billion)
39. Mexico Gas Turbine Services Market, By Turbine Type, 2019-2032 (USD Billion)
40. Mexico Gas Turbine Services Market, By Turbine Capacity, 2019-2032 (USD Billion)
41. Mexico Gas Turbine Services Market, By Service Provider, 2019-2032 (USD Billion)
42. Mexico Gas Turbine Services Market, By End User, 2019-2032 (USD Billion)
43. Europe Gas Turbine Services Market, By Service Type, 2019-2032 (USD Billion)
44. Europe Gas Turbine Services Market, By Turbine Type, 2019-2032 (USD Billion)
45. Europe Gas Turbine Services Market, By Turbine Capacity, 2019-2032 (USD Billion)
46. Europe Gas Turbine Services Market, By Service Provider, 2019-2032 (USD Billion)
47. Europe Gas Turbine Services Market, By End User, 2019-2032 (USD Billion)
48. Germany Gas Turbine Services Market, By Service Type, 2019-2032 (USD Billion)
49. Germany Gas Turbine Services Market, By Turbine Type, 2019-2032 (USD Billion)
50. Germany Gas Turbine Services Market, By Turbine Capacity, 2019-2032 (USD Billion)
51. Germany Gas Turbine Services Market, By Service Provider, 2019-2032 (USD Billion)
52. Germany Gas Turbine Services Market, By End User, 2019-2032 (USD Billion)
53. France Gas Turbine Services Market, By Service Type, 2019-2032 (USD Billion)
54. France Gas Turbine Services Market, By Turbine Type, 2019-2032 (USD Billion)
55. France Gas Turbine Services Market, By Turbine Capacity, 2019-2032 (USD Billion)
56. France Gas Turbine Services Market, By Service Provider, 2019-2032 (USD Billion)
57. France Gas Turbine Services Market, By End User, 2019-2032 (USD Billion)
58. U.K. Gas Turbine Services Market, By Service Type, 2019-2032 (USD Billion)
59. U.K. Gas Turbine Services Market, By Turbine Type, 2019-2032 (USD Billion)
60. U.K. Gas Turbine Services Market, By Turbine Capacity, 2019-2032 (USD Billion)
61. U.K. Gas Turbine Services Market, By Service Provider, 2019-2032 (USD Billion)
62. U.K. Gas Turbine Services Market, By End User, 2019-2032 (USD Billion)
63. Italy Gas Turbine Services Market, By Service Type, 2019-2032 (USD Billion)
64. Italy Gas Turbine Services Market, By Turbine Type, 2019-2032 (USD Billion)
65. Italy Gas Turbine Services Market, By Turbine Capacity, 2019-2032 (USD Billion)
66. Italy Gas Turbine Services Market, By Service Provider, 2019-2032 (USD Billion)
67. Italy Gas Turbine Services Market, By End User, 2019-2032 (USD Billion)
68. Spain Gas Turbine Services Market, By Service Type, 2019-2032 (USD Billion)
69. Spain Gas Turbine Services Market, By Turbine Type, 2019-2032 (USD Billion)
70. Spain Gas Turbine Services Market, By Turbine Capacity, 2019-2032 (USD Billion)
71. Spain Gas Turbine Services Market, By Service Provider, 2019-2032 (USD Billion)
72. Spain Gas Turbine Services Market, By End User, 2019-2032 (USD Billion)
73. Asia Pacific Gas Turbine Services Market, By Service Type, 2019-2032 (USD Billion)
74. Asia Pacific Gas Turbine Services Market, By Turbine Type, 2019-2032 (USD Billion)
75. Asia Pacific Gas Turbine Services Market, By Turbine Capacity, 2019-2032 (USD Billion)
76. Asia Pacific Gas Turbine Services Market, By Service Provider, 2019-2032 (USD Billion)
77. Asia Pacific Gas Turbine Services Market, By End User, 2019-2032 (USD Billion)
78. Japan Gas Turbine Services Market, By Service Type, 2019-2032 (USD Billion)
79. Japan Gas Turbine Services Market, By Turbine Type, 2019-2032 (USD Billion)
80. Japan Gas Turbine Services Market, By Turbine Capacity, 2019-2032 (USD Billion)
81. Japan Gas Turbine Services Market, By Service Provider, 2019-2032 (USD Billion)
82. Japan Gas Turbine Services Market, By End User, 2019-2032 (USD Billion)
83. China Gas Turbine Services Market, By Service Type, 2019-2032 (USD Billion)
84. China Gas Turbine Services Market, By Turbine Type, 2019-2032 (USD Billion)
85. China Gas Turbine Services Market, By Turbine Capacity, 2019-2032 (USD Billion)
86. China Gas Turbine Services Market, By Service Provider, 2019-2032 (USD Billion)
87. China Gas Turbine Services Market, By End User, 2019-2032 (USD Billion)
88. India Gas Turbine Services Market, By Service Type, 2019-2032 (USD Billion)
89. India Gas Turbine Services Market, By Turbine Type, 2019-2032 (USD Billion)
90. India Gas Turbine Services Market, By Turbine Capacity, 2019-2032 (USD Billion)
91. India Gas Turbine Services Market, By Service Provider, 2019-2032 (USD Billion)
92. India Gas Turbine Services Market, By End User, 2019-2032 (USD Billion)
93. South America Gas Turbine Services Market, By Service Type, 2019-2032 (USD Billion)
94. South America Gas Turbine Services Market, By Turbine Type, 2019-2032 (USD Billion)
95. South America Gas Turbine Services Market, By Turbine Capacity, 2019-2032 (USD Billion)
96. South America Gas Turbine Services Market, By Service Provider, 2019-2032 (USD Billion)
97. South America Gas Turbine Services Market, By End User, 2019-2032 (USD Billion)
98. Brazil Gas Turbine Services Market, By Service Type, 2019-2032 (USD Billion)
99. Brazil Gas Turbine Services Market, By Turbine Type, 2019-2032 (USD Billion)
100. Brazil Gas Turbine Services Market, By Turbine Capacity, 2019-2032 (USD Billion)
101. Brazil Gas Turbine Services Market, By Service Provider, 2019-2032 (USD Billion)
102. Brazil Gas Turbine Services Market, By End User, 2019-2032 (USD Billion)
103. Middle East and Africa Gas Turbine Services Market, By Service Type, 2019-2032 (USD Billion)
104. Middle East and Africa Gas Turbine Services Market, By Turbine Type, 2019-2032 (USD Billion)
105. Middle East and Africa Gas Turbine Services Market, By Turbine Capacity, 2019-2032 (USD Billion)
106. Middle East and Africa Gas Turbine Services Market, By Service Provider, 2019-2032 (USD Billion)
107. Middle East and Africa Gas Turbine Services Market, By End User, 2019-2032 (USD Billion)
108. UAE Gas Turbine Services Market, By Service Type, 2019-2032 (USD Billion)
109. UAE Gas Turbine Services Market, By Turbine Type, 2019-2032 (USD Billion)
110. UAE Gas Turbine Services Market, By Turbine Capacity, 2019-2032 (USD Billion)
111. UAE Gas Turbine Services Market, By Service Provider, 2019-2032 (USD Billion)
112. UAE Gas Turbine Services Market, By End User, 2019-2032 (USD Billion)
113. South Africa Gas Turbine Services Market, By Service Type, 2019-2032 (USD Billion)
114. South Africa Gas Turbine Services Market, By Turbine Type, 2019-2032 (USD Billion)
115. South Africa Gas Turbine Services Market, By Turbine Capacity, 2019-2032 (USD Billion)
116. South Africa Gas Turbine Services Market, By Service Provider, 2019-2032 (USD Billion)
117. South Africa Gas Turbine Services Market, By End User, 2019-2032 (USD Billion)
List of Figures
1. Global Gas Turbine Services Market Segmentation
2. Gas Turbine Services Market: Research Methodology
3. Market Size Estimation Methodology: Bottom-Up Approach
4. Market Size Estimation Methodology: Top-Down Approach
5. Data Triangulation
6. Porter’s Five Forces Analysis
7. Value Chain Analysis
8. Global Gas Turbine Services Market Attractiveness Analysis by Service Type
9. Global Gas Turbine Services Market Attractiveness Analysis by Turbine Type
10. Global Gas Turbine Services Market Attractiveness Analysis by Turbine Capacity
11. Global Gas Turbine Services Market Attractiveness Analysis by Service Provider
12. Global Gas Turbine Services Market Attractiveness Analysis by End User
13. Global Gas Turbine Services Market Attractiveness Analysis by Region
14. Global Gas Turbine Services Market: Dynamics
15. Global Gas Turbine Services Market Share by Service Type (2023 & 2032)
16. Global Gas Turbine Services Market Share by Turbine Type (2023 & 2032)
17. Global Gas Turbine Services Market Share by Turbine Capacity (2023 & 2032)
18. Global Gas Turbine Services Market Share by Service Provider (2023 & 2032)
19. Global Gas Turbine Services Market Share by End User (2023 & 2032)
20. Global Gas Turbine Services Market Share by Regions (2023 & 2032)
21. Global Gas Turbine Services Market Share by Company (2022)
This study forecasts revenue at global, regional, and country levels from 2019 to 2032. The Brainy Insights has segmented the global gas turbine services market based on below-mentioned segments:
Global Gas Turbine Services Market by Service Type:
Global Gas Turbine Services Market by Turbine Type:
Global Gas Turbine Services Market by Turbine Capacity:
Global Gas Turbine Services Market by Service Provider:
Global Gas Turbine Services Market by End User:
Global Gas Turbine Services Market by Region:
Research has its special purpose to undertake marketing efficiently. In this competitive scenario, businesses need information across all industry verticals; the information about customer wants, market demand, competition, industry trends, distribution channels etc. This information needs to be updated regularly because businesses operate in a dynamic environment. Our organization, The Brainy Insights incorporates scientific and systematic research procedures in order to get proper market insights and industry analysis for overall business success. The analysis consists of studying the market from a miniscule level wherein we implement statistical tools which helps us in examining the data with accuracy and precision.
Our research reports feature both; quantitative and qualitative aspects for any market. Qualitative information for any market research process are fundamental because they reveal the customer needs and wants, usage and consumption for any product/service related to a specific industry. This in turn aids the marketers/investors in knowing certain perceptions of the customers. Qualitative research can enlighten about the different product concepts and designs along with unique service offering that in turn, helps define marketing problems and generate opportunities. On the other hand, quantitative research engages with the data collection process through interviews, e-mail interactions, surveys and pilot studies. Quantitative aspects for the market research are useful to validate the hypotheses generated during qualitative research method, explore empirical patterns in the data with the help of statistical tools, and finally make the market estimations.
The Brainy Insights offers comprehensive research and analysis, based on a wide assortment of factual insights gained through interviews with CXOs and global experts and secondary data from reliable sources. Our analysts and industry specialist assume vital roles in building up statistical tools and analysis models, which are used to analyse the data and arrive at accurate insights with exceedingly informative research discoveries. The data provided by our organization have proven precious to a diverse range of companies, facilitating them to address issues such as determining which products/services are the most appealing, whether or not customers use the product in the manner anticipated, the purchasing intentions of the market and many others.
Our research methodology encompasses an idyllic combination of primary and secondary initiatives. Key phases involved in this process are listed below:

The phase involves the gathering and collecting of market data and its related information with the help of different sources & research procedures.

The data procurement stage involves in data gathering and collecting through various data sources.
This stage involves in extensive research. These data sources includes:
Purchased Database: Purchased databases play a crucial role in estimating the market sizes irrespective of the domain. Our purchased database includes:
Primary Research: The Brainy Insights interacts with leading companies and experts of the concerned domain to develop the analyst team’s market understanding and expertise. It improves and substantiates every single data presented in the market reports. Primary research mainly involves in telephonic interviews, E-mail interactions and face-to-face interviews with the raw material providers, manufacturers/producers, distributors, & independent consultants. The interviews that we conduct provides valuable data on market size and industry growth trends prevailing in the market. Our organization also conducts surveys with the various industry experts in order to gain overall insights of the industry/market. For instance, in healthcare industry we conduct surveys with the pharmacists, doctors, surgeons and nurses in order to gain insights and key information of a medical product/device/equipment which the customers are going to usage. Surveys are conducted in the form of questionnaire designed by our own analyst team. Surveys plays an important role in primary research because surveys helps us to identify the key target audiences of the market. Additionally, surveys helps to identify the key target audience engaged with the market. Our survey team conducts the survey by targeting the key audience, thus gaining insights from them. Based on the perspectives of the customers, this information is utilized to formulate market strategies. Moreover, market surveys helps us to understand the current competitive situation of the industry. To be precise, our survey process typically involve with the 360 analysis of the market. This analytical process begins by identifying the prospective customers for a product or service related to the market/industry to obtain data on how a product/service could fit into customers’ lives.

Secondary Research: The secondary data sources includes information published by the on-profit organizations such as World bank, WHO, company fillings, investor presentations, annual reports, national government documents, statistical databases, blogs, articles, white papers and others. From the annual report, we analyse a company’s revenue to understand the key segment and market share of that organization in a particular region. We analyse the company websites and adopt the product mapping technique which is important for deriving the segment revenue. In the product mapping method, we select and categorize the products offered by the companies catering to domain specific market, deduce the product revenue for each of the companies so as to get overall estimation of the market size. We also source data and analyses trends based on information received from supply side and demand side intermediaries in the value chain. The supply side denotes the data gathered from supplier, distributor, wholesaler and the demand side illustrates the data gathered from the end customers for respective market domain.

The supply side for a domain specific market is analysed by:
The demand side for the market is estimated through:
In-house Library: Apart from these third-party sources, we have our in-house library of qualitative and quantitative information. Our in-house database includes market data for various industry and domains. These data are updated on regular basis as per the changing market scenario. Our library includes, historic databases, internal audit reports and archives.
Sometimes there are instances where there is no metadata or raw data available for any domain specific market. For those cases, we use our expertise to forecast and estimate the market size in order to generate comprehensive data sets. Our analyst team adopt a robust research technique in order to produce the estimates:
Data Synthesis: This stage involves the analysis & mapping of all the information obtained from the previous step. It also involves in scrutinizing the data for any discrepancy observed while data gathering related to the market. The data is collected with consideration to the heterogeneity of sources. Robust scientific techniques are in place for synthesizing disparate data sets and provide the essential contextual information that can orient market strategies. The Brainy Insights has extensive experience in data synthesis where the data passes through various stages:


Market Deduction & Formulation: The final stage comprises of assigning data points at appropriate market spaces so as to deduce feasible conclusions. Analyst perspective & subject matter expert based holistic form of market sizing coupled with industry analysis also plays a crucial role in this stage.
This stage involves in finalization of the market size and numbers that we have collected from data integration step. With data interpolation, it is made sure that there is no gap in the market data. Successful trend analysis is done by our analysts using extrapolation techniques, which provide the best possible forecasts for the market.
Data Validation & Market Feedback: Validation is the most important step in the process. Validation & re-validation via an intricately designed process helps us finalize data-points to be used for final calculations.

The Brainy Insights interacts with leading companies and experts of the concerned domain to develop the analyst team’s market understanding and expertise. It improves and substantiates every single data presented in the market reports. The data validation interview and discussion panels are typically composed of the most experienced industry members. The participants include, however, are not limited to:
Moreover, we always validate our data and findings through primary respondents from all the major regions we are working on.


Free Customization
Fortune 500 Clients
Free Yearly Update On Purchase Of Multi/Corporate License
Companies Served Till Date