- +1-315-215-1633
- sales@thebrainyinsights.com

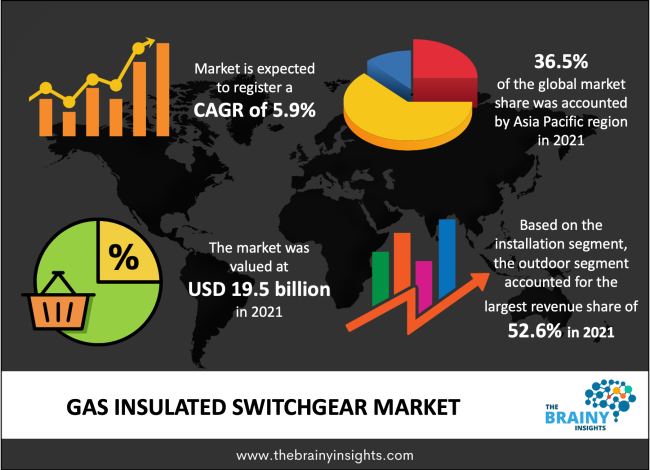
The gas insulated switchgear market was estimated at around USD 19.5 billion in 2021, growing at a CAGR of nearly 5.9% during 2022-2030. The market is projected to reach approximately USD 32.6 billion by 2030.
A small metal cabinet that houses high-voltage components such circuit breakers, relays, switches, and disconnectors is referred to as gas insulated switchgear (GIS). Utilizing sulphur hexafluoride as insulation helps the electrical system vacuum up air and break circuits. It makes it easier to transmit energy, integrate power producing facilities into the grid, and safeguard the distribution system by disengaging the system in case of dangerous circumstances. GIS is more reliable, versatile, and environmentally friendly than the air-insulated switchgear that is typically in use. It also requires less maintenance. Typically, they are installed on roof extensions, industrial plants, and offshore platforms. One of the markets with the quickest growth is the gas insulated switchgear market, which has had a big impact on the growth of the world power industry. The gas insulated switchgear market is anticipated to expand significantly over the predicted time frame. The demand for power and energy in developing sectors is likely to increase, and there will be a considerable push toward electrification in rural regions.
Get an overview of this study by requesting a free sample
Numerous lockdowns brought about by the COVID-19 outbreak contributed to the global economic downturn. Numerous industrial facilities and current projects were halted as a result of the lockdown, which resulted in financial losses in addition to the negative effects of COVID-19. The inability of manufacturers to generate SF6 throughout the pandemic caused a further delay in the development of gas-insulated switchgear. The lack of SF6 had a significant impact on any project currently in progress that involved the adoption of GIS. The industrial and commercial sectors slowed down due to weaker discretionary spending, which hampers the market for gas-insulated switchgear (GIS). Additionally, the epidemic significantly slowed the development of universal energy access. However, as limitations became more lenient, the demand for power began to improve.
Rising renewable energy production and demand to accelerate the market’s growth
Numerous government subsidies in more than 130 countries, strong net-zero goals set by countries, and improved solar PV and wind competitiveness are all contributing to the expansion of renewable energy. China's pledge to achieve carbon neutrality by 2060 has prompted additional short-term goals like generating 1,200 GW of total renewable energy capacity by 2030. Projections show that in 2030, the amount of renewable energy in the European Union will go beyond what is predicted by the existing National Energy and Climate Plans (NECPs).
Benefits would encourage its widespread use
GIS is superior than a traditional substation in many ways. First, the failure rate of GIS is an order of magnitude lower than that of conventional open substation equipment, and its maintenance cycle can be extended. The longest conceivable time for GIS Substation maintenance is 20 to 25 years, with a normal maintenance cycle of around 10 years. Hardware for GIS can be placed easily. It is typically built at the factory and then transported right to the spot; no additional assembly is necessary. As a result, GIS equipment has become an essential component of substation electrical systems, creating a sizable market.
Boosting transmission & distribution infrastructure investments
To meet the rising demand for electricity, nations are investing in the construction of transmission and distribution infrastructure. For instance, Saudi Arabia intends to spend a significant amount of money—$100 billion—to increase its electricity generation from the current level of 40,000 MW to 80,000 MW over the course of the next ten years. The World Energy Investment figures project that between 2014 and 2035, investments in T&D infrastructure would rise to USD 6.8 trillion. Gas-insulated switchgear offers a number of benefits at high voltages, including a quenching mechanism, reduced operating and maintenance costs, and space constraints. The State Grid Corporation of China (SGCC), the country's largest state-owned utility company, announced plans to invest USD 33.7 billion in the construction of 12 electrical transmission lines. These T&D expansion projects would raise the demand for gas-insulated switchgear, making it a necessary part of the power grid network.
The gas insulated switchgear market is categorized into the insulation type, installation, and end user. According to insulation type, the market for SF6-free segment is estimated to lead the market during the forecast period. The growing need for environmentally friendly products across a variety of commercial and industrial sectors is what is driving the demand for SF6-free products. Additionally, the development of dependable, efficient, and sustainable switchgear is anticipated to propel market expansion in response to growing public awareness of the harm caused by sulphur hexafluoride. Additionally, a lot of important players concentrate on creating eco-friendly solutions to suit current and future energy needs.
By installation, the outdoor segment is anticipated to dominant the gas insulated switchgear market during the forecast period. Although it is not as challenging to build outside switchgear as it is inside substations, it does take up a lot of room. Electric switchgear installation is less expensive from this perspective. Outdoor substations come in two varieties: pole-mounted substations and substations that are mounted on a foundation.
By end user, the power transmission utility segment is anticipated to dominant the gas insulated switchgear market during the forecast period. Globally, there is a growing need for transmission networks as a result of the continuous rise in energy demand brought on by growing population, increased urbanization, and industrialization.
Asia-Pacific, which currently dominates the market's revenue share, is anticipated to remain one of the most alluring markets during the projection period. The economies of South Korea, Japan, China, and India are among those that have contributed significantly to the market's expansion. China is a very interesting market for gas insulation switchgears and its equipment. The rise is linked to the rising need for electricity and power in developing nations. The market is expanding in the region due to an increase in the number of gas insulation substations, rising power demand, the need for improvements in ageing electrical infrastructure, rising government investments in hydroelectric power projects, and an increase in the use of gas insulation switchgears in city structures, on roofs, offshore platforms, and industrial plants.
The global Gas insulated switchgear market is segmented as follows:
By Insulation type
By Installation
By End User
By Region/Geography
| Attribute | Description |
|---|---|
| Base Year | 2021 |
| Forecast period | 2022-2030 |
| Report Coverage | Revenue estimation and forecast, company profile, competitive landscape, growth factors, and recent trends |
| Regional scope | North America, Europe, Asia Pacific, Middle East & Africa, and Latin America |
| Market Size(unit) | USD Billion |
| CAGR (2022 to 2030) | 5.9% |
| Segments Covered |
By Insulation Type |
1. Introduction
1.1. Objectives of the Study
1.2. Market Definition
1.3. Research Scope
2. Research Methodology and Assumptions
3. Executive Summary
4. Premium Insights
4.1. Porter’s Five Forces Analysis
4.2. Value Chain Analysis
4.3. Top Investment Pockets
4.3.1. Market Attractiveness Analysis By Insulation Type
4.3.2. Market Attractiveness Analysis By Installation
4.3.3. Market Attractiveness Analysis By End User
4.4. Industry Trends
5. Market Dynamics
5.1. Market Evaluation
5.2. Drivers
5.2.1. Rising renewable energy production and demand to accelerate the market’s growth
5.2.2. Benefits would encourage its widespread use
5.2.3. Boosting transmission & distribution infrastructure investments
5.3. Restrains
5.3.1. Strict guidelines limiting SF6 gas emissions would hamper the market
5.4. Opportunities
5.4.1. Ongoing development of smart grids
6. Global Gas Insulated Switchgear Market Analysis and Forecast, By Insulation Type
6.1. Segment Overview
6.2. SF6
6.3. SF6-Free
7. Global Gas Insulated Switchgear Market Analysis and Forecast, By Installation
7.1. Segment Overview
7.2. Indoor
7.3. Outdoor
8. Global Gas Insulated Switchgear Market Analysis and Forecast, By End User
8.1. Segment Overview
8.2. Power Transmission Utility
8.3. Power Generation Utility
8.4. Power Distribution Utility
8.5. Railways & Metros
8.6. Industrial & OEMs
8.7. Commercial
9. Global Gas Insulated Switchgear Market Analysis and Forecast, By Regional Analysis
9.1. Segment Overview
9.2. North America
9.2.1. U.S.
9.2.2. Canada
9.2.3. Mexico
9.3. Europe
9.3.1. Germany
9.3.2. France
9.3.3. U.K.
9.3.4. Italy
9.3.5. Spain
9.3.6. Rest of Europe
9.4. Asia-Pacific
9.4.1. Japan
9.4.2. China
9.4.3. India
9.4.4. Australia
9.4.5. South Korea
9.4.6. Rest of Asia-Pacific
9.5. South America
9.5.1. Brazil
9.5.2. Argentina
9.5.3. Rest of South America
9.6. Middle East and Africa
9.6.1. UAE
9.6.2. South Africa
9.6.3. Saudi Arabia
9.6.4. Rest of Middle East & Africa
10. Global Gas Insulated Switchgear Market-Competitive Landscape
10.1. Overview
10.2. Market Share of Key Players in the Gas Insulated Switchgear Market
10.2.1. Global Company Market Share
10.2.2. North America Company Market Share
10.2.3. Europe Company Market Share
10.2.4. APAC Company Market Share
10.3. Competitive Situations and Trends
10.3.1. Insulation Type Launches and Developments
10.3.2. Partnerships, Collaborations, and Agreements
10.3.3. Mergers & Acquisitions
10.3.4. Expansions
11. Company Profiles
11.1. ABB
11.1.1. Business Overview
11.1.2. Company Snapshot
11.1.3. Company Market Share Analysis
11.1.4. Company End User Portfolio
11.1.5. Recent Developments
11.1.6. SWOT Analysis
11.2. Schneider Electric
11.2.1. Business Overview
11.2.2. Company Snapshot
11.2.3. Company Market Share Analysis
11.2.4. Company End User Portfolio
11.2.5. Recent Developments
11.2.6. SWOT Analysis
11.3. Eaton Corporation
11.3.1. Business Overview
11.3.2. Company Snapshot
11.3.3. Company Market Share Analysis
11.3.4. Company End User Portfolio
11.3.5. Recent Developments
11.3.6. SWOT Analysis
11.4. Industrial Solutions Limited
11.4.1. Business Overview
11.4.2. Company Snapshot
11.4.3. Company Market Share Analysis
11.4.4. Company End User Portfolio
11.4.5. Recent Developments
11.4.6. SWOT Analysis
11.5. Hyosung
11.5.1. Business Overview
11.5.2. Company Snapshot
11.5.3. Company Market Share Analysis
11.5.4. Company End User Portfolio
11.5.5. Recent Developments
11.5.6. SWOT Analysis
11.6. Toshiba
11.6.1. Business Overview
11.6.2. Company Snapshot
11.6.3. Company Market Share Analysis
11.6.4. Company End User Portfolio
11.6.5. Recent Developments
11.6.6. SWOT Analysis
11.7. CG Power
11.7.1. Business Overview
11.7.2. Company Snapshot
11.7.3. Company Market Share Analysis
11.7.4. Company End User Portfolio
11.7.5. Recent Developments
11.7.6. SWOT Analysis
11.8. Hitachi
11.8.1. Business Overview
11.8.2. Company Snapshot
11.8.3. Company Market Share Analysis
11.8.4. Company End User Portfolio
11.8.5. Recent Developments
11.8.6. SWOT Analysis
11.9. Mitsubishi Electric
11.9.1. Business Overview
11.9.2. Company Snapshot
11.9.3. Company Market Share Analysis
11.9.4. Company End User Portfolio
11.9.5. Recent Developments
11.9.6. SWOT Analysis
11.10. Larsen &Toubro
11.10.1. Business Overview
11.10.2. Company Snapshot
11.10.3. Company Market Share Analysis
11.10.4. Company End User Portfolio
11.10.5. Recent Developments
11.10.6. SWOT Analysis
List of Table
1. Global Gas Insulated Switchgear Market, By Insulation Type, 2022-2030(USD Billion)
2. Global SF6 Gas Insulated Switchgear Market, By Region, 2022-2030(USD Billion)
3. Global SF6-Free Gas Insulated Switchgear Market, By Region, 2022-2030(USD Billion)
4. Global Gas Insulated Switchgear Market, By Installation, 2022-2030(USD Billion)
5. Global Indoor Gas Insulated Switchgear Market, By Region, 2022-2030(USD Billion)
6. Global Outdoor Gas Insulated Switchgear Market, By Region, 2022-2030(USD Billion)
7. Global Gas Insulated Switchgear Market, By End User, 2022-2030(USD Billion)
8. Global Power Transmission Utility Gas Insulated Switchgear Market, By Region, 2022-2030(USD Billion)
9. Global Power Generation Utility Gas Insulated Switchgear Market, By Region, 2022-2030(USD Billion)
10. Global Power Distribution Utility Gas Insulated Switchgear Market, By Region, 2022-2030(USD Billion)
11. Global Railways & Metros Gas Insulated Switchgear Market, By Region, 2022-2030(USD Billion)
12. Global Industrial & OEMs Gas Insulated Switchgear Market, By Region, 2022-2030(USD Billion)
13. Global Commercial Gas Insulated Switchgear Market, By Region, 2022-2030(USD Billion)
14. Global Gas Insulated Switchgear Market, By Region, 2022-2030(USD Billion)
15. Global Gas Insulated Switchgear Market, By North America, 2022-2030(USD Billion)
16. North America Gas Insulated Switchgear Market, By Insulation Type, 2022-2030(USD Billion)
17. North America Gas Insulated Switchgear Market, By Installation, 2022-2030(USD Billion)
18. North America Gas Insulated Switchgear Market, By End User, 2022-2030(USD Billion)
19. U.S. Gas Insulated Switchgear Market, By Insulation Type, 2022-2030(USD Billion)
20. U.S. Gas Insulated Switchgear Market, By Installation, 2022-2030(USD Billion)
21. U.S. Gas Insulated Switchgear Market, By End User, 2022-2030(USD Billion)
22. Canada Gas Insulated Switchgear Market, By Insulation Type, 2022-2030(USD Billion)
23. Canada Gas Insulated Switchgear Market, By Installation, 2022-2030(USD Billion)
24. Canada Gas Insulated Switchgear Market, By End User, 2022-2030(USD Billion)
25. Mexico Gas Insulated Switchgear Market, By Insulation Type, 2022-2030(USD Billion)
26. Mexico Gas Insulated Switchgear Market, By Installation, 2022-2030(USD Billion)
27. Mexico Gas Insulated Switchgear Market, By End User, 2022-2030(USD Billion)
28. Europe Gas Insulated Switchgear Market, By Insulation Type, 2022-2030(USD Billion)
29. Europe Gas Insulated Switchgear Market, By Installation, 2022-2030(USD Billion)
30. Europe Gas Insulated Switchgear Market, By End User, 2022-2030(USD Billion)
31. Germany Gas Insulated Switchgear Market, By Insulation Type, 2022-2030(USD Billion)
32. Germany Gas Insulated Switchgear Market, By Installation, 2022-2030(USD Billion)
33. Germany Gas Insulated Switchgear Market, By End User, 2022-2030(USD Billion)
34. France Gas Insulated Switchgear Market, By Insulation Type, 2022-2030(USD Billion)
35. France Gas Insulated Switchgear Market, By Installation, 2022-2030(USD Billion)
36. France Gas Insulated Switchgear Market, By End User, 2022-2030(USD Billion)
37. U.K. Gas Insulated Switchgear Market, By Insulation Type, 2022-2030(USD Billion)
38. U.K. Gas Insulated Switchgear Market, By Installation, 2022-2030(USD Billion)
39. U.K. Gas Insulated Switchgear Market, By End User, 2022-2030(USD Billion)
40. Italy Gas Insulated Switchgear Market, By Insulation Type, 2022-2030(USD Billion)
41. Italy Gas Insulated Switchgear Market, By Installation, 2022-2030(USD Billion)
42. Italy Gas Insulated Switchgear Market, By End User, 2022-2030(USD Billion)
43. Spain Gas Insulated Switchgear Market, By Insulation Type, 2022-2030(USD Billion)
44. Spain Gas Insulated Switchgear Market, By Installation, 2022-2030(USD Billion)
45. Spain Gas Insulated Switchgear Market, By End User, 2022-2030(USD Billion)
46. Rest of Europe Gas Insulated Switchgear Market, By Insulation Type, 2022-2030(USD Billion)
47. Rest of Europe Gas Insulated Switchgear Market, By Installation, 2022-2030(USD Billion)
48. Rest of Europe Gas Insulated Switchgear Market, By End User, 2022-2030(USD Billion)
49. Asia Pacific Gas Insulated Switchgear Market, By Insulation Type, 2022-2030(USD Billion)
50. Asia Pacific Gas Insulated Switchgear Market, By Installation, 2022-2030(USD Billion)
51. Asia Pacific Gas Insulated Switchgear Market, By End User, 2022-2030(USD Billion)
52. Japan Gas Insulated Switchgear Market, By Insulation Type, 2022-2030(USD Billion)
53. Japan Gas Insulated Switchgear Market, By Installation, 2022-2030(USD Billion)
54. Japan Gas Insulated Switchgear Market, By End User, 2022-2030(USD Billion)
55. China Gas Insulated Switchgear Market, By Insulation Type, 2022-2030(USD Billion)
56. China Gas Insulated Switchgear Market, By Installation, 2022-2030(USD Billion)
57. China Gas Insulated Switchgear Market, By End User, 2022-2030(USD Billion)
58. India Gas Insulated Switchgear Market, By Insulation Type, 2022-2030(USD Billion)
59. India Gas Insulated Switchgear Market, By Installation, 2022-2030(USD Billion)
60. India Gas Insulated Switchgear Market, By End User, 2022-2030(USD Billion)
61. Australia Gas Insulated Switchgear Market, By Insulation Type, 2022-2030(USD Billion)
62. Australia Gas Insulated Switchgear Market, By Installation, 2022-2030(USD Billion)
63. Australia Gas Insulated Switchgear Market, By End User, 2022-2030(USD Billion)
64. South Korea Gas Insulated Switchgear Market, By Insulation Type, 2022-2030(USD Billion)
65. South Korea Gas Insulated Switchgear Market, By Installation, 2022-2030(USD Billion)
66. South Korea Gas Insulated Switchgear Market, By End User, 2022-2030(USD Billion)
67. Rest of Asia-Pacific Gas Insulated Switchgear Market, By Insulation Type, 2022-2030(USD Billion)
68. Rest of Asia-Pacific Gas Insulated Switchgear Market, By Installation, 2022-2030(USD Billion)
69. Rest of Asia-Pacific Gas Insulated Switchgear Market, By End User, 2022-2030(USD Billion)
70. South America Gas Insulated Switchgear Market, By Insulation Type, 2022-2030(USD Billion)
71. South America Gas Insulated Switchgear Market, By Installation, 2022-2030(USD Billion)
72. South America Gas Insulated Switchgear Market, By End User, 2022-2030(USD Billion)
73. Brazil Gas Insulated Switchgear Market, By Insulation Type, 2022-2030(USD Billion)
74. Brazil Gas Insulated Switchgear Market, By Installation, 2022-2030(USD Billion)
75. Brazil Gas Insulated Switchgear Market, By End User, 2022-2030(USD Billion)
76. Argentina Gas Insulated Switchgear Market, By Insulation Type, 2022-2030(USD Billion)
77. Argentina Gas Insulated Switchgear Market, By Installation, 2022-2030(USD Billion)
78. Argentina Gas Insulated Switchgear Market, By End User, 2022-2030(USD Billion)
79. Rest of South America Gas Insulated Switchgear Market, By Insulation Type, 2022-2030(USD Billion)
80. Rest of South America Gas Insulated Switchgear Market, By Installation, 2022-2030(USD Billion)
81. Rest of South America Gas Insulated Switchgear Market, By End User, 2022-2030(USD Billion)
82. Middle East and Africa Gas Insulated Switchgear Market, By Insulation Type, 2022-2030(USD Billion)
83. Middle East and Africa Gas Insulated Switchgear Market, By Installation, 2022-2030(USD Billion)
84. Middle East and Africa Gas Insulated Switchgear Market, By End User, 2022-2030(USD Billion)
85. UAE Gas Insulated Switchgear Market, By Insulation Type, 2022-2030(USD Billion)
86. UAE Gas Insulated Switchgear Market, By Installation, 2022-2030(USD Billion)
87. UAE Gas Insulated Switchgear Market, By End User, 2022-2030(USD Billion)
88. South Africa Gas Insulated Switchgear Market, By Insulation Type, 2022-2030(USD Billion)
89. South Africa Gas Insulated Switchgear Market, By Installation, 2022-2030(USD Billion)
90. South Africa Gas Insulated Switchgear Market, By End User, 2022-2030(USD Billion)
91. Saudi Arabia Gas Insulated Switchgear Market, By Insulation Type, 2022-2030(USD Billion)
92. Saudi Arabia Gas Insulated Switchgear Market, By Installation, 2022-2030(USD Billion)
93. Saudi Arabia Gas Insulated Switchgear Market, By End User, 2022-2030(USD Billion)
94. Rest of Middle East & Africa Gas Insulated Switchgear Market, By Insulation Type, 2022-2030(USD Billion)
95. Rest of Middle East & Africa Gas Insulated Switchgear Market, By Installation, 2022-2030(USD Billion)
96. Rest of Middle East & Africa Gas Insulated Switchgear Market, By End User, 2022-2030(USD Billion)
List of Figures
1. Global Gas Insulated Switchgear Market Segmentation
2. Gas Insulated Switchgear Market: Research Methodology
3. Market Size Estimation Methodology: Bottom-Up Approach
4. Market Size Estimation Methodology: Top-Down Approach
5. Data Triangulation
6. Porter’s Five Forces Analysis
7. Value Chain Analysis
8. Global Gas Insulated Switchgear Market Attractiveness Analysis By Insulation Type
9. Global Gas Insulated Switchgear Market Attractiveness Analysis By Installation
10. Global Gas Insulated Switchgear Market Attractiveness Analysis By End User
11. Global Gas Insulated Switchgear Market Attractiveness Analysis By Region
12. Global Gas Insulated Switchgear Market: Dynamics
13. Global Gas Insulated Switchgear Market Share By Insulation Type(2022 & 2030)
14. Global Gas Insulated Switchgear Market Share By Installation(2022 & 2030)
15. Global Gas Insulated Switchgear Market Share By End User(2022 & 2030)
16. Global Gas Insulated Switchgear Market Share by Regions (2022 & 2030)
17. Global Gas Insulated Switchgear Market Share by Company (2021)
By Insulation type
By Installation
By End User
By Region/Geography
Research has its special purpose to undertake marketing efficiently. In this competitive scenario, businesses need information across all industry verticals; the information about customer wants, market demand, competition, industry trends, distribution channels etc. This information needs to be updated regularly because businesses operate in a dynamic environment. Our organization, The Brainy Insights incorporates scientific and systematic research procedures in order to get proper market insights and industry analysis for overall business success. The analysis consists of studying the market from a miniscule level wherein we implement statistical tools which helps us in examining the data with accuracy and precision.
Our research reports feature both; quantitative and qualitative aspects for any market. Qualitative information for any market research process are fundamental because they reveal the customer needs and wants, usage and consumption for any product/service related to a specific industry. This in turn aids the marketers/investors in knowing certain perceptions of the customers. Qualitative research can enlighten about the different product concepts and designs along with unique service offering that in turn, helps define marketing problems and generate opportunities. On the other hand, quantitative research engages with the data collection process through interviews, e-mail interactions, surveys and pilot studies. Quantitative aspects for the market research are useful to validate the hypotheses generated during qualitative research method, explore empirical patterns in the data with the help of statistical tools, and finally make the market estimations.
The Brainy Insights offers comprehensive research and analysis, based on a wide assortment of factual insights gained through interviews with CXOs and global experts and secondary data from reliable sources. Our analysts and industry specialist assume vital roles in building up statistical tools and analysis models, which are used to analyse the data and arrive at accurate insights with exceedingly informative research discoveries. The data provided by our organization have proven precious to a diverse range of companies, facilitating them to address issues such as determining which products/services are the most appealing, whether or not customers use the product in the manner anticipated, the purchasing intentions of the market and many others.
Our research methodology encompasses an idyllic combination of primary and secondary initiatives. Key phases involved in this process are listed below:

The phase involves the gathering and collecting of market data and its related information with the help of different sources & research procedures.

The data procurement stage involves in data gathering and collecting through various data sources.
This stage involves in extensive research. These data sources includes:
Purchased Database: Purchased databases play a crucial role in estimating the market sizes irrespective of the domain. Our purchased database includes:
Primary Research: The Brainy Insights interacts with leading companies and experts of the concerned domain to develop the analyst team’s market understanding and expertise. It improves and substantiates every single data presented in the market reports. Primary research mainly involves in telephonic interviews, E-mail interactions and face-to-face interviews with the raw material providers, manufacturers/producers, distributors, & independent consultants. The interviews that we conduct provides valuable data on market size and industry growth trends prevailing in the market. Our organization also conducts surveys with the various industry experts in order to gain overall insights of the industry/market. For instance, in healthcare industry we conduct surveys with the pharmacists, doctors, surgeons and nurses in order to gain insights and key information of a medical product/device/equipment which the customers are going to usage. Surveys are conducted in the form of questionnaire designed by our own analyst team. Surveys plays an important role in primary research because surveys helps us to identify the key target audiences of the market. Additionally, surveys helps to identify the key target audience engaged with the market. Our survey team conducts the survey by targeting the key audience, thus gaining insights from them. Based on the perspectives of the customers, this information is utilized to formulate market strategies. Moreover, market surveys helps us to understand the current competitive situation of the industry. To be precise, our survey process typically involve with the 360 analysis of the market. This analytical process begins by identifying the prospective customers for a product or service related to the market/industry to obtain data on how a product/service could fit into customers’ lives.

Secondary Research: The secondary data sources includes information published by the on-profit organizations such as World bank, WHO, company fillings, investor presentations, annual reports, national government documents, statistical databases, blogs, articles, white papers and others. From the annual report, we analyse a company’s revenue to understand the key segment and market share of that organization in a particular region. We analyse the company websites and adopt the product mapping technique which is important for deriving the segment revenue. In the product mapping method, we select and categorize the products offered by the companies catering to domain specific market, deduce the product revenue for each of the companies so as to get overall estimation of the market size. We also source data and analyses trends based on information received from supply side and demand side intermediaries in the value chain. The supply side denotes the data gathered from supplier, distributor, wholesaler and the demand side illustrates the data gathered from the end customers for respective market domain.

The supply side for a domain specific market is analysed by:
The demand side for the market is estimated through:
In-house Library: Apart from these third-party sources, we have our in-house library of qualitative and quantitative information. Our in-house database includes market data for various industry and domains. These data are updated on regular basis as per the changing market scenario. Our library includes, historic databases, internal audit reports and archives.
Sometimes there are instances where there is no metadata or raw data available for any domain specific market. For those cases, we use our expertise to forecast and estimate the market size in order to generate comprehensive data sets. Our analyst team adopt a robust research technique in order to produce the estimates:
Data Synthesis: This stage involves the analysis & mapping of all the information obtained from the previous step. It also involves in scrutinizing the data for any discrepancy observed while data gathering related to the market. The data is collected with consideration to the heterogeneity of sources. Robust scientific techniques are in place for synthesizing disparate data sets and provide the essential contextual information that can orient market strategies. The Brainy Insights has extensive experience in data synthesis where the data passes through various stages:


Market Deduction & Formulation: The final stage comprises of assigning data points at appropriate market spaces so as to deduce feasible conclusions. Analyst perspective & subject matter expert based holistic form of market sizing coupled with industry analysis also plays a crucial role in this stage.
This stage involves in finalization of the market size and numbers that we have collected from data integration step. With data interpolation, it is made sure that there is no gap in the market data. Successful trend analysis is done by our analysts using extrapolation techniques, which provide the best possible forecasts for the market.
Data Validation & Market Feedback: Validation is the most important step in the process. Validation & re-validation via an intricately designed process helps us finalize data-points to be used for final calculations.

The Brainy Insights interacts with leading companies and experts of the concerned domain to develop the analyst team’s market understanding and expertise. It improves and substantiates every single data presented in the market reports. The data validation interview and discussion panels are typically composed of the most experienced industry members. The participants include, however, are not limited to:
Moreover, we always validate our data and findings through primary respondents from all the major regions we are working on.


Free Customization
Fortune 500 Clients
Free Yearly Update On Purchase Of Multi/Corporate License
Companies Served Till Date