- +1-315-215-1633
- sales@thebrainyinsights.com

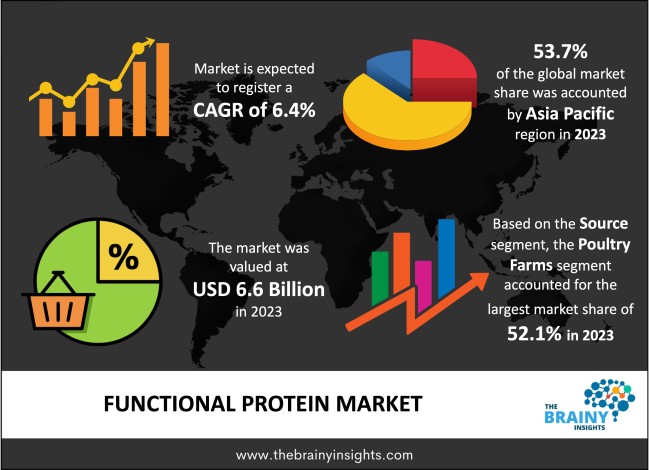
The Functional Protein Market was valued at USD 6.6 billion in 2023 and grew at a CAGR of 6.4% from 2024 to 2033. Consumer tastes are evolving toward adopting healthier eating habits and dietary supplements to prevent the onset of chronic ailments. These shifts are being caused by a combination of unhealthy habits, busy schedules, and the rise in chronic diseases like obesity and diabetes. As a result, people are consuming more functional proteins in their diets. The need for functional proteins is also being driven by the persistent economic growth of nations and the increasing average income of the millennial generation since customers can now afford to buy more expensive functional food products due to their greater disposable income.
A growing segment of the food and nutrition business, the functional protein market is centered on proteins that offer additional health advantages over and above the requirements of basic nutrition. These proteins are used in a variety of industries, including food and drink, and animal nutrition. They are well-known for their bioactive qualities. The growing demand from consumers for goods that not only offer vital nutrients but also enhance general health and well-being has prompted the development of functional proteins.
Growing knowledge about the connection between nutrition and health has made customers look for functional benefits, such as enhanced immunity, stronger muscles, and general wellbeing. Functional proteins fit well with these health-conscious consumer trends. Additionally, the growing fitness and sports nutrition market has raised consumer demand for items high in protein. Consumers seeking to enhance muscle growth and recovery are drawn to functional proteins, particularly those sourced from plant-based sources, whey, and collagen.
Producing certain functional proteins can be costly, particularly if they have particular bioactive characteristics. Elevated production costs could lead to higher prices for functional protein products, which would restrict their availability to specific customer groups. It can be difficult to add functional proteins to food products without detracting from their flavor and texture. If a product's flavor or mouthfeel bothers consumers, they might be discouraged from buying it.
Investigating and implementing new sources of protein, such as algae, insects, and substitute plant-based proteins, can accommodate a range of customer tastes and nutritional needs. Furthermore, the emergence of personalized nutrition has prospects for the creation of functional protein products customized to meet specific health requirements, genetic compositions, or lifestyle choices.
Asia Pacific led the market in 2023 with the largest market share of 53.7%. Changes in food trends have been attributed to economic expansion, urbanization, and an increase in disposable income in several Asia-Pacific countries. Growing in wealth tends to focus consumers' attention on better food options, such as functional protein-added goods. The Asia-Pacific food and beverage industry is experiencing a surge in innovation concerning functional items. Businesses are adding functional proteins to a range of food and drink products, including dairy substitutes, snacks, and drinks with added protein.
Asia Pacific Region Floating Farms Market Share in 2023 - 53.7%
www.thebrainyinsights.com
Check the geographical analysis of this market by requesting a free sample
The Poultry farms segment dominated the global market in 2023 with a market share of 52.1%. Since animal sources are often seen as dependable sources of protein, the market for them has grown significantly. Animal protein is utilized as an element in dietary supplements and has been shown to have favorable health effects. Dairy, eggs, and gelatin are the main categories of proteins derived from animal sources.
The Functional Food and Beverages segment dominated the global market in 2023 with a market share of 53.8%. Applications for functional proteins in functional food and beverage applications include baked goods, bars, drinks, culinary applications, frozen desserts, baby food, meats, sauces, pet food, snacks, bakery, cereals for breakfast, dairy substitutes, protein bars, general protein fortification, poultry, seafood, meatless options, beverages, savory meals, burgers & meat products, loosely chopped meat, blended and restructured products, ice cream, and seasoning &savory applications. Foods with functional ingredients are widely employed in the food and beverage industry to improve the texture, taste, and flavor of products because of their many uses.
The Offline segment dominated the global market in 2023 with a market share of 66.7%. Functional protein products are mostly sold through health food stores, supplement stores, and specialist nutrition stores. Protein powders, bars, and shakes are among the many nutritional supplements that these shops frequently stock. These establishments are frequently frequented by customers looking for particular health and wellness products since they offer curated selections of functional proteins and individualized guidance. Products containing functional protein are frequently available in supermarkets and hypermarkets' health and wellness departments. These massive retail chains provide a wide selection of food and drink goods, including ones that are higher in protein. In addition to standard grocery goods, supermarkets offer a range of functional protein sources, making them a handy one-stop shop for customers.
| Attribute | Description |
|---|---|
| Market Size | Revenue (USD Billion) |
| Market size value in 2023 | USD 6.6 Billion |
| Market size value in 2033 | USD 11.5 Billion |
| CAGR (2024 to 2033) | 6.4% |
| Historical data | 2020-2022 |
| Base Year | 2023 |
| Forecast | 2024-2033 |
| Region | The regions analyzed for the market are Asia Pacific, Europe, South America, North America, and Middle East & Africa. Furthermore, the regions are further analyzed at the country level. |
| Segments | Source, Application, Distribution Channel |
As per The Brainy Insights, the size of the functional protein Market was valued at USD 6.6 billion in 2023 to USD 11.5 billion by 2033.
The global functional protein market is growing at a CAGR of 6.4% during the forecast period 2024-2033.
The Asia Pacific region emerged as the largest market for the functional protein.
The growing demand for health and wellness products will influence the market's growth.
1. Introduction
1.1. Objectives of the Study
1.2. Market Definition
1.3. Research Scope
1.4. Currency
1.5. Key Target Audience
2. Research Methodology and Assumptions
3. Executive Summary
4. Premium Insights
4.1. Porter’s Five Forces Analysis
4.2. Value Chain Analysis
4.3. Top Investment Pockets
4.3.1. Market Attractiveness Analysis by Source
4.3.2. Market Attractiveness Analysis by Application
4.3.3. Market Attractiveness Analysis by Distribution Channel
4.3.4. Market Attractiveness Analysis by Region
4.4. Industry Trends
5. Market Dynamics
5.1. Market Evaluation
5.2. Drivers
5.2.1. Growing Demand for Health and Wellness Products
5.3. Restraints
5.3.1. High Production Costs
5.4. Opportunities
5.4.1. Innovations in Protein Ingredients
5.5. Challenges
5.5.1. Taste and Texture Challenges
6. Global Functional Protein Market Analysis and Forecast, By Source
6.1. Segment Overview
6.2. Animal
6.3. Plant
7. Global Functional Protein Market Analysis and Forecast, By Application
7.1. Segment Overview
7.2. Functional Food & Beverages
7.3. Dietary Supplements
7.4. Animal Nutrition
7.5. Sports Nutrition
8. Global Functional Protein Market Analysis and Forecast, By Distribution Channel
8.1. Segment Overview
8.2. Online
8.3. Offline
9. Global Functional Protein Market Analysis and Forecast, By Regional Analysis
9.1. Segment Overview
9.2. North America
9.2.1. U.S.
9.2.2. Canada
9.2.3. Mexico
9.3. Europe
9.3.1. Germany
9.3.2. France
9.3.3. U.K.
9.3.4. Italy
9.3.5. Spain
9.4. Asia-Pacific
9.4.1. Japan
9.4.2. China
9.4.3. India
9.5. South America
9.5.1. Brazil
9.6. Middle East and Africa
9.6.1. UAE
9.6.2. South Africa
10. Global Functional Protein Market-Competitive Landscape
10.1. Overview
10.2. Market Share of Key Players in the Functional Protein Market
10.2.1. Global Company Market Share
10.2.2. North America Company Market Share
10.2.3. Europe Company Market Share
10.2.4. APAC Company Market Share
10.3. Competitive Situations and Trends
10.3.1. Product Launches and Developments
10.3.2. Partnerships, Collaborations, and Agreements
10.3.3. Mergers & Acquisitions
10.3.4. Expansions
11. Company Profiles
11.1. Archer Daniels Midland Company (ADM)
11.1.1. Business Overview
11.1.2. Company Snapshot
11.1.3. Company Market Share Analysis
11.1.4. Company Product Portfolio
11.1.5. Recent Developments
11.1.6. SWOT Analysis
11.2. Cargill, Incorporated
11.2.1. Business Overview
11.2.2. Company Snapshot
11.2.3. Company Market Share Analysis
11.2.4. Company Product Portfolio
11.2.5. Recent Developments
11.2.6. SWOT Analysis
11.3. DuPont Nutrition & Biosciences
11.3.1. Business Overview
11.3.2. Company Snapshot
11.3.3. Company Market Share Analysis
11.3.4. Company Product Portfolio
11.3.5. Recent Developments
11.3.6. SWOT Analysis
11.4. Kerry Group plc
11.4.1. Business Overview
11.4.2. Company Snapshot
11.4.3. Company Market Share Analysis
11.4.4. Company Product Portfolio
11.4.5. Recent Developments
11.4.6. SWOT Analysis
11.5. Ingredion Incorporated
11.5.1. Business Overview
11.5.2. Company Snapshot
11.5.3. Company Market Share Analysis
11.5.4. Company Product Portfolio
11.5.5. Recent Developments
11.5.6. SWOT Analysis
11.6. Fonterra Co-operative Group Limited
11.6.1. Business Overview
11.6.2. Company Snapshot
11.6.3. Company Market Share Analysis
11.6.4. Company Product Portfolio
11.6.5. Recent Developments
11.6.6. SWOT Analysis
11.7. Glanbia plc
11.7.1. Business Overview
11.7.2. Company Snapshot
11.7.3. Company Market Share Analysis
11.7.4. Company Product Portfolio
11.7.5. Recent Developments
11.7.6. SWOT Analysis
11.8. Arla Foods Ingredients Group P/S
11.8.1. Business Overview
11.8.2. Company Snapshot
11.8.3. Company Market Share Analysis
11.8.4. Company Product Portfolio
11.8.5. Recent Developments
11.8.6. SWOT Analysis
11.9. Roquette Fréres
11.9.1. Business Overview
11.9.2. Company Snapshot
11.9.3. Company Market Share Analysis
11.9.4. Company Product Portfolio
11.9.5. Recent Developments
11.9.6. SWOT Analysis
11.10. Tate & Lyle PLC
11.10.1. Business Overview
11.10.2. Company Snapshot
11.10.3. Company Market Share Analysis
11.10.4. Company Product Portfolio
11.10.5. Recent Developments
11.10.6. SWOT Analysis
11.11. Royal DSM N.V.
11.11.1. Business Overview
11.11.2. Company Snapshot
11.11.3. Company Market Share Analysis
11.11.4. Company Product Portfolio
11.11.5. Recent Developments
11.11.6. SWOT Analysis
11.12. Givaudan SA
11.12.1. Business Overview
11.12.2. Company Snapshot
11.12.3. Company Market Share Analysis
11.12.4. Company Product Portfolio
11.12.5. Recent Developments
11.12.6. SWOT Analysis
11.13. Novozymes A/S
11.13.1. Business Overview
11.13.2. Company Snapshot
11.13.3. Company Market Share Analysis
11.13.4. Company Product Portfolio
11.13.5. Recent Developments
11.13.6. SWOT Analysis
11.14. Corbion NM.
11.14.1. Business Overview
11.14.2. Company Snapshot
11.14.3. Company Market Share Analysis
11.14.4. Company Product Portfolio
11.14.5. Recent Developments
11.14.6. SWOT Analysis
11.15. Sigma-Aldrich Corporation (now part of Merck KGaA)
11.15.1. Business Overview
11.15.2. Company Snapshot
11.15.3. Company Market Share Analysis
11.15.4. Company Product Portfolio
11.15.5. Recent Developments
11.15.6. SWOT Analysis
List of Table
1. Global Functional Protein Market, By Source, 2020-2033 (USD Billion)
2. Global Animal Functional Protein Market, By Region, 2020-2033 (USD Billion)
3. Global Plant Functional Protein Market, By Region, 2020-2033 (USD Billion)
4. Global Functional Protein Market, By Application, 2020-2033 (USD Billion)
5. Global Functional Food & Beverages Functional Protein Market, By Region, 2020-2033 (USD Billion)
6. Global Dietary Supplements Functional Protein Market, By Region, 2020-2033 (USD Billion)
7. Global Animal Nutrition Functional Protein Market, By Region, 2020-2033 (USD Billion)
8. Global Sports Nutrition Functional Protein Market, By Region, 2020-2033 (USD Billion)
9. Global Functional Protein Market, By Distribution Channel, 2020-2033 (USD Billion)
10. Global Online Functional Protein Market, By Region, 2020-2033 (USD Billion)
11. Global Offline Functional Protein Market, By Region, 2020-2033 (USD Billion)
12. Global Functional Protein Market, By Region, 2020-2033 (USD Billion)
13. North America Functional Protein Market, By Source, 2020-2033 (USD Billion)
14. North America Functional Protein Market, By Application, 2020-2033 (USD Billion)
15. North America Functional Protein Market, By Distribution Channel, 2020-2033 (USD Billion)
16. U.S. Functional Protein Market, By Source, 2020-2033 (USD Billion)
17. U.S. Functional Protein Market, By Application, 2020-2033 (USD Billion)
18. U.S. Functional Protein Market, By Distribution Channel, 2020-2033 (USD Billion)
19. Canada Functional Protein Market, By Source, 2020-2033 (USD Billion)
20. Canada Functional Protein Market, By Application, 2020-2033 (USD Billion)
21. Canada Functional Protein Market, By Distribution Channel, 2020-2033 (USD Billion)
22. Mexico Functional Protein Market, By Source, 2020-2033 (USD Billion)
23. Mexico Functional Protein Market, By Application, 2020-2033 (USD Billion)
24. Mexico Functional Protein Market, By Distribution Channel, 2020-2033 (USD Billion)
25. Europe Functional Protein Market, By Source, 2020-2033 (USD Billion)
26. Europe Functional Protein Market, By Application, 2020-2033 (USD Billion)
27. Europe Functional Protein Market, By Distribution Channel, 2020-2033 (USD Billion)
28. Germany Functional Protein Market, By Source, 2020-2033 (USD Billion)
29. Germany Functional Protein Market, By Application, 2020-2033 (USD Billion)
30. Germany Functional Protein Market, By Distribution Channel, 2020-2033 (USD Billion)
31. France Functional Protein Market, By Source, 2020-2033 (USD Billion)
32. France Functional Protein Market, By Application, 2020-2033 (USD Billion)
33. France Functional Protein Market, By Distribution Channel, 2020-2033 (USD Billion)
34. U.K. Functional Protein Market, By Source, 2020-2033 (USD Billion)
35. U.K. Functional Protein Market, By Application, 2020-2033 (USD Billion)
36. U.K. Functional Protein Market, By Distribution Channel, 2020-2033 (USD Billion)
37. Italy Functional Protein Market, By Source, 2020-2033 (USD Billion)
38. Italy Functional Protein Market, By Application, 2020-2033 (USD Billion)
39. Italy Functional Protein Market, By Distribution Channel, 2020-2033 (USD Billion)
40. Spain Functional Protein Market, By Source, 2020-2033 (USD Billion)
41. Spain Functional Protein Market, By Application, 2020-2033 (USD Billion)
42. Spain Functional Protein Market, By Distribution Channel, 2020-2033 (USD Billion)
43. Asia Pacific Functional Protein Market, By Source, 2020-2033 (USD Billion)
44. Asia Pacific Functional Protein Market, By Application, 2020-2033 (USD Billion)
45. Asia Pacific Functional Protein Market, By Distribution Channel, 2020-2033 (USD Billion)
46. Japan Functional Protein Market, By Source, 2020-2033 (USD Billion)
47. Japan Functional Protein Market, By Application, 2020-2033 (USD Billion)
48. Japan Functional Protein Market, By Distribution Channel, 2020-2033 (USD Billion)
49. China Functional Protein Market, By Source, 2020-2033 (USD Billion)
50. China Functional Protein Market, By Application, 2020-2033 (USD Billion)
51. China Functional Protein Market, By Distribution Channel, 2020-2033 (USD Billion)
52. India Functional Protein Market, By Source, 2020-2033 (USD Billion)
53. India Functional Protein Market, By Application, 2020-2033 (USD Billion)
54. India Functional Protein Market, By Distribution Channel, 2020-2033 (USD Billion)
55. South America Functional Protein Market, By Source, 2020-2033 (USD Billion)
56. South America Functional Protein Market, By Application, 2020-2033 (USD Billion)
57. South America Functional Protein Market, By Distribution Channel, 2020-2033 (USD Billion)
58. Brazil Functional Protein Market, By Source, 2020-2033 (USD Billion)
59. Brazil Functional Protein Market, By Application, 2020-2033 (USD Billion)
60. Brazil Functional Protein Market, By Distribution Channel, 2020-2033 (USD Billion)
61. Middle East and Africa Functional Protein Market, By Source, 2020-2033 (USD Billion)
62. Middle East and Africa Functional Protein Market, By Application, 2020-2033 (USD Billion)
63. Middle East and Africa Functional Protein Market, By Distribution Channel, 2020-2033 (USD Billion)
64. UAE Functional Protein Market, By Source, 2020-2033 (USD Billion)
65. UAE Functional Protein Market, By Application, 2020-2033 (USD Billion)
66. UAE Functional Protein Market, By Distribution Channel, 2020-2033 (USD Billion)
67. South Africa Functional Protein Market, By Source, 2020-2033 (USD Billion)
68. South Africa Functional Protein Market, By Application, 2020-2033 (USD Billion)
69. South Africa Functional Protein Market, By Distribution Channel, 2020-2033 (USD Billion)
List of Figures
1. Global Functional Protein Market Segmentation
2. Functional Protein Market: Research Methodology
3. Market Size Estimation Methodology: Bottom-Up Approach
4. Market Size Estimation Methodology: Top-Down Approach
5. Data Triangulation
6. Porter’s Five Forces Analysis
7. Value Chain Analysis
8. Global Functional Protein Market Attractiveness Analysis by Source
9. Global Functional Protein Market Attractiveness Analysis by Application
10. Global Functional Protein Market Attractiveness Analysis by Distribution Channel
11. Global Functional Protein Market Attractiveness Analysis by Region
12. Global Functional Protein Market: Dynamics
13. Global Functional Protein Market Share by Source (2023 & 2033)
14. Global Functional Protein Market Share by Application (2023 & 2033)
15. Global Functional Protein Market Share by Distribution Channel (2023 & 2033)
16. Global Functional Protein Market Share by Regions (2023 & 2033)
17. Global Functional Protein Market Share by Company (2023)
This study forecasts revenue at global, regional, and country levels from 2020 to 2033. The Brainy Insights has segmented the global functional protein market based on below-mentioned segments:
Global Functional Protein Market by Source:
Global Functional Protein Market by Application:
Global Functional Protein Market by Distribution Channel:
Global Functional Protein Market by Region:
Research has its special purpose to undertake marketing efficiently. In this competitive scenario, businesses need information across all industry verticals; the information about customer wants, market demand, competition, industry trends, distribution channels etc. This information needs to be updated regularly because businesses operate in a dynamic environment. Our organization, The Brainy Insights incorporates scientific and systematic research procedures in order to get proper market insights and industry analysis for overall business success. The analysis consists of studying the market from a miniscule level wherein we implement statistical tools which helps us in examining the data with accuracy and precision.
Our research reports feature both; quantitative and qualitative aspects for any market. Qualitative information for any market research process are fundamental because they reveal the customer needs and wants, usage and consumption for any product/service related to a specific industry. This in turn aids the marketers/investors in knowing certain perceptions of the customers. Qualitative research can enlighten about the different product concepts and designs along with unique service offering that in turn, helps define marketing problems and generate opportunities. On the other hand, quantitative research engages with the data collection process through interviews, e-mail interactions, surveys and pilot studies. Quantitative aspects for the market research are useful to validate the hypotheses generated during qualitative research method, explore empirical patterns in the data with the help of statistical tools, and finally make the market estimations.
The Brainy Insights offers comprehensive research and analysis, based on a wide assortment of factual insights gained through interviews with CXOs and global experts and secondary data from reliable sources. Our analysts and industry specialist assume vital roles in building up statistical tools and analysis models, which are used to analyse the data and arrive at accurate insights with exceedingly informative research discoveries. The data provided by our organization have proven precious to a diverse range of companies, facilitating them to address issues such as determining which products/services are the most appealing, whether or not customers use the product in the manner anticipated, the purchasing intentions of the market and many others.
Our research methodology encompasses an idyllic combination of primary and secondary initiatives. Key phases involved in this process are listed below:

The phase involves the gathering and collecting of market data and its related information with the help of different sources & research procedures.

The data procurement stage involves in data gathering and collecting through various data sources.
This stage involves in extensive research. These data sources includes:
Purchased Database: Purchased databases play a crucial role in estimating the market sizes irrespective of the domain. Our purchased database includes:
Primary Research: The Brainy Insights interacts with leading companies and experts of the concerned domain to develop the analyst team’s market understanding and expertise. It improves and substantiates every single data presented in the market reports. Primary research mainly involves in telephonic interviews, E-mail interactions and face-to-face interviews with the raw material providers, manufacturers/producers, distributors, & independent consultants. The interviews that we conduct provides valuable data on market size and industry growth trends prevailing in the market. Our organization also conducts surveys with the various industry experts in order to gain overall insights of the industry/market. For instance, in healthcare industry we conduct surveys with the pharmacists, doctors, surgeons and nurses in order to gain insights and key information of a medical product/device/equipment which the customers are going to usage. Surveys are conducted in the form of questionnaire designed by our own analyst team. Surveys plays an important role in primary research because surveys helps us to identify the key target audiences of the market. Additionally, surveys helps to identify the key target audience engaged with the market. Our survey team conducts the survey by targeting the key audience, thus gaining insights from them. Based on the perspectives of the customers, this information is utilized to formulate market strategies. Moreover, market surveys helps us to understand the current competitive situation of the industry. To be precise, our survey process typically involve with the 360 analysis of the market. This analytical process begins by identifying the prospective customers for a product or service related to the market/industry to obtain data on how a product/service could fit into customers’ lives.

Secondary Research: The secondary data sources includes information published by the on-profit organizations such as World bank, WHO, company fillings, investor presentations, annual reports, national government documents, statistical databases, blogs, articles, white papers and others. From the annual report, we analyse a company’s revenue to understand the key segment and market share of that organization in a particular region. We analyse the company websites and adopt the product mapping technique which is important for deriving the segment revenue. In the product mapping method, we select and categorize the products offered by the companies catering to domain specific market, deduce the product revenue for each of the companies so as to get overall estimation of the market size. We also source data and analyses trends based on information received from supply side and demand side intermediaries in the value chain. The supply side denotes the data gathered from supplier, distributor, wholesaler and the demand side illustrates the data gathered from the end customers for respective market domain.

The supply side for a domain specific market is analysed by:
The demand side for the market is estimated through:
In-house Library: Apart from these third-party sources, we have our in-house library of qualitative and quantitative information. Our in-house database includes market data for various industry and domains. These data are updated on regular basis as per the changing market scenario. Our library includes, historic databases, internal audit reports and archives.
Sometimes there are instances where there is no metadata or raw data available for any domain specific market. For those cases, we use our expertise to forecast and estimate the market size in order to generate comprehensive data sets. Our analyst team adopt a robust research technique in order to produce the estimates:
Data Synthesis: This stage involves the analysis & mapping of all the information obtained from the previous step. It also involves in scrutinizing the data for any discrepancy observed while data gathering related to the market. The data is collected with consideration to the heterogeneity of sources. Robust scientific techniques are in place for synthesizing disparate data sets and provide the essential contextual information that can orient market strategies. The Brainy Insights has extensive experience in data synthesis where the data passes through various stages:


Market Deduction & Formulation: The final stage comprises of assigning data points at appropriate market spaces so as to deduce feasible conclusions. Analyst perspective & subject matter expert based holistic form of market sizing coupled with industry analysis also plays a crucial role in this stage.
This stage involves in finalization of the market size and numbers that we have collected from data integration step. With data interpolation, it is made sure that there is no gap in the market data. Successful trend analysis is done by our analysts using extrapolation techniques, which provide the best possible forecasts for the market.
Data Validation & Market Feedback: Validation is the most important step in the process. Validation & re-validation via an intricately designed process helps us finalize data-points to be used for final calculations.

The Brainy Insights interacts with leading companies and experts of the concerned domain to develop the analyst team’s market understanding and expertise. It improves and substantiates every single data presented in the market reports. The data validation interview and discussion panels are typically composed of the most experienced industry members. The participants include, however, are not limited to:
Moreover, we always validate our data and findings through primary respondents from all the major regions we are working on.


Free Customization
Fortune 500 Clients
Free Yearly Update On Purchase Of Multi/Corporate License
Companies Served Till Date