- +1-315-215-1633
- sales@thebrainyinsights.com

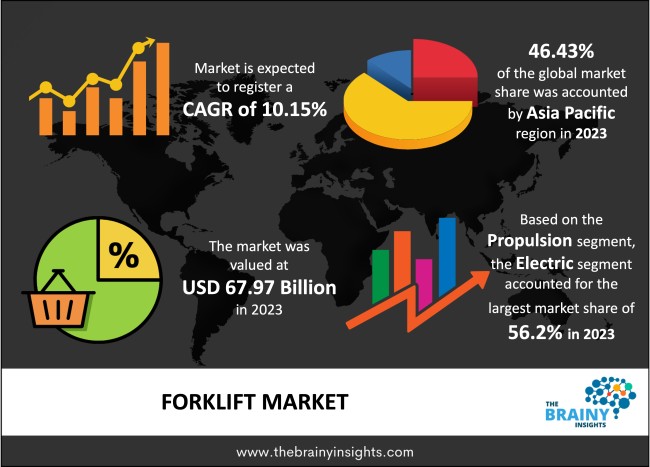
The global forklift market was valued at USD 67.97 billion in 2023, increasing at a CAGR of 10.15% from 2024 to 2033 and anticipated to reach USD 178.72 billion by 2033. North America is expected to grow the fastest during the forecast period. Forklifts are designed to various specifications to handle loads with different maximum weights & multiple centres of gravity. Attention to these specifications is required for safe usage. Forklifts are mainly utilized for material handling, lifting and stacking loads throughout the facility. These vehicles can be used with different attachments, such as grippers, clamps, and platforms, to move and handle numerous materials and loads. Forklifts primarily utilize two energy sources: electricity & combustion engine. They are commonly used in warehouses & distribution centres for lifting & transporting goods. They are among the prime tools for industrial automation.
The COVID-19 epidemic negatively influenced manufacturing, construction, and warehouse activities in 2020. The rapid spread of COVID-19 infections and the subsequent global lockdowns caused an unexpected downturn in manufacturing activities. Industrial activities worldwide were negatively affected by the COVID-19 pandemic. Widespread limitations on sales and value chains posed challenges for manufacturers aiming to expand their market reach. The closure of numerous global forklift production plants during lockdowns further compounded these difficulties, as both offline and online channels faced restrictions due to virus containment measures. Nevertheless, the market is expected to recover substantially within the upcoming years.
A forklift (also named lift truck, hi-lo, jitney, fork hoist, forklift truck, and fork truck) is a powered industrial truck utilized to lift and move materials over short distances. A forklift is a type of vehicle organized as a powered industrial truck. They are employed to move & lift different materials over short distances. A standard forklift is defined as a small truck frame with a front-facing mast assembly that is accountable for increasing & lowering the carried load. These mast assemblies ensure the variable-height carriages to which the forklift's eponymous load-bearing forks are mounted. Haulage trucks & earthmoving equipment altered to accept forks are not considered true forklifts. Each component is crucial to keep the functioning & operators safe while operating a forklift. These parts vary depending on the model. The truck frame makes up the base of the forklift. The truck frame has the rest of the vehicle's key components, including the mast, wheels, and counterweight. Serving as the forklift's base, the carriage is attached to the mast rails for ease of moving downward & upward. The forklift operator moves the handle to signal the forklift to pump excess air into the cylinders. Forklifts have been instrumental in unloading & stacking barges and ships way back in the global wars. Forklifts are also valuable for recycling operations. They are utilized for unloading recycling containers or trucks before their loads are transported to the sorting bays. Forklift trucks are preferred in these operations because they can efficiently unload/load tractor-trailers, railway cars, elevators, and straight trucks.
Get an overview of this study by requesting a free sample
For example, in May 2021, Mitsubishi Logisnext Americas Group partnered with Phantom Auto Partners, a foremost provider of interoperable remote operation software, to scale up the remote process.
The growing e-commerce industry: The growth of the e-commerce sector and the growing focus on enhancing the security & safety of workers in the logistics industry are propelling the market growth. Further, the increasing number of e-commerce, online shopping orders, and logistics firms are focusing on increasing operational efficiency by deploying such vehicles. Also, the expanding customer base and changing purchasing patterns and customer expectations are helping to stimulate market growth. Moreover, the technological awareness among customers and the adoption of smartphones is gaining momentum significantly, and the increasing internet penetration is helping to promote market growth during the forecast period. Furthermore, the third-party logistics companies that manage warehouses of e-commerce participants are increasingly utilizing forklift trucks for material handling operations. These factors are helping to boost market growth.
A high cost of forklift trucks: The forklift trucks are made of different kinds of raw materials such as stainless steel, hardened steel, cast iron, aluminium, brass, bronze, and other metal alloys. The prices of these raw materials are increasing because of inflation and the non-availability of these materials. This leads to an increase in the production cost of the equipment. This is the restraining factor of the market. Furthermore, the lack of efficient transport infrastructure in underdeveloped and developing economies also hampers the market growth.
The increase in demand for battery-operated forklifts: The rise in demand for ease of movement and organization of goods is the opportunity factor for market growth. Further, the increasing adoption of solar-based forklift batteries with sustainable power storage systems propels the market growth. Additionally, the rising demand for forklift trucks to lift heavy objects in the manufacturing & construction industries is anticipated to drive market growth during the forecast period.
The regions analyzed for the market include Europe, South America, Asia Pacific, North America, the Middle East, and Africa. The Asia Pacific emerged as the largest market for the global forklift market, with a 46.43% share of the market revenue in 2023. The Asia Pacific dominates the forklift market due to the increasing inclination of manufacturers toward plant automation. Moreover, the increasing R&D investment for developing new automotive types, the favourable economic environment, and the need for technological advancements in in-house logistics are also helping to boost the market growth in this region. Additionally, the presence of several automotive manufacturers and changing consumption patterns are driving market growth in this region. North America is expected to grow the fastest during the forecast period due to the bulk investments in purchasing low-cost forklift trucks in emerging markets. Furthermore, the rapid industrialization in underdeveloped countries, increasing joint ventures among various vital participants, the local manufacturers, and the surging popularity of the warehousing concept is helping to propel the market growth during the forecast period. Also, the rising demands for manufacturing facilities, material handling & logistics, and the growing export activities are anticipated to drive market growth in this region.
Asia-Pacific Region Forklift Market Share in 2023 - 46.43%
www.thebrainyinsights.com
Check the geographical analysis of this market by requesting a free sample
The propulsion segment is divided into internal combustion engine and electric. The electric segment dominated, with a market share of around 56.2% in 2023. This growth is attributed to the ever-increasing popularity of electric forklifts among chemical manufacturers & recycling centre owners. Also, the raised demand for operational efficiency and strict rules for reducing carbon emissions are helping to boost the segment's market growth. Further, by 2030, the internal combustion engine segment will likely dominate the market due to the increasing popularity of vehicles using gasoline. Additionally, electric power trains are increasingly being united with internal combustion engines (ICE) to enhance vehicle fuel economy, which is also helping to boost the market growth.
The class segment is divided into class 1, class 2, class 3, and class 4/5. In 2023, the class 2 segment dominated the market with the largest market share of 28.3% and market revenue of USD 19.24 billion. This growth is attributed to the increasing number of storage facilities & warehouses. Class 2 forklifts are electric, narrow aisle models. Moreover, the class 2 forklifts are designed with manoeuvrability that permits them to operate in tight spaces & narrow aisles. Further, by 2030, the class 3 segment will likely dominate the market due to the increasing demand from small and medium-sized warehouses for unloading & loading materials.
The tire type segment is divided into pneumatic and cushion. In 2023, the pneumatic segment dominated the market with the largest market share of 58.28% and market revenue of USD 39.61 billion. This growth is attributed to the ever-increasing demand from the automotive industry and rising government spending.
The battery type segment is divided into lithium-ion and lead-acid. In 2023, the lithium-ion segment dominated the market, accounting for around 57.2% of global revenue. This growth is attributed to the battery type's integrated attributes like maximum productivity & lifespan. Moreover, lithium-ion batteries are also utilized to provide a backup power supply for data centres, commercial buildings, and institutions.
The industry segment is divided into food and beverage, automotive, 3PL, paper and pulp, metals and heavy machinery, e-commerce, semiconductors and electronics, healthcare, chemical, and others. In 2023, e-commerce dominated the market, accounting for around 19.28% of global revenue. This growth is attributed to the increasing adoption of smartphones worldwide.
| Attribute | Description |
|---|---|
| Market Size | Revenue (USD Billion) |
| Market size value in 2023 | USD 67.97 Billion, Volume in units |
| Market size value in 2033 | USD 178.72 Billion, Volume in units |
| CAGR (2024 to 2033) | 10.15% |
| Historical data | 2020-2022 |
| Base Year | 2023 |
| Forecast | 2024-2033 |
| Region | The key regions are North America, South America, Europe, Asia Pacific, and Middle East & Africa. |
| Segments | Key Segments are propulsion, class, tire type, battery type, industry, and regions |
Asia Pacific region emerged as the largest market for the forklift. The Asia Pacific region held a market share of 46.43% in 2023.
The market's growth will be influenced by the growing e-commerce industry.
A high cost of forklift trucks could hamper the market growth.
The increase in demand for battery-operated forklifts will provide huge opportunities to the market.
Key players CLARK, Anhui Heli Co., Doosan Corporation, Crown Equipment Corporation, Hyster-Yale Materials Handling, Inc., KION Group AG, Hangcha, Komatsu Ltd., Toyota Material Handling, Mitsubishi Logisnext Co., Ltd., Jungheinrich AG, and among others.
1. Introduction
1.1. Objectives of the Study
1.2. Market Definition
1.3. Research Scope
1.4. Currency
1.5. Key Target Audience
2. Research Methodology and Assumptions
3. Executive Summary
4. Premium Insights
4.1. Porter’s Five Forces Analysis
4.2. Value Chain Analysis
4.3. Top Investment Pockets
4.3.1. Market Attractiveness Analysis By Propulsion
4.3.2. Market Attractiveness Analysis By Class
4.3.3. Market Attractiveness Analysis By Tire Type
4.3.4. Market Attractiveness Analysis By Battery Type
4.3.5. Market Attractiveness Analysis By Industry
4.3.6. Market Attractiveness Analysis By Region
4.4. Industry Trends
5. Market Dynamics
5.1. Market Evaluation
5.2. Drivers
5.2.1. The growing e-commerce industry
5.2.2. An inclination for IC-engine forklift trucks
5.3. Restraints
5.3.1. A high cost of forklift trucks
5.3.2. The lack of trained operators
5.4. Opportunities
5.4.1. The increase in demand for battery-operated forklifts
1. Global Forklift Market Analysis and Forecast, By Propulsion
1.1. Segment Overview
1.2. Internal Combustion Engine
1.3. Electric
2. Global Forklift Market Analysis and Forecast, By Class
2.1. Segment Overview
2.2. Class 1
2.3. Class 2
2.4. Class 3
2.5. Class 4/5
3. Global Forklift Market Analysis and Forecast, By Tire Type
3.1. Segment Overview
3.2. Pneumatic
3.3. Cushion
4. Global Forklift Market Analysis and Forecast, By Battery Type
4.1. Segment Overview
4.2. Lithium-Ion
4.3. Lead-Acid
5. Global Forklift Market Analysis and Forecast, By Industry
5.5. Segment Overview
5.6. Food and Beverage
5.7. Automotive
5.8. 3PL
5.9. Paper and Pulp
5.10. Metals and Heavy Machinery
5.11. E-Commerce
5.12. Semiconductors and Electronics
5.13. Healthcare
5.14. Chemical
5.15. Others
6. Global Forklift Market Analysis and Forecast, By Regional Analysis
6.1. Segment Overview
6.2. North America
6.2.1. U.S.
6.2.2. Canada
6.2.3. Mexico
6.3. Europe
6.3.1. Germany
6.3.2. France
6.3.3. U.K.
6.3.4. Italy
6.3.5. Spain
6.4. Asia-Pacific
6.4.1. Japan
6.4.2. China
6.4.3. India
6.5. South America
6.5.1. Brazil
6.6. Middle East and Africa
6.6.1. UAE
6.6.2. South Africa
7. Global Forklift Market-Competitive Landscape
7.1. Overview
7.2. Market Share of Key Players in Global Forklift Market
7.2.1. Global Company Market Share
7.2.2. North America Company Market Share
7.2.3. Europe Company Market Share
7.2.4. APAC Company Market Share
7.3. Competitive Situations and Trends
7.3.1. Product Launches and Developments
7.3.2. Partnerships, Collaborations, and Agreements
7.3.3. Mergers & Acquisitions
7.3.4. Expansions
8. Company Profiles
8.1. CLARK
8.1.1. Business Overview
8.1.2. Company Snapshot
8.1.3. Company Market Share Analysis
8.1.4. Company Product Portfolio
8.1.5. Recent Developments
8.1.6. SWOT Analysis
8.2. Anhui Heli Co.
8.2.1. Business Overview
8.2.2. Company Snapshot
8.2.3. Company Market Share Analysis
8.2.4. Company Product Portfolio
8.2.5. Recent Developments
8.2.6. SWOT Analysis
8.3. Doosan Corporation
8.3.1. Business Overview
8.3.2. Company Snapshot
8.3.3. Company Market Share Analysis
8.3.4. Company Product Portfolio
8.3.5. Recent Developments
8.3.6. SWOT Analysis
8.4. Crown Equipment Corporation
8.4.1. Business Overview
8.4.2. Company Snapshot
8.4.3. Company Market Share Analysis
8.4.4. Company Product Portfolio
8.4.5. Recent Developments
8.4.6. SWOT Analysis
8.5. Hyster-Yale Materials Handling, Inc.
8.5.1. Business Overview
8.5.2. Company Snapshot
8.5.3. Company Market Share Analysis
8.5.4. Company Product Portfolio
8.5.5. Recent Developments
8.5.6. SWOT Analysis
8.6. KION Group AG
8.6.1. Business Overview
8.6.2. Company Snapshot
8.6.3. Company Market Share Analysis
8.6.4. Company Product Portfolio
8.6.5. Recent Developments
8.6.6. SWOT Analysis
8.7. KION Group AG
8.7.1. Business Overview
8.7.2. Company Snapshot
8.7.3. Company Market Share Analysis
8.7.4. Company Product Portfolio
8.7.5. Recent Developments
8.7.6. SWOT Analysis
8.8. Hangcha
8.8.1. Business Overview
8.8.2. Company Snapshot
8.8.3. Company Market Share Analysis
8.8.4. Company Product Portfolio
8.8.5. Recent Developments
8.8.6. SWOT Analysis
8.9. Komatsu Ltd.
8.9.1. Business Overview
8.9.2. Company Snapshot
8.9.3. Company Market Share Analysis
8.9.4. Company Product Portfolio
8.9.5. Recent Developments
8.9.6. SWOT Analysis
8.10. Toyota Material Handling
8.10.1. Business Overview
8.10.2. Company Snapshot
8.10.3. Company Market Share Analysis
8.10.4. Company Product Portfolio
8.10.5. Recent Developments
8.10.6. SWOT Analysis
8.11. Mitsubishi Logisnext Co., Ltd.
8.11.1. Business Overview
8.11.2. Company Snapshot
8.11.3. Company Market Share Analysis
8.11.4. Company Product Portfolio
8.11.5. Recent Developments
8.11.6. SWOT Analysis
8.12. Jungheinrich AG
8.12.1. Business Overview
8.12.2. Company Snapshot
8.12.3. Company Market Share Analysis
8.12.4. Company Product Portfolio
8.12.5. Recent Developments
8.12.6. SWOT Analysis
List of Table
1. Global Forklift Market, By Propulsion, 2020-2033 (USD Billion) (Units)
2. Global Internal Combustion Engine, Forklift Market, By Region, 2020-2033 (USD Billion) (Units)
3. Global Electric, Forklift Market, By Region, 2020-2033 (USD Billion) (Units)
4. Global Forklift Market, By Class, 2020-2033 (USD Billion) (Units)
5. Global Class 1, Forklift Market, By Region, 2020-2033 (USD Billion) (Units)
6. Global Class 2, Forklift Market, By Region, 2020-2033 (USD Billion) (Units)
7. Global Class 3, Forklift Market, By Region, 2020-2033 (USD Billion) (Units)
8. Global Class 4/5, Forklift Market, By Region, 2020-2033 (USD Billion) (Units)
9. Global Forklift Market, By Tire Type, 2020-2033 (USD Billion) (Units)
10. Global Pneumatic, Forklift Market, By Region, 2020-2033 (USD Billion) (Units)
11. Global Cushion, Forklift Market, By Region, 2020-2033 (USD Billion) (Units)
12. Global Forklift Market, By Battery Type, 2020-2033 (USD Billion) (Units)
13. Global Lithium-Ion, Forklift Market, By Region, 2020-2033 (USD Billion) (Units)
14. Global Lead-Acid, Forklift Market, By Region, 2020-2033 (USD Billion) (Units)
15. Global Forklift Market, By Industry, 2020-2033 (USD Billion) (Units)
16. Global Food and Beverage, Forklift Market, By Region, 2020-2033 (USD Billion) (Units)
17. Global Automotive, Forklift Market, By Region, 2020-2033 (USD Billion) (Units)
18. Global 3PL, Forklift Market, By Region, 2020-2033 (USD Billion) (Units)
19. Global Paper and Pulp, Forklift Market, By Region, 2020-2033 (USD Billion) (Units)
20. Global Metals and Heavy Machinery, Forklift Market, By Region, 2020-2033 (USD Billion) (Units)
21. Global E-Commerce, Forklift Market, By Region, 2020-2033 (USD Billion) (Units)
22. Global Semiconductors and Electronics, Forklift Market, By Region, 2020-2033 (USD Billion) (Units)
23. Global Healthcare, Forklift Market, By Region, 2020-2033 (USD Billion) (Units)
24. Global Chemical, Forklift Market, By Region, 2020-2033 (USD Billion) (Units)
25. Global Others, Forklift Market, By Region, 2020-2033 (USD Billion) (Units)
26. North America Forklift Market, By Propulsion, 2020-2033 (USD Billion) (Units)
27. North America Forklift Market, By Class, 2020-2033 (USD Billion) (Units)
28. North America Forklift Market, By Tire Type, 2020-2033 (USD Billion) (Units)
29. North America Forklift Market, By Battery Type, 2020-2033 (USD Billion) (Units)
30. North America Forklift Market, By Industry, 2020-2033 (USD Billion) (Units)
31. U.S. Forklift Market, By Propulsion, 2020-2033 (USD Billion) (Units)
32. U.S. Forklift Market, By Class, 2020-2033 (USD Billion) (Units)
33. U.S. Forklift Market, By Tire Type, 2020-2033 (USD Billion) (Units)
34. U.S. Forklift Market, By Battery Type, 2020-2033 (USD Billion) (Units)
35. U.S. Forklift Market, By Industry, 2020-2033 (USD Billion) (Units)
36. Canada Forklift Market, By Propulsion, 2020-2033 (USD Billion) (Units)
37. Canada Forklift Market, By Class, 2020-2033 (USD Billion) (Units)
38. Canada Forklift Market, By Tire Type, 2020-2033 (USD Billion) (Units)
39. Canada Forklift Market, By Battery Type, 2020-2033 (USD Billion) (Units)
40. Canada Forklift Market, By Industry, 2020-2033 (USD Billion) (Units)
41. Mexico Forklift Market, By Propulsion, 2020-2033 (USD Billion) (Units)
42. Mexico Forklift Market, By Class, 2020-2033 (USD Billion) (Units)
43. Mexico Forklift Market, By Tire Type, 2020-2033 (USD Billion) (Units)
44. Mexico Forklift Market, By Battery Type, 2020-2033 (USD Billion) (Units)
45. Mexico Forklift Market, By Industry, 2020-2033 (USD Billion) (Units)
46. Europe Forklift Market, By Propulsion, 2020-2033 (USD Billion) (Units)
47. Europe Forklift Market, By Class, 2020-2033 (USD Billion) (Units)
48. Europe Forklift Market, By Tire Type, 2020-2033 (USD Billion) (Units)
49. Europe Forklift Market, By Battery Type, 2020-2033 (USD Billion) (Units)
50. Europe Forklift Market, By Industry, 2020-2033 (USD Billion) (Units)
51. Germany Forklift Market, By Propulsion, 2020-2033 (USD Billion) (Units)
52. Germany Forklift Market, By Class, 2020-2033 (USD Billion) (Units)
53. Germany Forklift Market, By Tire Type, 2020-2033 (USD Billion) (Units)
54. Germany Forklift Market, By Battery Type, 2020-2033 (USD Billion) (Units)
55. Germany Forklift Market, By Industry, 2020-2033 (USD Billion) (Units)
56. France Forklift Market, By Propulsion, 2020-2033 (USD Billion) (Units)
57. France Forklift Market, By Class, 2020-2033 (USD Billion) (Units)
58. France Forklift Market, By Tire Type, 2020-2033 (USD Billion) (Units)
59. France Forklift Market, By Battery Type, 2020-2033 (USD Billion) (Units)
60. France Forklift Market, By Industry, 2020-2033 (USD Billion) (Units)
61. U.K. Forklift Market, By Propulsion, 2020-2033 (USD Billion) (Units)
62. U.K. Forklift Market, By Class, 2020-2033 (USD Billion) (Units)
63. U.K. Forklift Market, By Tire Type, 2020-2033 (USD Billion) (Units)
64. U.K. Forklift Market, By Battery Type, 2020-2033 (USD Billion) (Units)
65. U.K. Forklift Market, By Industry, 2020-2033 (USD Billion) (Units)
66. Italy Forklift Market, By Propulsion, 2020-2033 (USD Billion) (Units)
67. Italy Forklift Market, By Class, 2020-2033 (USD Billion) (Units)
68. Italy Forklift Market, By Tire Type, 2020-2033 (USD Billion) (Units)
69. Italy Forklift Market, By Battery Type, 2020-2033 (USD Billion) (Units)
70. Italy Forklift Market, By Industry, 2020-2033 (USD Billion) (Units)
71. Spain Forklift Market, By Propulsion, 2020-2033 (USD Billion) (Units)
72. Spain Forklift Market, By Class, 2020-2033 (USD Billion) (Units)
73. Spain Forklift Market, By Tire Type, 2020-2033 (USD Billion) (Units)
74. Spain Forklift Market, By Battery Type, 2020-2033 (USD Billion) (Units)
75. Spain Forklift Market, By Industry, 2020-2033 (USD Billion) (Units)
76. Asia Pacific Forklift Market, By Propulsion, 2020-2033 (USD Billion) (Units)
77. Asia Pacific Forklift Market, By Class, 2020-2033 (USD Billion) (Units)
78. Asia Pacific Forklift Market, By Tire Type, 2020-2033 (USD Billion) (Units)
79. Asia Pacific Forklift Market, By Battery Type, 2020-2033 (USD Billion) (Units)
80. Asia Pacific Forklift Market, By Industry, 2020-2033 (USD Billion) (Units)
81. Japan Forklift Market, By Propulsion, 2020-2033 (USD Billion) (Units)
82. Japan Forklift Market, By Class, 2020-2033 (USD Billion) (Units)
83. Japan Forklift Market, By Tire Type, 2020-2033 (USD Billion) (Units)
84. Japan Forklift Market, By Battery Type, 2020-2033 (USD Billion) (Units)
85. Japan Forklift Market, By Industry, 2020-2033 (USD Billion) (Units)
86. China Forklift Market, By Propulsion, 2020-2033 (USD Billion) (Units)
87. China Forklift Market, By Class, 2020-2033 (USD Billion) (Units)
88. China Forklift Market, By Tire Type, 2020-2033 (USD Billion) (Units)
89. China Forklift Market, By Battery Type, 2020-2033 (USD Billion) (Units)
90. China Forklift Market, By Industry, 2020-2033 (USD Billion) (Units)
91. India Forklift Market, By Propulsion, 2020-2033 (USD Billion) (Units)
92. India Forklift Market, By Class, 2020-2033 (USD Billion) (Units)
93. India Forklift Market, By Tire Type, 2020-2033 (USD Billion) (Units)
94. India Forklift Market, By Battery Type, 2020-2033 (USD Billion) (Units)
95. India Forklift Market, By Industry, 2020-2033 (USD Billion) (Units)
96. South America Forklift Market, By Propulsion, 2020-2033 (USD Billion) (Units)
97. South America Forklift Market, By Class, 2020-2033 (USD Billion) (Units)
98. South America Forklift Market, By Tire Type, 2020-2033 (USD Billion) (Units)
99. South America Forklift Market, By Battery Type, 2020-2033 (USD Billion) (Units)
100. South America Forklift Market, By Industry, 2020-2033 (USD Billion) (Units)
101. Brazil Forklift Market, By Propulsion, 2020-2033 (USD Billion) (Units)
102. Brazil Forklift Market, By Class, 2020-2033 (USD Billion) (Units)
103. Brazil Forklift Market, By Tire Type, 2020-2033 (USD Billion) (Units)
104. Brazil Forklift Market, By Battery Type, 2020-2033 (USD Billion) (Units)
105. Brazil Forklift Market, By Industry, 2020-2033 (USD Billion) (Units)
106. Middle East and Africa Forklift Market, By Propulsion, 2020-2033 (USD Billion) (Units)
107. Middle East and Africa Forklift Market, By Class, 2020-2033 (USD Billion) (Units)
108. Middle East and Africa Forklift Market, By Tire Type, 2020-2033 (USD Billion) (Units)
109. Middle East and Africa Forklift Market, By Battery Type, 2020-2033 (USD Billion) (Units)
110. Middle East and Africa Forklift Market, By Industry, 2020-2033 (USD Billion) (Units)
111. UAE Forklift Market, By Propulsion, 2020-2033 (USD Billion) (Units)
112. UAE Forklift Market, By Class, 2020-2033 (USD Billion) (Units)
113. UAE Forklift Market, By Tire Type, 2020-2033 (USD Billion) (Units)
114. UAE Forklift Market, By Battery Type, 2020-2033 (USD Billion) (Units)
115. UAE Forklift Market, By Industry, 2020-2033 (USD Billion) (Units)
116. South Africa Forklift Market, By Propulsion, 2020-2033 (USD Billion) (Units)
117. South Africa Forklift Market, By Class, 2020-2033 (USD Billion) (Units)
118. South Africa Forklift Market, By Tire Type, 2020-2033 (USD Billion) (Units)
119. South Africa Forklift Market, By Battery Type, 2020-2033 (USD Billion) (Units)
120. South Africa Forklift Market, By Industry, 2020-2033 (USD Billion) (Units)
List of Figures
1. Global Forklift Market Segmentation
2. Global Forklift Market: Research Methodology
3. Market Size Estimation Methodology: Bottom-Up Approach
4. Market Size Estimation Methodology: Top-Down Approach
5. Data Triangulation
6. Porter’s Five Forces Analysis
7. Value Chain Analysis
8. Global Forklift Market Attractiveness Analysis By Propulsion
9. Global Forklift Market Attractiveness Analysis By Class
10. Global Forklift Market Attractiveness Analysis By Tire Type
11. Global Forklift Market Attractiveness Analysis By Battery Type
12. Global Forklift Market Attractiveness Analysis By Industry
13. Global Forklift Market Attractiveness Analysis By Region
14. Global Forklift Market: Dynamics
15. Global Forklift Market Share By Propulsion (2023 & 2033)
16. Global Forklift Market Share By Class (2023 & 2033)
17. Global Forklift Market Share By Tire Type (2023 & 2033)
18. Global Forklift Market Share By Battery Type (2023 & 2033)
19. Global Forklift Market Share By Industry (2023 & 2033)
20. Global Forklift Market Share By Regions (2023 & 2033)
21. Global Forklift Market Share By Company (2023)
This study forecasts revenue at global, regional, and country levels from 2020 to 2033. The Brainy Insights has segmented the global forklift based on below mentioned segments:
Global Forklift Market by Propulsion:
Global Forklift Market by Class:
Global Forklift Market by Tire Type:
Global Forklift Market by Battery Type:
Global Forklift Market by Industry:
Global Forklift by Region:
Research has its special purpose to undertake marketing efficiently. In this competitive scenario, businesses need information across all industry verticals; the information about customer wants, market demand, competition, industry trends, distribution channels etc. This information needs to be updated regularly because businesses operate in a dynamic environment. Our organization, The Brainy Insights incorporates scientific and systematic research procedures in order to get proper market insights and industry analysis for overall business success. The analysis consists of studying the market from a miniscule level wherein we implement statistical tools which helps us in examining the data with accuracy and precision.
Our research reports feature both; quantitative and qualitative aspects for any market. Qualitative information for any market research process are fundamental because they reveal the customer needs and wants, usage and consumption for any product/service related to a specific industry. This in turn aids the marketers/investors in knowing certain perceptions of the customers. Qualitative research can enlighten about the different product concepts and designs along with unique service offering that in turn, helps define marketing problems and generate opportunities. On the other hand, quantitative research engages with the data collection process through interviews, e-mail interactions, surveys and pilot studies. Quantitative aspects for the market research are useful to validate the hypotheses generated during qualitative research method, explore empirical patterns in the data with the help of statistical tools, and finally make the market estimations.
The Brainy Insights offers comprehensive research and analysis, based on a wide assortment of factual insights gained through interviews with CXOs and global experts and secondary data from reliable sources. Our analysts and industry specialist assume vital roles in building up statistical tools and analysis models, which are used to analyse the data and arrive at accurate insights with exceedingly informative research discoveries. The data provided by our organization have proven precious to a diverse range of companies, facilitating them to address issues such as determining which products/services are the most appealing, whether or not customers use the product in the manner anticipated, the purchasing intentions of the market and many others.
Our research methodology encompasses an idyllic combination of primary and secondary initiatives. Key phases involved in this process are listed below:

The phase involves the gathering and collecting of market data and its related information with the help of different sources & research procedures.

The data procurement stage involves in data gathering and collecting through various data sources.
This stage involves in extensive research. These data sources includes:
Purchased Database: Purchased databases play a crucial role in estimating the market sizes irrespective of the domain. Our purchased database includes:
Primary Research: The Brainy Insights interacts with leading companies and experts of the concerned domain to develop the analyst team’s market understanding and expertise. It improves and substantiates every single data presented in the market reports. Primary research mainly involves in telephonic interviews, E-mail interactions and face-to-face interviews with the raw material providers, manufacturers/producers, distributors, & independent consultants. The interviews that we conduct provides valuable data on market size and industry growth trends prevailing in the market. Our organization also conducts surveys with the various industry experts in order to gain overall insights of the industry/market. For instance, in healthcare industry we conduct surveys with the pharmacists, doctors, surgeons and nurses in order to gain insights and key information of a medical product/device/equipment which the customers are going to usage. Surveys are conducted in the form of questionnaire designed by our own analyst team. Surveys plays an important role in primary research because surveys helps us to identify the key target audiences of the market. Additionally, surveys helps to identify the key target audience engaged with the market. Our survey team conducts the survey by targeting the key audience, thus gaining insights from them. Based on the perspectives of the customers, this information is utilized to formulate market strategies. Moreover, market surveys helps us to understand the current competitive situation of the industry. To be precise, our survey process typically involve with the 360 analysis of the market. This analytical process begins by identifying the prospective customers for a product or service related to the market/industry to obtain data on how a product/service could fit into customers’ lives.

Secondary Research: The secondary data sources includes information published by the on-profit organizations such as World bank, WHO, company fillings, investor presentations, annual reports, national government documents, statistical databases, blogs, articles, white papers and others. From the annual report, we analyse a company’s revenue to understand the key segment and market share of that organization in a particular region. We analyse the company websites and adopt the product mapping technique which is important for deriving the segment revenue. In the product mapping method, we select and categorize the products offered by the companies catering to domain specific market, deduce the product revenue for each of the companies so as to get overall estimation of the market size. We also source data and analyses trends based on information received from supply side and demand side intermediaries in the value chain. The supply side denotes the data gathered from supplier, distributor, wholesaler and the demand side illustrates the data gathered from the end customers for respective market domain.

The supply side for a domain specific market is analysed by:
The demand side for the market is estimated through:
In-house Library: Apart from these third-party sources, we have our in-house library of qualitative and quantitative information. Our in-house database includes market data for various industry and domains. These data are updated on regular basis as per the changing market scenario. Our library includes, historic databases, internal audit reports and archives.
Sometimes there are instances where there is no metadata or raw data available for any domain specific market. For those cases, we use our expertise to forecast and estimate the market size in order to generate comprehensive data sets. Our analyst team adopt a robust research technique in order to produce the estimates:
Data Synthesis: This stage involves the analysis & mapping of all the information obtained from the previous step. It also involves in scrutinizing the data for any discrepancy observed while data gathering related to the market. The data is collected with consideration to the heterogeneity of sources. Robust scientific techniques are in place for synthesizing disparate data sets and provide the essential contextual information that can orient market strategies. The Brainy Insights has extensive experience in data synthesis where the data passes through various stages:


Market Deduction & Formulation: The final stage comprises of assigning data points at appropriate market spaces so as to deduce feasible conclusions. Analyst perspective & subject matter expert based holistic form of market sizing coupled with industry analysis also plays a crucial role in this stage.
This stage involves in finalization of the market size and numbers that we have collected from data integration step. With data interpolation, it is made sure that there is no gap in the market data. Successful trend analysis is done by our analysts using extrapolation techniques, which provide the best possible forecasts for the market.
Data Validation & Market Feedback: Validation is the most important step in the process. Validation & re-validation via an intricately designed process helps us finalize data-points to be used for final calculations.

The Brainy Insights interacts with leading companies and experts of the concerned domain to develop the analyst team’s market understanding and expertise. It improves and substantiates every single data presented in the market reports. The data validation interview and discussion panels are typically composed of the most experienced industry members. The participants include, however, are not limited to:
Moreover, we always validate our data and findings through primary respondents from all the major regions we are working on.


Free Customization
Fortune 500 Clients
Free Yearly Update On Purchase Of Multi/Corporate License
Companies Served Till Date