- +1-315-215-1633
- sales@thebrainyinsights.com

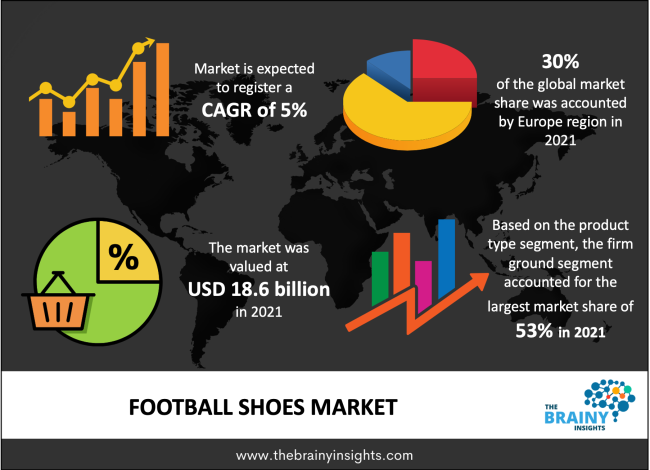
The football shoes market was estimated at around 18.6 billion in 2021, growing at a CAGR of nearly 5% during 2022-2030. The market is projected to reach approximately USD 28 billion by 2030.
Football shoes is the major product in the football sports. These shoes are usually made from different materials such as nylon, polyurethane, or leather. The football sports have become most popular sports in the western countries such as Brazil, Argentina, France, Spain, Italy, among others. Nike, Puma and Adidas are the major players in the football shoes market which accounts for major share in terms of value and volume. The giant players are actively focusing on launching new brands and products as per the customization of the players in order to gain the major customer base across the globe.
Since modern shoes no longer protect the ankle, they are no longer considered shoes because of their fundamental design and appearance, which have long since merged with those of sneakers. In addition to association football, players in specific positions frequently substitute them for specialised rugby shoes when playing rugby union and rugby league. Football boots are commonly used for other team sports played on grass fields, including hurling, Lacrosse, shinty, quiddich, and even tug of war.
Get an overview of this study by requesting a free sample
The overall football shoe market was destructively impacted by the Covid-19 epidemic. Logistics, the manufacturing sector, and supply chain operations were impacted by lockdowns and other restrictions brought on by the Covid-19 epidemic. The demand side of the market also suffered a severe impact. Due to the restrictions, championship games, numerous contests, and team activities had to be cancelled or delayed. When all football games were cancelled, there was a noteworthy drop in demand for football boots. In the footwear sector, Nike Inc. stated a 4% fall in growth. The market is predicted to recover over the projected period because of the increasing consumer propensity to spend and the recovering demand.
New initiatives and promotional activities will accelerate the market’s growth
The initiatives and promotional actions speed up market expansion. Such activities are boosting football's appeal and involvement, which is rising demand for football shoes. Women's football is receiving more funding, and there are more women's football competitions. Women's football, for instance, is becoming incredibly popular in the EU and the UK. One of the significant agreements for the broadcasting rights of the Women's Super League was announced by the Football Association in May 2022 with Sky Sports and the BBC. The game will probably become more popular with both women and men as a result. To launch new products with improved functionality and capacities, key companies actively work on new product development and sustainable technology. The increased number of product releases and R&D efforts is anticipated to support market expansion.
One of the most popular sports in the world is football. For instance, the Huffington Post estimates that 265 million people worldwide regularly play soccer or football. Football is becoming a well-known sport as a result of corporate sponsorships, which bring in a lot of money to the leagues. As a result, many football shoe manufacturers, like Nike and Asics Corporation, are producing excellent footwear for the players. Football sponsorships provide business owners with a number of marketing alternatives to boost advertising and reach a larger audience. Women's football, for instance, is becoming incredibly popular in the EU and the UK. The Football Association confirmed one of the major agreements with Sky Sports and BBC for the season in May 2022.
The firm ground category had the highest revenue share of nearly 50.0% in 2021 and is anticipated to increase rapidly over the next several years. This is as a result of how well-liked the type is among football players. The football boots for firm ground are designed for grass fields. Firm ground shoes are the most common option among players and are good for playing football when the surface is halfway between hard and damp. The market is divided into six primary product categories, including turf football, solid ground, artificial ground, hard ground/multi ground, soft ground, and indoor football. Additionally, the expansion of the infrastructure for football increases spending on football shoes and engagement from players at all levels.
The biggest revenue share in 2021 more than 60%—was accounted for by the offline distribution channel. Shopping centres, department stores, local sports shops, etc. make up the offline market. Consumer perception and buying habits are to blame for this. Compared to their online equivalents, consumers believe that brick and mortar stores are a more reliable and authentic source for shopping. Additionally, a product's trial is crucial while choosing the best option when purchasing football shoes. The offline distribution channel's ability to offer physical product testing and verification has a substantial impact on customer purchasing decisions as well. The market is divided into offline and online segments based on the distribution channel.
In 2021, the European region had the highest revenue share—more than 30.0%. This is explained by the significant growth in consumer expenditure on football-related goods, such as football shoes, in European nations and the popularity of the sport of football there. Football, which is among the top 5 sports in popularity across Europe, is one of the most popular sports in nations like Germany, France, Poland, Bulgaria, Romania, and Italy. Excellent distribution networks are shared by Adidas, Puma, and Nike. Adidas and Puma are based in Germany. The regional market is expanding due to the game's popularity, the prominence of important participants, and increased consumer spending.
Over the projected period, the Middle East and Africa are anticipated to develop at the fastest pace of 6.2%. The expansion is made possible by the region's expanding interest in football and rising spending on football-related goods. Middle Eastern and African nations are becoming more and more interested in football, and associations are forming and planning competitions to reflect this. The region is anticipated to experience a good growth rate during the projection period thanks to the increased disposable income. For example, soccer academies are opening all throughout Africa. A non-profit academy in Ghana called Right to Dream assists and trains young athletes to compete at a higher level.
The global Football Shoes market is segmented as follows:
By Product
By Distribution channel
By Region/Geography
| Attribute | Description |
|---|---|
| Base Year | 2021 |
| Forecast period | 2022-2030 |
| Report Coverage | Revenue estimation and forecast, company profile, competitive landscape, growth factors, and recent trends |
| Regional scope | North America, Europe, Asia Pacific, Middle East & Africa, and Latin America |
| Market Size(unit) | USD Billion |
| CAGR (2022 to 2030) | 5% |
| Segments Covered |
By Product |
1. Introduction
1.1. Objectives of the Study
1.2. Market Definition
1.3. Research Scope
2. Research Methodology and Assumptions
3. Executive Summary
4. Premium Insights
4.1. Porter’s Five Forces Analysis
4.2. Value Chain Analysis
4.3. Top Investment Pockets
4.3.1. Market Attractiveness Analysis By Product
4.3.2. Market Attractiveness Analysis By Distribution channel
4.4. Industry Trends
5. Market Dynamics
5.1. Market Evaluation
5.2. Drivers
5.2.1. Rising disposable income of people
5.2.2. Rising trend of playing football all over the world
5.3. Restrains
5.3.1. Risk of Injury
5.4. Opportunities
5.4.1. Growing market
6. Global Football Shoes Analysis and Forecast, By Product
6.1. Segment Overview
6.2. Soft Ground
6.3. Firm Ground
6.4. Artificial Ground
6.5. Hard Ground/Multi Ground
6.6. Turf Football
6.7. Indoor Football
7. Global Football Shoes Analysis and Forecast, By Distribution channel
7.1. Segment Overview
7.2. Online
7.3. Offline
8. Global Football Shoes Analysis and Forecast, By Regional Analysis
8.1. Segment Overview
8.2. North America
8.2.1. U.S.
8.2.2. Canada
8.2.3. Mexico
8.3. Europe
8.3.1. Germany
8.3.2. France
8.3.3. U.K.
8.3.4. Italy
8.3.5. Spain
8.3.6. Rest of Europe
8.4. Asia-Pacific
8.4.1. Japan
8.4.2. China
8.4.3. India
8.4.4. Australia
8.4.5. South Korea
8.4.6. Rest of Asia-Pacific
8.5. South America
8.5.1. Brazil
8.5.2. Argentina
8.5.3. Rest of South America
8.6. Middle East and Africa
8.6.1. UAE
8.6.2. South Africa
8.6.3. Egypt
8.6.4. Kuwait
8.6.5. Saudi Arabia
8.6.6. Rest of Middle East & Africa
9. Global Football Shoes-Competitive Landscape
9.1. Overview
9.2. Market Share of Key Players in the Football Shoes
9.2.1. Global Company Market Share
9.2.2. North America Company Market Share
9.2.3. Europe Company Market Share
9.2.4. APAC Company Market Share
9.3. Competitive Situations and Trends
9.3.1. Product Launches and Developments
9.3.2. Partnerships, Collaborations, and Agreements
9.3.3. Mergers & Acquisitions
9.3.4. Expansions
10. Company Profiles
10.1. Adidas AG
10.1.1. Business Overview
10.1.2. Company Snapshot
10.1.3. Company Market Share Analysis
10.1.4. Company Distribution channel Portfolio
10.1.5. Recent Developments
10.1.6. SWOT Analysis
10.2. Nike Inc.
10.2.1. Business Overview
10.2.2. Company Snapshot
10.2.3. Company Market Share Analysis
10.2.4. Company Distribution channel Portfolio
10.2.5. Recent Developments
10.2.6. SWOT Analysis
10.3. Puma SE
10.3.1. Business Overview
10.3.2. Company Snapshot
10.3.3. Company Market Share Analysis
10.3.4. Company Distribution channel Portfolio
10.3.5. Recent Developments
10.3.6. SWOT Analysis
10.4. Under Armour
10.4.1. Business Overview
10.4.2. Company Snapshot
10.4.3. Company Market Share Analysis
10.4.4. Company Distribution channel Portfolio
10.4.5. Recent Developments
10.4.6. SWOT Analysis
10.5. Muzino Corporation
10.5.1. Business Overview
10.5.2. Company Snapshot
10.5.3. Company Market Share Analysis
10.5.4. Company Distribution channel Portfolio
10.5.5. Recent Developments
10.5.6. SWOT Analysis
10.6. Lotto Sport Italia
10.6.1. Business Overview
10.6.2. Company Snapshot
10.6.3. Company Market Share Analysis
10.6.4. Company Distribution channel Portfolio
10.6.5. Recent Developments
10.6.6. SWOT Analysis
10.7. Kingpen
10.7.1. Business Overview
10.7.2. Company Snapshot
10.7.3. Company Market Share Analysis
10.7.4. Company Distribution channel Portfolio
10.7.5. Recent Developments
10.7.6. SWOT Analysis
10.8. New Balance
10.8.1. Business Overview
10.8.2. Company Snapshot
10.8.3. Company Market Share Analysis
10.8.4. Company Distribution channel Portfolio
10.8.5. Recent Developments
10.8.6. SWOT Analysis
10.9. Orchid Essentials
10.9.1. Business Overview
10.9.2. Company Snapshot
10.9.3. Company Market Share Analysis
10.9.4. Company Distribution channel Portfolio
10.9.5. Recent Developments
10.9.6. SWOT Analysis
10.10. ASICS Corporation
10.10.1. Business Overview
10.10.2. Company Snapshot
10.10.3. Company Market Share Analysis
10.10.4. Company Distribution channel Portfolio
10.10.5. Recent Developments
10.10.6. SWOT Analysis
List of Table
1. Global Football Shoes, By Product, 2022-2030(USD Billion)
2. Global Soft Ground Football Shoes, By Region, 2022-2030(USD Billion)
3. Global Firm Ground Football Shoes, By Region, 2022-2030(USD Billion)
4. Global Others Football Shoes, By Region, 2022-2030(USD Billion)
5. Global Football Shoes, By Distribution channel, 2022-2030(USD Billion)
6. Global Online Football Shoes, By Region, 2022-2030(USD Billion)
7. Global Offline Football Shoes, By Region, 2022-2030(USD Billion)
8. Global Football Shoes, By Region, 2022-2030(USD Billion)
9. Global Football Shoes, By North America, 2022-2030(USD Billion)
10. North America Football Shoes, By Product, 2022-2030(USD Billion)
11. North America Football Shoes, By Distribution channel, 2022-2030(USD Billion)
12. U.S. Football Shoes, By Product, 2022-2030(USD Billion)
13. U.S. Football Shoes, By Distribution channel, 2022-2030(USD Billion)
14. Canada Football Shoes, By Product, 2022-2030(USD Billion)
15. Canada Football Shoes, By Distribution channel, 2022-2030(USD Billion)
16. Mexico Football Shoes, By Product, 2022-2030(USD Billion)
17. Mexico Football Shoes, By Distribution channel, 2022-2030(USD Billion)
18. Europe Football Shoes, By Product, 2022-2030(USD Billion)
19. Europe Football Shoes, By Distribution channel, 2022-2030(USD Billion)
20. Germany Football Shoes, By Product, 2022-2030(USD Billion)
21. Germany Football Shoes, By Distribution channel, 2022-2030(USD Billion)
22. France Football Shoes, By Product, 2022-2030(USD Billion)
23. France Football Shoes, By Distribution channel, 2022-2030(USD Billion)
24. U.K. Football Shoes, By Product, 2022-2030(USD Billion)
25. U.K. Football Shoes, By Distribution channel, 2022-2030(USD Billion)
26. Italy Football Shoes, By Product, 2022-2030(USD Billion)
27. Italy Football Shoes, By Distribution channel, 2022-2030(USD Billion)
28. Spain Football Shoes, By Product, 2022-2030(USD Billion)
29. Spain Football Shoes, By Distribution channel, 2022-2030(USD Billion)
30. Rest of Europe Football Shoes, By Product, 2022-2030(USD Billion)
31. Rest of Europe Football Shoes, By Distribution channel, 2022-2030(USD Billion)
32. Asia Pacific Football Shoes, By Product, 2022-2030(USD Billion)
33. Asia Pacific Football Shoes, By Distribution channel, 2022-2030(USD Billion)
34. Japan Football Shoes, By Product, 2022-2030(USD Billion)
35. Japan Football Shoes, By Distribution channel, 2022-2030(USD Billion)
36. China Football Shoes, By Product, 2022-2030(USD Billion)
37. China Football Shoes, By Distribution channel, 2022-2030(USD Billion)
38. India Football Shoes, By Product, 2022-2030(USD Billion)
39. India Football Shoes, By Distribution channel, 2022-2030(USD Billion)
40. Australia Football Shoes, By Product, 2022-2030(USD Billion)
41. Australia Football Shoes, By Distribution channel, 2022-2030(USD Billion)
42. South Korea Football Shoes, By Product, 2022-2030(USD Billion)
43. South Korea Football Shoes, By Distribution channel, 2022-2030(USD Billion)
44. Rest of Asia-Pacific Football Shoes, By Product, 2022-2030(USD Billion)
45. Rest of Asia-Pacific Football Shoes, By Distribution channel, 2022-2030(USD Billion)
46. South America Football Shoes, By Product, 2022-2030(USD Billion)
47. South America Football Shoes, By Distribution channel, 2022-2030(USD Billion)
48. Brazil Football Shoes, By Product, 2022-2030(USD Billion)
49. Brazil Football Shoes, By Distribution channel, 2022-2030(USD Billion)
50. Argentina Football Shoes, By Product, 2022-2030(USD Billion)
51. Argentina Football Shoes, By Distribution channel, 2022-2030(USD Billion)
52. Rest of Latin America Football Shoes, By Product, 2022-2030(USD Billion)
53. Rest of Latin America Football Shoes, By Distribution channel, 2022-2030(USD Billion)
54. Middle East and Africa Football Shoes, By Product, 2022-2030(USD Billion)
55. Middle East and Africa Football Shoes, By Distribution channel, 2022-2030(USD Billion)
56. UAE Football Shoes, By Product, 2022-2030(USD Billion)
57. UAE Football Shoes, By Distribution channel, 2022-2030(USD Billion)
58. South Africa Football Shoes, By Product, 2022-2030(USD Billion)
59. South Africa Football Shoes, By Distribution channel, 2022-2030(USD Billion)
60. Egypt Football Shoes, By Product, 2022-2030(USD Billion)
61. Egypt Football Shoes, By Distribution channel, 2022-2030(USD Billion)
62. Kuwait Football Shoes, By Product, 2022-2030(USD Billion)
63. Kuwait Football Shoes, By Distribution channel, 2022-2030(USD Billion)
64. Saudi Arabia Football Shoes, By Product, 2022-2030(USD Billion)
65. Saudi Arabia Football Shoes, By Distribution channel, 2022-2030(USD Billion)
66. Rest of Middle East Football Shoes, By Product, 2022-2030(USD Billion)
67. Rest of Middle East Football Shoes, By Distribution channel, 2022-2030(USD Billion)
List of Figures
1. Global Football Shoes Segmentation
2. Football Shoes: Research Methodology
3. Market Size Estimation Methodology: Bottom-Up Approach
4. Market Size Estimation Methodology: Top-Down Approach
5. Data Triangulation
6. Porter’s Five Forces Analysis
7. Value Chain Analysis
8. Global Football Shoes Attractiveness Analysis By Product
9. Global Football Shoes Attractiveness Analysis By Distribution channel
10. Global Football Shoes Attractiveness Analysis By Region
11. Global Football Shoes: Dynamics
12. Global Football Shoes Share By Product(2022 & 2030)
13. Global Football Shoes Share By Distribution channel(2022 & 2030)
14. Global Football Shoes Share by Regions (2022 & 2030)
15. Global Football Shoes Share by Company (2021)
By Product
By Distribution channel
By Region/Geography
Research has its special purpose to undertake marketing efficiently. In this competitive scenario, businesses need information across all industry verticals; the information about customer wants, market demand, competition, industry trends, distribution channels etc. This information needs to be updated regularly because businesses operate in a dynamic environment. Our organization, The Brainy Insights incorporates scientific and systematic research procedures in order to get proper market insights and industry analysis for overall business success. The analysis consists of studying the market from a miniscule level wherein we implement statistical tools which helps us in examining the data with accuracy and precision.
Our research reports feature both; quantitative and qualitative aspects for any market. Qualitative information for any market research process are fundamental because they reveal the customer needs and wants, usage and consumption for any product/service related to a specific industry. This in turn aids the marketers/investors in knowing certain perceptions of the customers. Qualitative research can enlighten about the different product concepts and designs along with unique service offering that in turn, helps define marketing problems and generate opportunities. On the other hand, quantitative research engages with the data collection process through interviews, e-mail interactions, surveys and pilot studies. Quantitative aspects for the market research are useful to validate the hypotheses generated during qualitative research method, explore empirical patterns in the data with the help of statistical tools, and finally make the market estimations.
The Brainy Insights offers comprehensive research and analysis, based on a wide assortment of factual insights gained through interviews with CXOs and global experts and secondary data from reliable sources. Our analysts and industry specialist assume vital roles in building up statistical tools and analysis models, which are used to analyse the data and arrive at accurate insights with exceedingly informative research discoveries. The data provided by our organization have proven precious to a diverse range of companies, facilitating them to address issues such as determining which products/services are the most appealing, whether or not customers use the product in the manner anticipated, the purchasing intentions of the market and many others.
Our research methodology encompasses an idyllic combination of primary and secondary initiatives. Key phases involved in this process are listed below:

The phase involves the gathering and collecting of market data and its related information with the help of different sources & research procedures.

The data procurement stage involves in data gathering and collecting through various data sources.
This stage involves in extensive research. These data sources includes:
Purchased Database: Purchased databases play a crucial role in estimating the market sizes irrespective of the domain. Our purchased database includes:
Primary Research: The Brainy Insights interacts with leading companies and experts of the concerned domain to develop the analyst team’s market understanding and expertise. It improves and substantiates every single data presented in the market reports. Primary research mainly involves in telephonic interviews, E-mail interactions and face-to-face interviews with the raw material providers, manufacturers/producers, distributors, & independent consultants. The interviews that we conduct provides valuable data on market size and industry growth trends prevailing in the market. Our organization also conducts surveys with the various industry experts in order to gain overall insights of the industry/market. For instance, in healthcare industry we conduct surveys with the pharmacists, doctors, surgeons and nurses in order to gain insights and key information of a medical product/device/equipment which the customers are going to usage. Surveys are conducted in the form of questionnaire designed by our own analyst team. Surveys plays an important role in primary research because surveys helps us to identify the key target audiences of the market. Additionally, surveys helps to identify the key target audience engaged with the market. Our survey team conducts the survey by targeting the key audience, thus gaining insights from them. Based on the perspectives of the customers, this information is utilized to formulate market strategies. Moreover, market surveys helps us to understand the current competitive situation of the industry. To be precise, our survey process typically involve with the 360 analysis of the market. This analytical process begins by identifying the prospective customers for a product or service related to the market/industry to obtain data on how a product/service could fit into customers’ lives.

Secondary Research: The secondary data sources includes information published by the on-profit organizations such as World bank, WHO, company fillings, investor presentations, annual reports, national government documents, statistical databases, blogs, articles, white papers and others. From the annual report, we analyse a company’s revenue to understand the key segment and market share of that organization in a particular region. We analyse the company websites and adopt the product mapping technique which is important for deriving the segment revenue. In the product mapping method, we select and categorize the products offered by the companies catering to domain specific market, deduce the product revenue for each of the companies so as to get overall estimation of the market size. We also source data and analyses trends based on information received from supply side and demand side intermediaries in the value chain. The supply side denotes the data gathered from supplier, distributor, wholesaler and the demand side illustrates the data gathered from the end customers for respective market domain.

The supply side for a domain specific market is analysed by:
The demand side for the market is estimated through:
In-house Library: Apart from these third-party sources, we have our in-house library of qualitative and quantitative information. Our in-house database includes market data for various industry and domains. These data are updated on regular basis as per the changing market scenario. Our library includes, historic databases, internal audit reports and archives.
Sometimes there are instances where there is no metadata or raw data available for any domain specific market. For those cases, we use our expertise to forecast and estimate the market size in order to generate comprehensive data sets. Our analyst team adopt a robust research technique in order to produce the estimates:
Data Synthesis: This stage involves the analysis & mapping of all the information obtained from the previous step. It also involves in scrutinizing the data for any discrepancy observed while data gathering related to the market. The data is collected with consideration to the heterogeneity of sources. Robust scientific techniques are in place for synthesizing disparate data sets and provide the essential contextual information that can orient market strategies. The Brainy Insights has extensive experience in data synthesis where the data passes through various stages:


Market Deduction & Formulation: The final stage comprises of assigning data points at appropriate market spaces so as to deduce feasible conclusions. Analyst perspective & subject matter expert based holistic form of market sizing coupled with industry analysis also plays a crucial role in this stage.
This stage involves in finalization of the market size and numbers that we have collected from data integration step. With data interpolation, it is made sure that there is no gap in the market data. Successful trend analysis is done by our analysts using extrapolation techniques, which provide the best possible forecasts for the market.
Data Validation & Market Feedback: Validation is the most important step in the process. Validation & re-validation via an intricately designed process helps us finalize data-points to be used for final calculations.

The Brainy Insights interacts with leading companies and experts of the concerned domain to develop the analyst team’s market understanding and expertise. It improves and substantiates every single data presented in the market reports. The data validation interview and discussion panels are typically composed of the most experienced industry members. The participants include, however, are not limited to:
Moreover, we always validate our data and findings through primary respondents from all the major regions we are working on.


Free Customization
Fortune 500 Clients
Free Yearly Update On Purchase Of Multi/Corporate License
Companies Served Till Date