- +1-315-215-1633
- sales@thebrainyinsights.com

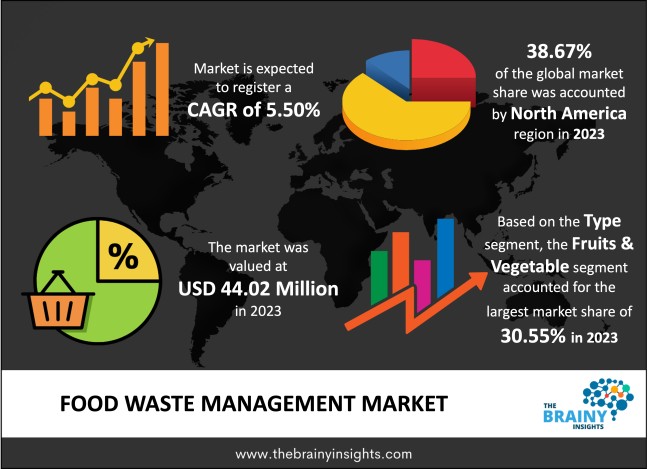
The food waste management market size was valued at USD 44.02 billion in 2023 and is anticipated to reach a projected value of USD 75.19 billion by 2033 while growing at a CAGR of 5.50% during the forecast period 2024-2033.
Food waste refers to the wastage generated during food processing and supply chain activities such as transportation, and distribution. Food waste management can be described as those activities and actions which are mandatory for the accomplishment of waste from the point of its initiation to the end of its clearance. The process of food waste management includes collection, transportation, treatment, and disposal of waste along with regulations and proper monitoring. One of the main reasons for the growth of the food waste management market is the food processing wastage that includes agricultural produce processing, meat, poultry & seafood processing wastage and wastes from different types of food processing.
The factors driving the market's growth are rapid industrialization and urbanization across the world, especially in developing countries; the growing importance and usage of organic waste in the production of fertilizers and animal feed has driven the growth of the market significantly. The harmful effect on the environment due to the combustion of the wastes, which adds to the pollution, is a restraining factor for the market's growth. Many large companies are looking forward to investing in pioneering solutions to solve food waste management issues, which is an excellent opportunity for the development of the market.
Get an overview of this study by requesting a free sample
This study delivers a comprehensive analysis of type, process, application and region. The type segment includes fruits & vegetables, meat, fish & seafood, cereals, dairy products, and processed foods. The fruits & vegetable segment held the biggest market share of 30.55% in 2023 owing to the lack of proper storage, processing, and handling of the produce. The cereals segment is expected to witness significant growth mainly due to the lack of knowledge among the consumers about the preservation and storage practices of cereals, leading to a lot of wastage. The process segment includes aerobic digestion, anaerobic digestion, combustion/incineration, and others. The anaerobic digestion segment held the largest market share of 43.97% in 2023 owing to the benefits of treating the food waste with anaerobic digestion, such as no pathogens, which then limits the spread of diseases and odor. It also promotes sanitation and hygiene. Combustion/incineration also held a leading market as it can be used for all types of food wastes which is helpful in saving the costs of segregating the waste. The application segment includes fertilizers, animal feed, biofuel, and power generation. The animal feed segment held the biggest market share of 36.55% in 2023. Food waste can be processed using a rendering technique and fed to the livestock without incurring any additional costs.
The market has been divided into North America, Europe, Asia-Pacific, Middle East & Africa, and South America. North America held the most significant market share of 38.67% in 2023 owing to the Solid Waste Association of North America, which has supported and offered various practices and services, namely, integrated solid waste management and recycling of residential waste. Europe expects significant growth primarily due to excessive shopping, overproduction, and improper food management. The countries in Asia-Pacific are also rapidly adopting food waste management due to wastage of food in transit during exports to European and North American countries.
Some of the key players operating in the food waste management market are Republic Services, Inc. (U.S.), Stericycle, Inc. (U.S.), Andritz Ag (Austria), Waste Management, Inc. (U.S.), Veolia Environnement S.A. (France), Covanta Holding Corporation (U.S.), and Waste Connections, Inc. (Canada), Recology Inc., DeIorio's Foods Inc., FCC Environment Ltd., CT Environmental Group Ltd., Clean Harbors, Inc.
As per The Brainy Insights, the size of the Food Waste Management market was valued USD 44.02 billion in 2023 & USD 75.19 billion by 2033.
Global Food Waste Management market is growing at a CAGR of 5.50% during the forecast period 2024-2033.
North America region emerged as the largest market for the Food Waste Management.
The market's growth will be influenced by the rapid industrialization and urbanization across the world.
Harmful effect on the environment due to the combustion of the waste could hamper the market growth.
Many large companies are looking forward to investing in pioneering solutions to solve food waste management issues is providing huge opportunities to the market.
1. Introduction
1.1. Objectives of the Study
1.2. Market Definition
1.3. Research Scope
1.4. Currency
1.5. Key Target Audience
2. Research Methodology and Assumptions
3. Executive Summary
4. Premium Insights
4.1. Porter’s Five Forces Analysis
4.2. Value Chain Analysis
4.3. Top Investment Pockets
4.3.1. Market Attractiveness Analysis By Type
4.3.2. Market Attractiveness Analysis By Process
4.3.3. Market Attractiveness Analysis By Application
4.3.4. Market Attractiveness Analysis By Region
4.4. Industry Trends
5. Market Dynamics
5.1. Market Evaluation
5.2. Drivers
5.2.1. Rapid industrialization and urbanization
5.2.2. Use of organic waste in the procession of fertilizers and animal feed
5.3. Restraints
5.3.1. Harmful effect on environment due to pyre techniques
5.4. Opportunities
5.4.1. Companies looking to invest in pioneering solutions
6. Global Food Waste Management Market Analysis and Forecast, By Type
6.1. Segment Overview
6.2. Fruits & Vegetables
6.3. Meat, Fish & Sea Food
6.4. Cereals
6.5. Dairy Products
6.6. Processed Foods
7. Global Food Waste Management Market Analysis and Forecast, By Process
7.1. Segment Overview
7.2. Aerobic Digestion
7.3. Anaerobic Digestion
7.4. Combustion/Incineration
7.5. Others
8. Global Food Waste Management Market Analysis and Forecast, By Application
8.1. Segment Overview
8.2. Fertilizers
8.3. Animal Feed
8.4. Biofuel
8.5. Power Generation
9. Global Food Waste Management Market Analysis and Forecast, By Regional Analysis
9.1. Segment Overview
9.2. North America
9.2.1. U.S.
9.2.2. Canada
9.2.3. Mexico
9.3. Europe
9.3.1. Germany
9.3.2. France
9.3.3. U.K.
9.3.4. Italy
9.3.5. Spain
9.4. Asia-Pacific
9.4.1. Japan
9.4.2. China
9.4.3. India
9.5. South America
9.5.1. Brazil
9.6. Middle East and Africa
9.6.1. UAE
9.6.2. South Africa
10. Global Food Waste Management Market-Competitive Landscape
10.1. Overview
10.2. Market Share of Key Players in Global Food Waste Management Market
10.2.1. Global Company Market Share
10.2.2. North America Company Market Share
10.2.3. Europe Company Market Share
10.2.4. Asia-Pacific Company Market Share
10.3. Competitive Situations and Trends
10.3.1. Process Launches and Developments
10.3.2. Partnerships, Collaborations, and Agreements
10.3.3. Mergers & Acquisitions
10.3.4. Expansions
11. Company Profiles
11.1. Republic Services, Inc.
11.1.1. Business Overview
11.1.2. Company Snapshot
11.1.3. Company Market Share Analysis
11.1.4. Company Process Portfolio
11.1.5. Recent Developments
11.1.6. SWOT Analysis
11.2. Stericycle, Inc.
11.2.1. Business Overview
11.2.2. Company Snapshot
11.2.3. Company Market Share Analysis
11.2.4. Company Process Portfolio
11.2.5. Recent Developments
11.2.6. SWOT Analysis
11.3. Andritz Ag
11.3.1. Business Overview
11.3.2. Company Snapshot
11.3.3. Company Market Share Analysis
11.3.4. Company Process Portfolio
11.3.5. Recent Developments
11.3.6. SWOT Analysis
11.4. Waste Management, Inc.
11.4.1. Business Overview
11.4.2. Company Snapshot
11.4.3. Company Market Share Analysis
11.4.4. Company Process Portfolio
11.4.5. Recent Developments
11.4.6. SWOT Analysis
11.5. Veolia Environnement S.A.
11.5.1. Business Overview
11.5.2. Company Snapshot
11.5.3. Company Market Share Analysis
11.5.4. Company Process Portfolio
11.5.5. Recent Developments
11.5.6. SWOT Analysis
11.6. Covanta Holding Corporation
11.6.1. Business Overview
11.6.2. Company Snapshot
11.6.3. Company Market Share Analysis
11.6.4. Company Process Portfolio
11.6.5. Recent Developments
11.6.6. SWOT Analysis
11.7. Waste Connections, Inc.
11.7.1. Business Overview
11.7.2. Company Snapshot
11.7.3. Company Market Share Analysis
11.7.4. Company Process Portfolio
11.7.5. Recent Developments
11.7.6. SWOT Analysis
11.8. Recology Inc.
11.8.1. Business Overview
11.8.2. Company Snapshot
11.8.3. Company Market Share Analysis
11.8.4. Company Process Portfolio
11.8.5. Recent Developments
11.8.6. SWOT Analysis
11.9. DeIorio's Foods Inc.
11.9.1. Business Overview
11.9.2. Company Snapshot
11.9.3. Company Market Share Analysis
11.9.4. Company Process Portfolio
11.9.5. Recent Developments
11.9.6. SWOT Analysis
11.10. FCC Environment Ltd.
11.10.1. Business Overview
11.10.2. Company Snapshot
11.10.3. Company Market Share Analysis
11.10.4. Company Process Portfolio
11.10.5. Recent Developments
11.10.6. SWOT Analysis
11.11. CT Environmental Group Ltd.
11.11.1. Business Overview
11.11.2. Company Snapshot
11.11.3. Company Market Share Analysis
11.11.4. Company Process Portfolio
11.11.5. Recent Developments
11.11.6. SWOT Analysis
11.12. Clean Harbors, Inc.
11.12.1. Business Overview
11.12.2. Company Snapshot
11.12.3. Company Market Share Analysis
11.12.4. Company Process Portfolio
11.12.5. Recent Developments
11.12.6. SWOT Analysis
List of Table
1. Global Food Waste Management Market, By Type, 2020-2033 (USD Billion)
2. Global Fruits & Vegetables, Food Waste Management Market, By Region, 2020-2033 (USD Billion)
3. Global Meat, fish & seafood, Food Waste Management Market, By Region, 2020-2033 (USD Billion)
4. Global Cereals, Food Waste Management Market, By Region, 2020-2033 (USD Billion)
5. Global Dairy Products, Food Waste Management Market, By Region, 2020-2033 (USD Billion)
6. Global Processed Foods, Food Waste Management Market, By Region, 2020-2033 (USD Billion)
7. Global Food Waste Management Market, By Process, 2020-2033 (USD Billion)
8. Global Aerobic Digestion, Food Waste Management Market, By Region, 2020-2033 (USD Billion)
9. Global Anaerobic Digestion , Food Waste Management Market, By Region, 2020-2033 (USD Billion)
10. Global Combustion/Incineration, Food Waste Management Market, By Region, 2020-2033 (USD Billion)
11. Global Others, Food Waste Management Market, By Region, 2020-2033 (USD Billion)
12. Global Food Waste Management Market, By Application, 2020-2033 (USD Billion)
13. Global Fertilizers, Food Waste Management Market, By Region, 2020-2033 (USD Billion)
14. Global Animal Feed, Food Waste Management Market, By Region, 2020-2033 (USD Billion)
15. Global Biofuel, Food Waste Management Market, By Region, 2020-2033 (USD Billion)
16. Global Power generation, Food Waste Management Market, By Region, 2020-2033 (USD Billion)
17. North America Food Waste Management Market, By Type, 2020-2033 (USD Billion)
18. North America Food Waste Management Market, By Process, 2020-2033 (USD Billion)
19. North America Food Waste Management Market, By Application, 2020-2033 (USD Billion)
20. U.S. Food Waste Management Market, By Type, 2020-2033 (USD Billion)
21. U.S. Food Waste Management Market, By Process, 2020-2033 (USD Billion)
22. U.S. Food Waste Management Market, By Application, 2020-2033 (USD Billion)
23. Canada Food Waste Management Market, By Type, 2020-2033 (USD Billion)
24. Canada Food Waste Management Market, By Process, 2020-2033 (USD Billion)
25. Canada Food Waste Management Market, By Application, 2020-2033 (USD Billion)
26. Mexico Food Waste Management Market, By Type, 2020-2033 (USD Billion)
27. Mexico Food Waste Management Market, By Process, 2020-2033 (USD Billion)
28. Mexico Food Waste Management Market, By Application, 2020-2033 (USD Billion)
29. Europe Food Waste Management Market, By Type, 2020-2033 (USD Billion)
30. Europe Food Waste Management Market, By Process, 2020-2033 (USD Billion)
31. Europe Food Waste Management Market, By Application, 2020-2033 (USD Billion)
32. Germany Food Waste Management Market, By Type, 2020-2033 (USD Billion)
33. Germany Food Waste Management Market, By Process, 2020-2033 (USD Billion)
34. Germany Food Waste Management Market, By Application, 2020-2033 (USD Billion)
35. France Food Waste Management Market, By Type, 2020-2033 (USD Billion)
36. France Food Waste Management Market, By Process, 2020-2033 (USD Billion)
37. France Food Waste Management Market, By Application, 2020-2033 (USD Billion)
38. U.K. Food Waste Management Market, By Type, 2020-2033 (USD Billion)
39. U.K. Food Waste Management Market, By Process, 2020-2033 (USD Billion)
40. U.K. Food Waste Management Market, By Application, 2020-2033 (USD Billion)
41. Italy Food Waste Management Market, By Type, 2020-2033 (USD Billion)
42. Italy Food Waste Management Market, By Process, 2020-2033 (USD Billion)
43. Italy Food Waste Management Market, By Application, 2020-2033 (USD Billion)
44. Spain Food Waste Management Market, By Type, 2020-2033 (USD Billion)
45. Spain Food Waste Management Market, By Process, 2020-2033 (USD Billion)
46. Spain Food Waste Management Market, By Application, 2020-2033 (USD Billion)
47. Asia Pacific Food Waste Management Market, By Type, 2020-2033 (USD Billion)
48. Asia Pacific Food Waste Management Market, By Process, 2020-2033 (USD Billion)
49. Asia Pacific Food Waste Management Market, By Application, 2020-2033 (USD Billion)
50. Japan Food Waste Management Market, By Type, 2020-2033 (USD Billion)
51. Japan Food Waste Management Market, By Process, 2020-2033 (USD Billion)
52. Japan Food Waste Management Market, By Application, 2020-2033 (USD Billion)
53. China Food Waste Management Market, By Type, 2020-2033 (USD Billion)
54. China Food Waste Management Market, By Process, 2020-2033 (USD Billion)
55. China Food Waste Management Market, By Application, 2020-2033 (USD Billion)
56. India Food Waste Management Market, By Type, 2020-2033 (USD Billion)
57. India Food Waste Management Market, By Process, 2020-2033 (USD Billion)
58. India Food Waste Management Market, By Application, 2020-2033 (USD Billion)
59. South America Food Waste Management Market, By Type, 2020-2033 (USD Billion)
60. South America Food Waste Management Market, By Process, 2020-2033 (USD Billion)
61. South America Food Waste Management Market, By Application, 2020-2033 (USD Billion)
62. Brazil Food Waste Management Market, By Type, 2020-2033 (USD Billion)
63. Brazil Food Waste Management Market, By Process, 2020-2033 (USD Billion)
64. Brazil Food Waste Management Market, By Application, 2020-2033 (USD Billion)
65. Middle East and Africa Food Waste Management Market, By Type, 2020-2033 (USD Billion)
66. Middle East and Africa Food Waste Management Market, By Process, 2020-2033 (USD Billion)
67. Middle East and Africa Food Waste Management Market, By Application, 2020-2033 (USD Billion)
68. UAE Food Waste Management Market, By Type, 2020-2033 (USD Billion)
69. UAE Food Waste Management Market, By Process, 2020-2033 (USD Billion)
70. UAE Food Waste Management Market, By Application, 2020-2033 (USD Billion)
71. South Africa Food Waste Management Market, By Type, 2020-2033 (USD Billion)
72. South Africa Food Waste Management Market, By Process, 2020-2033 (USD Billion)
73. South Africa Food Waste Management Market, By Application, 2020-2033 (USD Billion)
List of Figures
1. Global Food Waste Management Market Segmentation
2. Global Food Waste Management Market: Research Methodology
3. Market Size Estimation Methodology: Bottom-Up Approach
4. Market Size Estimation Methodology: Top-Down Approach
5. Data Triangulation
6. Porter’s Five Forces Analysis
7. Value Chain Analysis
8. Global Food Waste Management Market Attractiveness Analysis By Type
9. Global Food Waste Management Market Attractiveness Analysis By Process
10. Global Food Waste Management Market Attractiveness Analysis By Application
11. Global Food Waste Management Market Attractiveness Analysis By Region
12. Global Food Waste Management Market: Dynamics
13. Global Food Waste Management Market Share by Type (2023 & 2033)
14. Global Food Waste Management Market Share by Process (2023 & 2033)
15. Global Food Waste Management Market Share by Application (2023 & 2033)
16. Global Food Waste Management Market Share by Regions (2023 & 2033)
17. Global Food Waste Management Market Share by Company (2023)
This study forecasts revenue at global, regional, and country levels from 2020 to 2033. The Brainy Insights has segmented the global Food Waste Management market based on below mentioned segments:
Global Food Waste Management Market by Type:
Global Food Waste Management Market by Process:
Global Food Waste Management Market by Application:
Global Food Waste Management Market by Region:
Research has its special purpose to undertake marketing efficiently. In this competitive scenario, businesses need information across all industry verticals; the information about customer wants, market demand, competition, industry trends, distribution channels etc. This information needs to be updated regularly because businesses operate in a dynamic environment. Our organization, The Brainy Insights incorporates scientific and systematic research procedures in order to get proper market insights and industry analysis for overall business success. The analysis consists of studying the market from a miniscule level wherein we implement statistical tools which helps us in examining the data with accuracy and precision.
Our research reports feature both; quantitative and qualitative aspects for any market. Qualitative information for any market research process are fundamental because they reveal the customer needs and wants, usage and consumption for any product/service related to a specific industry. This in turn aids the marketers/investors in knowing certain perceptions of the customers. Qualitative research can enlighten about the different product concepts and designs along with unique service offering that in turn, helps define marketing problems and generate opportunities. On the other hand, quantitative research engages with the data collection process through interviews, e-mail interactions, surveys and pilot studies. Quantitative aspects for the market research are useful to validate the hypotheses generated during qualitative research method, explore empirical patterns in the data with the help of statistical tools, and finally make the market estimations.
The Brainy Insights offers comprehensive research and analysis, based on a wide assortment of factual insights gained through interviews with CXOs and global experts and secondary data from reliable sources. Our analysts and industry specialist assume vital roles in building up statistical tools and analysis models, which are used to analyse the data and arrive at accurate insights with exceedingly informative research discoveries. The data provided by our organization have proven precious to a diverse range of companies, facilitating them to address issues such as determining which products/services are the most appealing, whether or not customers use the product in the manner anticipated, the purchasing intentions of the market and many others.
Our research methodology encompasses an idyllic combination of primary and secondary initiatives. Key phases involved in this process are listed below:

The phase involves the gathering and collecting of market data and its related information with the help of different sources & research procedures.

The data procurement stage involves in data gathering and collecting through various data sources.
This stage involves in extensive research. These data sources includes:
Purchased Database: Purchased databases play a crucial role in estimating the market sizes irrespective of the domain. Our purchased database includes:
Primary Research: The Brainy Insights interacts with leading companies and experts of the concerned domain to develop the analyst team’s market understanding and expertise. It improves and substantiates every single data presented in the market reports. Primary research mainly involves in telephonic interviews, E-mail interactions and face-to-face interviews with the raw material providers, manufacturers/producers, distributors, & independent consultants. The interviews that we conduct provides valuable data on market size and industry growth trends prevailing in the market. Our organization also conducts surveys with the various industry experts in order to gain overall insights of the industry/market. For instance, in healthcare industry we conduct surveys with the pharmacists, doctors, surgeons and nurses in order to gain insights and key information of a medical product/device/equipment which the customers are going to usage. Surveys are conducted in the form of questionnaire designed by our own analyst team. Surveys plays an important role in primary research because surveys helps us to identify the key target audiences of the market. Additionally, surveys helps to identify the key target audience engaged with the market. Our survey team conducts the survey by targeting the key audience, thus gaining insights from them. Based on the perspectives of the customers, this information is utilized to formulate market strategies. Moreover, market surveys helps us to understand the current competitive situation of the industry. To be precise, our survey process typically involve with the 360 analysis of the market. This analytical process begins by identifying the prospective customers for a product or service related to the market/industry to obtain data on how a product/service could fit into customers’ lives.

Secondary Research: The secondary data sources includes information published by the on-profit organizations such as World bank, WHO, company fillings, investor presentations, annual reports, national government documents, statistical databases, blogs, articles, white papers and others. From the annual report, we analyse a company’s revenue to understand the key segment and market share of that organization in a particular region. We analyse the company websites and adopt the product mapping technique which is important for deriving the segment revenue. In the product mapping method, we select and categorize the products offered by the companies catering to domain specific market, deduce the product revenue for each of the companies so as to get overall estimation of the market size. We also source data and analyses trends based on information received from supply side and demand side intermediaries in the value chain. The supply side denotes the data gathered from supplier, distributor, wholesaler and the demand side illustrates the data gathered from the end customers for respective market domain.

The supply side for a domain specific market is analysed by:
The demand side for the market is estimated through:
In-house Library: Apart from these third-party sources, we have our in-house library of qualitative and quantitative information. Our in-house database includes market data for various industry and domains. These data are updated on regular basis as per the changing market scenario. Our library includes, historic databases, internal audit reports and archives.
Sometimes there are instances where there is no metadata or raw data available for any domain specific market. For those cases, we use our expertise to forecast and estimate the market size in order to generate comprehensive data sets. Our analyst team adopt a robust research technique in order to produce the estimates:
Data Synthesis: This stage involves the analysis & mapping of all the information obtained from the previous step. It also involves in scrutinizing the data for any discrepancy observed while data gathering related to the market. The data is collected with consideration to the heterogeneity of sources. Robust scientific techniques are in place for synthesizing disparate data sets and provide the essential contextual information that can orient market strategies. The Brainy Insights has extensive experience in data synthesis where the data passes through various stages:


Market Deduction & Formulation: The final stage comprises of assigning data points at appropriate market spaces so as to deduce feasible conclusions. Analyst perspective & subject matter expert based holistic form of market sizing coupled with industry analysis also plays a crucial role in this stage.
This stage involves in finalization of the market size and numbers that we have collected from data integration step. With data interpolation, it is made sure that there is no gap in the market data. Successful trend analysis is done by our analysts using extrapolation techniques, which provide the best possible forecasts for the market.
Data Validation & Market Feedback: Validation is the most important step in the process. Validation & re-validation via an intricately designed process helps us finalize data-points to be used for final calculations.

The Brainy Insights interacts with leading companies and experts of the concerned domain to develop the analyst team’s market understanding and expertise. It improves and substantiates every single data presented in the market reports. The data validation interview and discussion panels are typically composed of the most experienced industry members. The participants include, however, are not limited to:
Moreover, we always validate our data and findings through primary respondents from all the major regions we are working on.


Free Customization
Fortune 500 Clients
Free Yearly Update On Purchase Of Multi/Corporate License
Companies Served Till Date