- +1-315-215-1633
- sales@thebrainyinsights.com

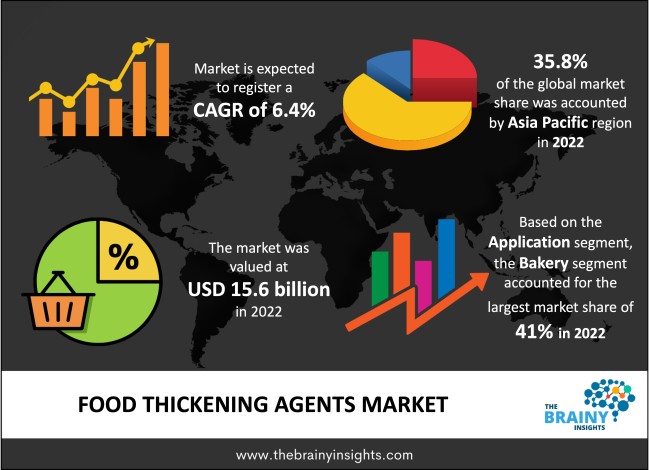
The global Food Thickening Agents market was valued at USD 15.6 billion in 2022 and growing at a CAGR of 6.4% from 2023 to 2032. The market is expected to reach USD 28.9 billion by 2032. This increase in demand for food-thickening agents is being driven by the product's increased applicability in beverage and food applications, as well as rising consumer awareness of health and wellbeing. Product innovation, shifting customer tastes for high-quality products, and stricter government food laws are all likely to boost the market growth. Favorable government laws for the expansion of the beverage and food sector are expected to boost demand throughout the forecast period.
Food thickening agents are compounds that are added to a combination of food to raise its viscosity without changing its other qualities significantly. It enhances the suspension of other components and boosts the product's stability. Thickeners are used in the food business to improve a variety of basic characteristics of food items such as density, texture, volume, stability, and taste.
Get an overview of this study by requesting a free sample
As customers' lives become more hectic, the desire for fast and quick-to-prepare foods grows. Food thickening agents are commonly used to improve the texture, stability, and shelf life of convenience foods. Furthermore, consumers are becoming more conscious of the substances in their food and are increasingly seeking natural and clean-labeling items. Food thickening agents developed from natural sources and free from artificial ingredients are in great demand.
Many food thickeners are produced from natural sources, such as starches and gums, and their availability is influenced by factors such as weather and harvest yields. This might lead to price shifts and supply chain problems. Furthermore, some food-thickening agents, such as carrageenan, have been linked to health issues such as digestive issues and inflammation. As a result, there has been a consumer reaction and a trend toward alternate components.
As customers seek more plant-based and natural ingredients, there is a chance to create novel food-thickening agents derived from plant sources, such as seaweed or legumes. Furthermore, in growing regions such as Asia-Pacific and Latin America, demand for convenience meals and processed foods is expanding. This opens up the possibility of expanding the usage of food-thickening agents in these areas.
North America led the market in 2022 with a share of more than 38.0%, owing to significant demand for the product from different sectors in the United States and Canada. The highly developed food and beverage sector in the United States and Canada dominates the North American market. The existence of many global food processing and manufacturing enterprises further benefits the industry, resulting in greater demand for the product. In recent years, there has been an increase in demand for items such as pastries, muffins, and cupcakes in North America. Through the use of various thickeners, players in the baking and confectionery industries are introducing innovation into their goods. Furthermore, the region's need for bread and confectionery items is increasing.
Asia Pacific Region Food Thickening Agents Market Share in 2022 - 35.8%
www.thebrainyinsights.com
Check the geographical analysis of this market by requesting a free sample
Hydrocolloid segment is likely to dominate the global market with a CAGR of 8.2% over the forecast period. Carrageenan gum, xanthan gum, guar gum, locust bean gum, pectin, alginate, and beta-glucan are some of the hydrocolloids used as food thickeners. The fiber-rich characteristic of hydrocolloids under low pH enhances their applicability in the food and beverage industries. Hydrocolloids are widely used as food additives and thickeners, such as a sugar substitute in whipped creams and steamed bread, a wheat flour substitute in cookies, a coating material in nuts and dried fish, a food stabilizer in whipped cream, a bulking agent in ice cream and yogurt, and a starch dispersion agent in rice.
Throughout the projected period, the plant-based category is expected to grow at a CAGR of 7.6% over the forecast period. Due to their great efficiency and affordable prices, plant-based goods are the most widely utilized ingredients in most applications, including bakery, confectionery, and ready-to-eat meals, among others. Plant-based food thickeners including cornstarch, tapioca, agar, xanthan gum, rice flour, and pectin are some of the more popular ones. Due to the growing trend of veganism and vegetarian diets, food thickeners made from plants are sustainable and in high demand from customers, especially in food items like bakery, confectionery, and processed food. The category is anticipated to grow during the projected period due to the simple availability of raw materials for the manufacturing of plant-based food thickeners as well as customer demand for the product.
Bakery segment dominated the global market with a market share of 41% in 2022. During the forecast period, the category is likely to maintain its dominance. Increasing demand for natural and organic baked products, as well as the trend toward healthier snacking, are likely to fuel demand for food thickeners throughout the forecast period. Increasing demand for convenience meals, as a result of increased consumer awareness of items with unusual and traditional flavors, is likely to drive the food thickeners market throughout the forecast period. Rising disposable incomes, along with changing lifestyles as a result of increased urbanization, have resulted in a shift in food consumption habits, which should drive rising demand throughout the forecast period.
| Attribute | Description |
|---|---|
| Market Size | Revenue (USD Billion) |
| Market size value in 2022 | USD 15.6 Billion |
| Market size value in 2032 | USD 28.9 Billion |
| CAGR (2023 to 2032) | 6.4% |
| Historical data | 2019-2021 |
| Base Year | 2022 |
| Forecast | 2023-2032 |
| Regional Segments | The regions analyzed for the market are Asia Pacific, Europe, South America, North America, and Middle East & Africa. Furthermore, the regions are further analyzed at the country level. |
| Segments | Type, Source, Application |
As per The Brainy Insights, the size of the food thickening agents market was valued at USD 15.6 billion in 2022 to USD 28.9 billion by 2032.
The global food thickening agents market is growing at a CAGR of 6.4% during the forecast period 2023-2032.
The Asia Pacific region emerged as the largest market for the food thickening agents.
The rise in consumer awareness will influence the market's growth.
1. Introduction
1.1. Objectives of the Study
1.2. Market Definition
1.3. Research Scope
1.4. Currency
1.5. Key Target Audience
2. Research Methodology and Assumptions
3. Executive Summary
4. Premium Insights
4.1. Porter’s Five Forces Analysis
4.2. Value Chain Analysis
4.3. Top Investment Pockets
4.3.1. Market Attractiveness Analysis by Type
4.3.2. Market Attractiveness Analysis by Source
4.3.3. Market Attractiveness Analysis by Application
4.3.4. Market Attractiveness Analysis by Region
4.4. Industry Trends
5. Market Dynamics
5.1. Market Evaluation
5.2. Drivers
5.2.1. Rise in consumer awareness
5.3. Restraints
5.3.1. Fluctuating raw material prices
5.4. Opportunities
5.4.1. Rise in demand of plant based products
6. Global Food Thickening Agents Market Analysis and Forecast, By Type
6.1. Segment Overview
6.2. Protein
6.3. Starch
6.4. Hydrocolloids
7. Global Food Thickening Agents Market Analysis and Forecast, By Source
7.1. Segment Overview
7.2. Plant
7.3. Animal
7.4. Microbial
8. Global Food Thickening Agents Market Analysis and Forecast, By Application
8.1. Segment Overview
8.2. Bakery
8.3. Confectionery
8.4. Dairy
8.5. Sauces
8.6. Convenience food
9. Global Food Thickening Agents Market Analysis and Forecast, By Regional Analysis
9.1. Segment Overview
9.2. North America
9.2.1. U.S.
9.2.2. Canada
9.2.3. Mexico
9.3. Europe
9.3.1. Germany
9.3.2. France
9.3.3. U.K.
9.3.4. Italy
9.3.5. Spain
9.4. Asia-Pacific
9.4.1. Japan
9.4.2. China
9.4.3. India
9.5. South America
9.5.1. Brazil
9.6. Middle East and Africa
9.6.1. UAE
9.6.2. South Africa
10. Global Food Thickening Agents Market-Competitive Landscape
10.1. Overview
10.2. Market Share of Key Players in the Food Thickening Agents Market
10.2.1. Global Company Market Share
10.2.2. North America Company Market Share
10.2.3. Europe Company Market Share
10.2.4. APAC Company Market Share
10.3. Competitive Situations and Trends
10.3.1. Product Launches and Developments
10.3.2. Partnerships, Collaborations, and Agreements
10.3.3. Mergers & Acquisitions
10.3.4. Expansions
11. Company Profiles
11.1. TIC Gums, Inc.
11.1.1. Business Overview
11.1.2. Company Snapshot
11.1.3. Company Market Share Analysis
11.1.4. Company Product Portfolio
11.1.5. Recent Developments
11.1.6. SWOT Analysis
11.2. FDL Limited
11.2.1. Business Overview
11.2.2. Company Snapshot
11.2.3. Company Market Share Analysis
11.2.4. Company Product Portfolio
11.2.5. Recent Developments
11.2.6. SWOT Analysis
11.3. Naturex S.A.
11.3.1. Business Overview
11.3.2. Company Snapshot
11.3.3. Company Market Share Analysis
11.3.4. Company Product Portfolio
11.3.5. Recent Developments
11.3.6. SWOT Analysis
11.4. Medline Industries, Inc.
11.4.1. Business Overview
11.4.2. Company Snapshot
11.4.3. Company Market Share Analysis
11.4.4. Company Product Portfolio
11.4.5. Recent Developments
11.4.6. SWOT Analysis
11.5. Darling Ingredients Inc.
11.5.1. Business Overview
11.5.2. Company Snapshot
11.5.3. Company Market Share Analysis
11.5.4. Company Product Portfolio
11.5.5. Recent Developments
11.5.6. SWOT Analysis
11.6. Cargill, Inc.
11.6.1. Business Overview
11.6.2. Company Snapshot
11.6.3. Company Market Share Analysis
11.6.4. Company Product Portfolio
11.6.5. Recent Developments
11.6.6. SWOT Analysis
11.7. Archer Daniels Midland Company
11.7.1. Business Overview
11.7.2. Company Snapshot
11.7.3. Company Market Share Analysis
11.7.4. Company Product Portfolio
11.7.5. Recent Developments
11.7.6. SWOT Analysis
11.8. DuPont De Nemours, Inc.
11.8.1. Business Overview
11.8.2. Company Snapshot
11.8.3. Company Market Share Analysis
11.8.4. Company Product Portfolio
11.8.5. Recent Developments
11.8.6. SWOT Analysis
11.9. Tate & Lyle PLC
11.9.1. Business Overview
11.9.2. Company Snapshot
11.9.3. Company Market Share Analysis
11.9.4. Company Product Portfolio
11.9.5. Recent Developments
11.9.6. SWOT Analysis
11.10. CP Kelco
11.10.1. Business Overview
11.10.2. Company Snapshot
11.10.3. Company Market Share Analysis
11.10.4. Company Product Portfolio
11.10.5. Recent Developments
11.10.6. SWOT Analysis
11.11. Kerry Inc.
11.11.1. Business Overview
11.11.2. Company Snapshot
11.11.3. Company Market Share Analysis
11.11.4. Company Product Portfolio
11.11.5. Recent Developments
11.11.6. SWOT Analysis
11.12. Ingredion Incorporated
11.12.1. Business Overview
11.12.2. Company Snapshot
11.12.3. Company Market Share Analysis
11.12.4. Company Product Portfolio
11.12.5. Recent Developments
11.12.6. SWOT Analysis
11.13. Ashland
11.13.1. Business Overview
11.13.2. Company Snapshot
11.13.3. Company Market Share Analysis
11.13.4. Company Product Portfolio
11.13.5. Recent Developments
11.13.6. SWOT Analysis
List of Table
1. Global Food Thickening Agents Market, By Type, 2019-2032 (USD Billion)
2. Global Protein Food Thickening Agents Market, By Region, 2019-2032 (USD Billion)
3. Global Starch Food Thickening Agents Market, By Region, 2019-2032 (USD Billion)
4. Global Hydrocolloids Food Thickening Agents Market, By Region, 2019-2032 (USD Billion)
5. Global Food Thickening Agents Market, By Source, 2019-2032 (USD Billion)
6. Global Plant Food Thickening Agents Market, By Region, 2019-2032 (USD Billion)
7. Global Animal Food Thickening Agents Market, By Region, 2019-2032 (USD Billion)
8. Global Microbial Food Thickening Agents Market, By Region, 2019-2032 (USD Billion)
9. Global Food Thickening Agents Market, By Application, 2019-2032 (USD Billion)
10. Global Bakery Food Thickening Agents Market, By Region, 2019-2032 (USD Billion)
11. Global Confectionery Food Thickening Agents Market, By Region, 2019-2032 (USD Billion)
12. Global Dairy Food Thickening Agents Market, By Region, 2019-2032 (USD Billion)
13. Global Sauces Food Thickening Agents Market, By Region, 2019-2032 (USD Billion)
14. Global Convenience Food, Food Thickening Agents Market, By Region, 2019-2032 (USD Billion)
15. Global Food Thickening Agents Market, By Region, 2019-2032 (USD Billion)
16. North America Food Thickening Agents Market, By Type, 2019-2032 (USD Billion)
17. North America Food Thickening Agents Market, By Source, 2019-2032 (USD Billion)
18. North America Food Thickening Agents Market, By Application, 2019-2032 (USD Billion)
19. U.S. Food Thickening Agents Market, By Type, 2019-2032 (USD Billion)
20. U.S. Food Thickening Agents Market, By Source, 2019-2032 (USD Billion)
21. U.S. Food Thickening Agents Market, By Application, 2019-2032 (USD Billion)
22. Canada Food Thickening Agents Market, By Type, 2019-2032 (USD Billion)
23. Canada Food Thickening Agents Market, By Source, 2019-2032 (USD Billion)
24. Canada Food Thickening Agents Market, By Application, 2019-2032 (USD Billion)
25. Mexico Food Thickening Agents Market, By Type, 2019-2032 (USD Billion)
26. Mexico Food Thickening Agents Market, By Source, 2019-2032 (USD Billion)
27. Mexico Food Thickening Agents Market, By Application, 2019-2032 (USD Billion)
28. Europe Food Thickening Agents Market, By Type, 2019-2032 (USD Billion)
29. Europe Food Thickening Agents Market, By Source, 2019-2032 (USD Billion)
30. Europe Food Thickening Agents Market, By Application, 2019-2032 (USD Billion)
31. Germany Food Thickening Agents Market, By Type, 2019-2032 (USD Billion)
32. Germany Food Thickening Agents Market, By Source, 2019-2032 (USD Billion)
33. Germany Food Thickening Agents Market, By Application, 2019-2032 (USD Billion)
34. France Food Thickening Agents Market, By Type, 2019-2032 (USD Billion)
35. France Food Thickening Agents Market, By Source, 2019-2032 (USD Billion)
36. France Food Thickening Agents Market, By Application, 2019-2032 (USD Billion)
37. U.K. Food Thickening Agents Market, By Type, 2019-2032 (USD Billion)
38. U.K. Food Thickening Agents Market, By Source, 2019-2032 (USD Billion)
39. U.K. Food Thickening Agents Market, By Application, 2019-2032 (USD Billion)
40. Italy Food Thickening Agents Market, By Type, 2019-2032 (USD Billion)
41. Italy Food Thickening Agents Market, By Source, 2019-2032 (USD Billion)
42. Italy Food Thickening Agents Market, By Application, 2019-2032 (USD Billion)
43. Spain Food Thickening Agents Market, By Type, 2019-2032 (USD Billion)
44. Spain Food Thickening Agents Market, By Source, 2019-2032 (USD Billion)
45. Spain Food Thickening Agents Market, By Application, 2019-2032 (USD Billion)
46. Asia Pacific Food Thickening Agents Market, By Type, 2019-2032 (USD Billion)
47. Asia Pacific Food Thickening Agents Market, By Source, 2019-2032 (USD Billion)
48. Asia Pacific Food Thickening Agents Market, By Application, 2019-2032 (USD Billion)
49. Japan Food Thickening Agents Market, By Type, 2019-2032 (USD Billion)
50. Japan Food Thickening Agents Market, By Source, 2019-2032 (USD Billion)
51. Japan Food Thickening Agents Market, By Application, 2019-2032 (USD Billion)
52. China Food Thickening Agents Market, By Type, 2019-2032 (USD Billion)
53. China Food Thickening Agents Market, By Source, 2019-2032 (USD Billion)
54. China Food Thickening Agents Market, By Application, 2019-2032 (USD Billion)
55. India Food Thickening Agents Market, By Type, 2019-2032 (USD Billion)
56. India Food Thickening Agents Market, By Source, 2019-2032 (USD Billion)
57. India Food Thickening Agents Market, By Application, 2019-2032 (USD Billion)
58. South America Food Thickening Agents Market, By Type, 2019-2032 (USD Billion)
59. South America Food Thickening Agents Market, By Source, 2019-2032 (USD Billion)
60. South America Food Thickening Agents Market, By Application, 2019-2032 (USD Billion)
61. Brazil Food Thickening Agents Market, By Type, 2019-2032 (USD Billion)
62. Brazil Food Thickening Agents Market, By Source, 2019-2032 (USD Billion)
63. Brazil Food Thickening Agents Market, By Application, 2019-2032 (USD Billion)
64. Middle East and Africa Food Thickening Agents Market, By Type, 2019-2032 (USD Billion)
65. Middle East and Africa Food Thickening Agents Market, By Source, 2019-2032 (USD Billion)
66. Middle East and Africa Food Thickening Agents Market, By Application, 2019-2032 (USD Billion)
67. UAE Food Thickening Agents Market, By Type, 2019-2032 (USD Billion)
68. UAE Food Thickening Agents Market, By Source, 2019-2032 (USD Billion)
69. UAE Food Thickening Agents Market, By Application, 2019-2032 (USD Billion)
70. South Africa Food Thickening Agents Market, By Type, 2019-2032 (USD Billion)
71. South Africa Food Thickening Agents Market, By Source, 2019-2032 (USD Billion)
72. South Africa Food Thickening Agents Market, By Application, 2019-2032 (USD Billion)
List of Figures
1. Global Food Thickening Agents Market Segmentation
2. Food Thickening Agents Market: Research Methodology
3. Market Size Estimation Methodology: Bottom-Up Approach
4. Market Size Estimation Methodology: Top-Down Approach
5. Data Triangulation
6. Porter’s Five Forces Analysis
7. Value Chain Analysis
8. Global Food Thickening Agents Market Attractiveness Analysis by Type
9. Global Food Thickening Agents Market Attractiveness Analysis by Source
10. Global Food Thickening Agents Market Attractiveness Analysis by Application
11. Global Food Thickening Agents Market Attractiveness Analysis by Region
12. Global Food Thickening Agents Market: Dynamics
13. Global Food Thickening Agents Market Share by Type (2022 & 2032)
14. Global Food Thickening Agents Market Share by Source (2022 & 2032)
15. Global Food Thickening Agents Market Share by Application (2022 & 2032)
16. Global Food Thickening Agents Market Share by Regions (2022 & 2032)
17. Global Food Thickening Agents Market Share by Company (2022)
This study forecasts revenue at global, regional, and country levels from 2019 to 2032. The Brainy Insights has segmented the global food thickening agents market based on below-mentioned segments:
Global Food Thickening Agents Market by Type:
Global Food Thickening Agents Market by Source:
Global Food Thickening Agents Market by Application:
Global Food Thickening Agents Market by Region:
Research has its special purpose to undertake marketing efficiently. In this competitive scenario, businesses need information across all industry verticals; the information about customer wants, market demand, competition, industry trends, distribution channels etc. This information needs to be updated regularly because businesses operate in a dynamic environment. Our organization, The Brainy Insights incorporates scientific and systematic research procedures in order to get proper market insights and industry analysis for overall business success. The analysis consists of studying the market from a miniscule level wherein we implement statistical tools which helps us in examining the data with accuracy and precision.
Our research reports feature both; quantitative and qualitative aspects for any market. Qualitative information for any market research process are fundamental because they reveal the customer needs and wants, usage and consumption for any product/service related to a specific industry. This in turn aids the marketers/investors in knowing certain perceptions of the customers. Qualitative research can enlighten about the different product concepts and designs along with unique service offering that in turn, helps define marketing problems and generate opportunities. On the other hand, quantitative research engages with the data collection process through interviews, e-mail interactions, surveys and pilot studies. Quantitative aspects for the market research are useful to validate the hypotheses generated during qualitative research method, explore empirical patterns in the data with the help of statistical tools, and finally make the market estimations.
The Brainy Insights offers comprehensive research and analysis, based on a wide assortment of factual insights gained through interviews with CXOs and global experts and secondary data from reliable sources. Our analysts and industry specialist assume vital roles in building up statistical tools and analysis models, which are used to analyse the data and arrive at accurate insights with exceedingly informative research discoveries. The data provided by our organization have proven precious to a diverse range of companies, facilitating them to address issues such as determining which products/services are the most appealing, whether or not customers use the product in the manner anticipated, the purchasing intentions of the market and many others.
Our research methodology encompasses an idyllic combination of primary and secondary initiatives. Key phases involved in this process are listed below:

The phase involves the gathering and collecting of market data and its related information with the help of different sources & research procedures.

The data procurement stage involves in data gathering and collecting through various data sources.
This stage involves in extensive research. These data sources includes:
Purchased Database: Purchased databases play a crucial role in estimating the market sizes irrespective of the domain. Our purchased database includes:
Primary Research: The Brainy Insights interacts with leading companies and experts of the concerned domain to develop the analyst team’s market understanding and expertise. It improves and substantiates every single data presented in the market reports. Primary research mainly involves in telephonic interviews, E-mail interactions and face-to-face interviews with the raw material providers, manufacturers/producers, distributors, & independent consultants. The interviews that we conduct provides valuable data on market size and industry growth trends prevailing in the market. Our organization also conducts surveys with the various industry experts in order to gain overall insights of the industry/market. For instance, in healthcare industry we conduct surveys with the pharmacists, doctors, surgeons and nurses in order to gain insights and key information of a medical product/device/equipment which the customers are going to usage. Surveys are conducted in the form of questionnaire designed by our own analyst team. Surveys plays an important role in primary research because surveys helps us to identify the key target audiences of the market. Additionally, surveys helps to identify the key target audience engaged with the market. Our survey team conducts the survey by targeting the key audience, thus gaining insights from them. Based on the perspectives of the customers, this information is utilized to formulate market strategies. Moreover, market surveys helps us to understand the current competitive situation of the industry. To be precise, our survey process typically involve with the 360 analysis of the market. This analytical process begins by identifying the prospective customers for a product or service related to the market/industry to obtain data on how a product/service could fit into customers’ lives.

Secondary Research: The secondary data sources includes information published by the on-profit organizations such as World bank, WHO, company fillings, investor presentations, annual reports, national government documents, statistical databases, blogs, articles, white papers and others. From the annual report, we analyse a company’s revenue to understand the key segment and market share of that organization in a particular region. We analyse the company websites and adopt the product mapping technique which is important for deriving the segment revenue. In the product mapping method, we select and categorize the products offered by the companies catering to domain specific market, deduce the product revenue for each of the companies so as to get overall estimation of the market size. We also source data and analyses trends based on information received from supply side and demand side intermediaries in the value chain. The supply side denotes the data gathered from supplier, distributor, wholesaler and the demand side illustrates the data gathered from the end customers for respective market domain.

The supply side for a domain specific market is analysed by:
The demand side for the market is estimated through:
In-house Library: Apart from these third-party sources, we have our in-house library of qualitative and quantitative information. Our in-house database includes market data for various industry and domains. These data are updated on regular basis as per the changing market scenario. Our library includes, historic databases, internal audit reports and archives.
Sometimes there are instances where there is no metadata or raw data available for any domain specific market. For those cases, we use our expertise to forecast and estimate the market size in order to generate comprehensive data sets. Our analyst team adopt a robust research technique in order to produce the estimates:
Data Synthesis: This stage involves the analysis & mapping of all the information obtained from the previous step. It also involves in scrutinizing the data for any discrepancy observed while data gathering related to the market. The data is collected with consideration to the heterogeneity of sources. Robust scientific techniques are in place for synthesizing disparate data sets and provide the essential contextual information that can orient market strategies. The Brainy Insights has extensive experience in data synthesis where the data passes through various stages:


Market Deduction & Formulation: The final stage comprises of assigning data points at appropriate market spaces so as to deduce feasible conclusions. Analyst perspective & subject matter expert based holistic form of market sizing coupled with industry analysis also plays a crucial role in this stage.
This stage involves in finalization of the market size and numbers that we have collected from data integration step. With data interpolation, it is made sure that there is no gap in the market data. Successful trend analysis is done by our analysts using extrapolation techniques, which provide the best possible forecasts for the market.
Data Validation & Market Feedback: Validation is the most important step in the process. Validation & re-validation via an intricately designed process helps us finalize data-points to be used for final calculations.

The Brainy Insights interacts with leading companies and experts of the concerned domain to develop the analyst team’s market understanding and expertise. It improves and substantiates every single data presented in the market reports. The data validation interview and discussion panels are typically composed of the most experienced industry members. The participants include, however, are not limited to:
Moreover, we always validate our data and findings through primary respondents from all the major regions we are working on.


Free Customization
Fortune 500 Clients
Free Yearly Update On Purchase Of Multi/Corporate License
Companies Served Till Date