- +1-315-215-1633
- sales@thebrainyinsights.com

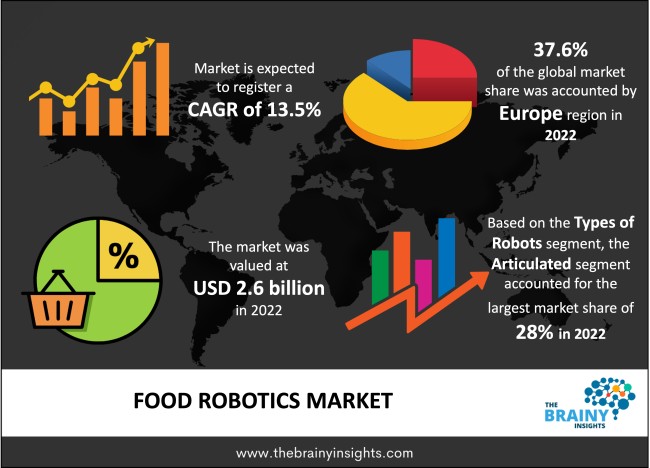
The global food robotics market was valued at USD 2.6 billion in 2022, growing at a CAGR of 13.5% from 2023 to 2032. The market is expected to reach USD 9.2 billion by 2032. The growth of the food robotics market is due to the rising demand for packaged foods and the growing emphasis on increasing the efficiency of operations in food production.
The term "food robotics" describes the sophisticated machinery used in the food and beverage sector to carry out intricate tasks, including palletizing, packing, and picking. Fictional robots are already a reality due to significant technical developments in several fields. The need for increased efficiency is driving the use of robots to automate jobs, and as a result, they are becoming a necessary component of many different businesses. The need for robotics systems in the food sector is driven by the quick advancements in robotics technology and the introduction of cutting-edge automation technologies. Palletizing, packing, and processing are just a few industrial activities that the technologies help users automate. They also assist in preserving output quality and lessen industries' dependency on labour. The need for automation solutions has increased due to the steps taken by different governments to ensure food safety. The food manufacturing and processing industries are benefiting from technology in meeting their production goals and ensuring consistent product quality.
Get an overview of this study by requesting a free sample
In February 2022, A teaching-less robot system technology was introduced by Mitsubishi Electric Corporation and is intended especially for use in food processing facilities. Without human oversight, these robots complete comparable jobs at human speed, such as sorting and arrangement.
In April 2021, Comau and Rockwell Automation Inc. announced their partnership. This partnership's goal was to simplify lifecycle management and processing in the food and beverage sectors.
The rising adoption of digitization in the food industry- Using IoT and AI, businesses can now achieve high food safety standards, enhance traceability, save waste, and minimise expenses and hazards at different phases of food processing and packaging. In recent years, digitalization has become a key enabler for automation, and artificial intelligence (AI) has increased staff productivity to raise operational productivity. This is expected to drive the market's growth during the forecast period.
Lack of skilled workforce- The adoption and application of food robotics demand a skilled labour force. The disciplines needed for installing and upkeep robots, including electrical, mechanical, software, and embedded, need more supply. Furthermore, there is a need for more highly skilled workers with the specialised knowledge required to create extremely valuable robots that are combined with cutting-edge technologies. Thus, the need for a more skilled workforce is expected to hinder the market's growth during the forecast period.
Growing application- Food robotics systems are widely utilised in various industries, including bakery and confectionery, meat, seafood, poultry, dairy, and grains, because of their inherent advantages, which include quality control, durability, sanitation, and preservation. The product is gaining traction in end-use sectors, especially in Asia Pacific, where consumer income and increased domestic production provide growth opportunities during the forecast period.
The regions analyzed for the market include North America, Europe, South America, Asia Pacific, the Middle East, and Africa. Europe emerged as the largest global food robotics market, with a 37.6% market revenue share in 2022.
The European market accounted for the largest market share during the forecast period owing to the region's increased labour costs and improved food safety regulations. The improved regulatory measures for food safety increase the need for automated systems in the food industry, paving the way for food robotics. Furthermore, increasing disposable income, the growing tendency of the nuclear family, and urban lifestyle changes also add impetus to the market's growth in the region during the forecast period.
Europe Region Food Robotics Market Share in 2022 - 37.6%
www.thebrainyinsights.com
Check the geographical analysis of this market by requesting a free sample
The types of robots segment is divided into parallel, cylindrical, articulated, SCARA, and others. The articulated segment dominated the market, with a market share of around 28% in 2022. The articulated robotics segment has been growing owing to the extensive use of this system in material handling and palletizing.
The payload segment is divided into medium, low, and heavy. The heavy payload segment dominated the market, with a market share of around 41% in 2022. The segment has been growing owing to the increased technological advancements and improved R&D of this payload.
The application segment is divided into repackaging, picking, packaging, palletizing, processing, and others. The packaging segment dominated the market, with a market share of around 22% in 2022. The primary driver of the segment's growth is the rising demand for packaged foods. Increased production capacity, decreased waste, and consistent packaging are made possible by applying robot systems in packaging.
| Attribute | Description |
|---|---|
| Market Size | Revenue (USD Billion) |
| Market size value in 2022 | USD 2.6 Billion |
| Market size value in 2032 | USD 9.2 Billion |
| CAGR (2023 to 2032) | 13.5% |
| Historical data | 2019-2021 |
| Base Year | 2022 |
| Forecast | 2023-2032 |
| Region | The regions analyzed for the market are Asia Pacific, Europe, South America, North America, and Middle East & Africa. Furthermore, the regions are further analyzed at the country level. |
| Segments | Types of Robots, Payload, Application |
As per The Brainy Insights, the size of the food robotics market was valued at USD 2.6 billion in 2022 to USD 9.2 billion by 2032.
The global food robotics market is growing at a CAGR of 13.5% during the forecast period 2023-2032.
Europe emerged as the largest food robotics market.
1. Introduction
1.1. Objectives of the Study
1.2. Market Definition
1.3. Research Scope
1.4. Currency
1.5. Key Target Audience
2. Research Methodology and Assumptions
3. Executive Summary
4. Premium Insights
4.1. Porter’s Five Forces Analysis
4.2. Value Chain Analysis
4.3. Top Investment Pockets
4.3.1. Market Attractiveness Analysis by Types of Robots
4.3.2. Market Attractiveness Analysis by Payload
4.3.3. Market Attractiveness Analysis by Application
4.3.4. Market Attractiveness Analysis by Region
4.4. Industry Trends
5. Market Dynamics
5.1. Market Evaluation
5.2. Drivers
5.2.1. The rising adoption of digitization in the food industry
5.3. Restraints
5.3.1. Lack of skilled workforce
5.4. Opportunities
5.4.1. Growing application
5.5. Challenges
5.5.1. High installation cost
6. Global Food Robotics Market Analysis and Forecast, By Types of Robots
6.1. Segment Overview
6.2. Parallel
6.3. Cylindrical
6.4. Articulated
6.5. SCARA
6.6. Others
7. Global Food Robotics Market Analysis and Forecast, By Payload
7.1. Segment Overview
7.2. Medium
7.3. Low
7.4. Heavy
8. Global Food Robotics Market Analysis and Forecast, By Application
8.1. Segment Overview
8.2. Repackaging
8.3. Picking
8.4. Packaging
8.5. Palletizing
8.6. Processing
8.7. Others
9. Global Food Robotics Market Analysis and Forecast, By Regional Analysis
9.1. Segment Overview
9.2. North America
9.2.1. U.S.
9.2.2. Canada
9.2.3. Mexico
9.3. Europe
9.3.1. Germany
9.3.2. France
9.3.3. U.K.
9.3.4. Italy
9.3.5. Spain
9.4. Asia-Pacific
9.4.1. Japan
9.4.2. China
9.4.3. India
9.5. South America
9.5.1. Brazil
9.6. Middle East and Africa
9.6.1. UAE
9.6.2. South Africa
10. Global Food Robotics Market-Competitive Landscape
10.1. Overview
10.2. Market Share of Key Players in Global Food Robotics Market
10.2.1. Global Company Market Share
10.2.2. North America Company Market Share
10.2.3. Europe Company Market Share
10.2.4. APAC Company Market Share
10.3. Competitive Situations and Trends
10.3.1. Product Launches and Developments
10.3.2. Partnerships, Collaborations, and Agreements
10.3.3. Mergers & Acquisitions
10.3.4. Expansions
11. Company Profiles
11.1. Kawasaki Heavy Industries Ltd.
11.1.1. Business Overview
11.1.2. Company Snapshot
11.1.3. Company Market Share Analysis
11.1.4. Company Product Portfolio
11.1.5. Recent Developments
11.1.6. SWOT Analysis
11.2. Mitsubishi Electric Corporation
11.2.1. Business Overview
11.2.2. Company Snapshot
11.2.3. Company Market Share Analysis
11.2.4. Company Product Portfolio
11.2.5. Recent Developments
11.2.6. SWOT Analysis
11.3. OMRON Corporation
11.3.1. Business Overview
11.3.2. Company Snapshot
11.3.3. Company Market Share Analysis
11.3.4. Company Product Portfolio
11.3.5. Recent Developments
11.3.6. SWOT Analysis
11.4. Staubli International AG
11.4.1. Business Overview
11.4.2. Company Snapshot
11.4.3. Company Market Share Analysis
11.4.4. Company Product Portfolio
11.4.5. Recent Developments
11.4.6. SWOT Analysis
11.5. Mayekawa Mfg. Co. Ltd.
11.5.1. Business Overview
11.5.2. Company Snapshot
11.5.3. Company Market Share Analysis
11.5.4. Company Product Portfolio
11.5.5. Recent Developments
11.5.6. SWOT Analysis
11.6. Fuji Robotics
11.6.1. Business Overview
11.6.2. Company Snapshot
11.6.3. Company Market Share Analysis
11.6.4. Company Product Portfolio
11.6.5. Recent Developments
11.6.6. SWOT Analysis
11.7. ABB Group
11.7.1. Business Overview
11.7.2. Company Snapshot
11.7.3. Company Market Share Analysis
11.7.4. Company Product Portfolio
11.7.5. Recent Developments
11.7.6. SWOT Analysis
11.8. Rockwell Automation Inc.
11.8.1. Business Overview
11.8.2. Company Snapshot
11.8.3. Company Market Share Analysis
11.8.4. Company Product Portfolio
11.8.5. Recent Developments
11.8.6. SWOT Analysis
11.9. Nachi-Fujikoshi Corporation
11.9.1. Business Overview
11.9.2. Company Snapshot
11.9.3. Company Market Share Analysis
11.9.4. Company Product Portfolio
11.9.5. Recent Developments
11.9.6. SWOT Analysis
11.10. Bastian Solutions LLC
11.10.1. Business Overview
11.10.2. Company Snapshot
11.10.3. Company Market Share Analysis
11.10.4. Company Product Portfolio
11.10.5. Recent Developments
11.10.6. SWOT Analysis
11.11. Ellison Technologies Inc.
11.11.1. Business Overview
11.11.2. Company Snapshot
11.11.3. Company Market Share Analysis
11.11.4. Company Product Portfolio
11.11.5. Recent Developments
11.11.6. SWOT Analysis
11.12. Moley Robotics
11.12.1. Business Overview
11.12.2. Company Snapshot
11.12.3. Company Market Share Analysis
11.12.4. Company Product Portfolio
11.12.5. Recent Developments
11.12.6. SWOT Analysis
List of Table
1. Global Food Robotics Market, By Types of Robots, 2019-2032 (USD Billion)
2. Global Parallel, Food Robotics Market, By Region, 2019-2032 (USD Billion)
3. Global Cylindrical, Food Robotics Market, By Region, 2019-2032 (USD Billion)
4. Global Articulated, Food Robotics Market, By Region, 2019-2032 (USD Billion)
5. Global SCARA, Food Robotics Market, By Region, 2019-2032 (USD Billion)
6. Global Others, Food Robotics Market, By Region, 2019-2032 (USD Billion)
7. Global Food Robotics Market, By Payload, 2019-2032 (USD Billion)
8. Global Medium, Food Robotics Market, By Region, 2019-2032 (USD Billion)
9. Global Low, Food Robotics Market, By Region, 2019-2032 (USD Billion)
10. Global Heavy, Food Robotics Market, By Region, 2019-2032 (USD Billion)
11. Global Food Robotics Market, By Application, 2019-2032 (USD Billion)
12. Global Repackaging, Food Robotics Market, By Region, 2019-2032 (USD Billion)
13. Global Picking, Food Robotics Market, By Region, 2019-2032 (USD Billion)
14. Global Packaging, Food Robotics Market, By Region, 2019-2032 (USD Billion)
15. Global Palletizing, Food Robotics Market, By Region, 2019-2032 (USD Billion)
16. Global Processing, Food Robotics Market, By Region, 2019-2032 (USD Billion)
17. Global Others, Food Robotics Market, By Region, 2019-2032 (USD Billion)
18. North America Food Robotics Market, By Types of Robots, 2019-2032 (USD Billion)
19. North America Food Robotics Market, By Payload, 2019-2032 (USD Billion)
20. North America Food Robotics Market, By Application, 2019-2032 (USD Billion)
21. U.S. Food Robotics Market, By Types of Robots, 2019-2032 (USD Billion)
22. U.S. Food Robotics Market, By Payload, 2019-2032 (USD Billion)
23. U.S. Food Robotics Market, By Application, 2019-2032 (USD Billion)
24. Canada Food Robotics Market, By Types of Robots, 2019-2032 (USD Billion)
25. Canada Food Robotics Market, By Payload, 2019-2032 (USD Billion)
26. Canada Food Robotics Market, By Application, 2019-2032 (USD Billion)
27. Mexico Food Robotics Market, By Types of Robots, 2019-2032 (USD Billion)
28. Mexico Food Robotics Market, By Payload, 2019-2032 (USD Billion)
29. Mexico Food Robotics Market, By Application, 2019-2032 (USD Billion)
30. Europe Food Robotics Market, By Types of Robots, 2019-2032 (USD Billion)
31. Europe Food Robotics Market, By Payload, 2019-2032 (USD Billion)
32. Europe Food Robotics Market, By Application, 2019-2032 (USD Billion)
33. Germany Food Robotics Market, By Types of Robots, 2019-2032 (USD Billion)
34. Germany Food Robotics Market, By Payload, 2019-2032 (USD Billion)
35. Germany Food Robotics Market, By Application, 2019-2032 (USD Billion)
36. France Food Robotics Market, By Types of Robots, 2019-2032 (USD Billion)
37. France Food Robotics Market, By Payload, 2019-2032 (USD Billion)
38. France Food Robotics Market, By Application, 2019-2032 (USD Billion)
39. U.K. Food Robotics Market, By Types of Robots, 2019-2032 (USD Billion)
40. U.K. Food Robotics Market, By Payload, 2019-2032 (USD Billion)
41. U.K. Food Robotics Market, By Application, 2019-2032 (USD Billion)
42. Italy Food Robotics Market, By Types of Robots, 2019-2032 (USD Billion)
43. Italy Food Robotics Market, By Payload, 2019-2032 (USD Billion)
44. Italy Food Robotics Market, By Application, 2019-2032 (USD Billion)
45. Spain Food Robotics Market, By Types of Robots, 2019-2032 (USD Billion)
46. Spain Food Robotics Market, By Payload, 2019-2032 (USD Billion)
47. Spain Food Robotics Market, By Application, 2019-2032 (USD Billion)
48. Asia Pacific Food Robotics Market, By Types of Robots, 2019-2032 (USD Billion)
49. Asia Pacific Food Robotics Market, By Payload, 2019-2032 (USD Billion)
50. Asia Pacific Food Robotics Market, By Application, 2019-2032 (USD Billion)
51. Japan Food Robotics Market, By Types of Robots, 2019-2032 (USD Billion)
52. Japan Food Robotics Market, By Payload, 2019-2032 (USD Billion)
53. Japan Food Robotics Market, By Application, 2019-2032 (USD Billion)
54. China Food Robotics Market, By Types of Robots, 2019-2032 (USD Billion)
55. China Food Robotics Market, By Payload, 2019-2032 (USD Billion)
56. China Food Robotics Market, By Application, 2019-2032 (USD Billion)
57. India Food Robotics Market, By Types of Robots, 2019-2032 (USD Billion)
58. India Food Robotics Market, By Payload, 2019-2032 (USD Billion)
59. India Food Robotics Market, By Application, 2019-2032 (USD Billion)
60. South America Food Robotics Market, By Types of Robots, 2019-2032 (USD Billion)
61. South America Food Robotics Market, By Payload, 2019-2032 (USD Billion)
62. South America Food Robotics Market, By Application, 2019-2032 (USD Billion)
63. Brazil Food Robotics Market, By Types of Robots, 2019-2032 (USD Billion)
64. Brazil Food Robotics Market, By Payload, 2019-2032 (USD Billion)
65. Brazil Food Robotics Market, By Application, 2019-2032 (USD Billion)
66. Middle East and Africa Food Robotics Market, By Types of Robots, 2019-2032 (USD Billion)
67. Middle East and Africa Food Robotics Market, By Payload, 2019-2032 (USD Billion)
68. Middle East and Africa Food Robotics Market, By Application, 2019-2032 (USD Billion)
69. UAE Food Robotics Market, By Types of Robots, 2019-2032 (USD Billion)
70. UAE Food Robotics Market, By Payload, 2019-2032 (USD Billion)
71. UAE Food Robotics Market, By Application, 2019-2032 (USD Billion)
72. South Africa Food Robotics Market, By Types of Robots, 2019-2032 (USD Billion)
73. South Africa Food Robotics Market, By Payload, 2019-2032 (USD Billion)
74. South Africa Food Robotics Market, By Application, 2019-2032 (USD Billion)
List of Figures
1. Global Food Robotics Market Segmentation
2. Global Food Robotics Market: Research Methodology
3. Market Size Estimation Methodology: Bottom-Up Approach
4. Market Size Estimation Methodology: Top-Down Approach
5. Data Triangulation
6. Porter’s Five Forces Analysis
7. Value Chain Analysis
8. Global Food Robotics Market Attractiveness Analysis by Types of Robots
9. Global Food Robotics Market Attractiveness Analysis by Payload
10. Global Food Robotics Market Attractiveness Analysis by Application
11. Global Food Robotics Market Attractiveness Analysis by Region
12. Global Food Robotics Market: Dynamics
13. Global Food Robotics Market Share by Types of Robots (2023 & 2032)
14. Global Food Robotics Market Share by Payload (2023 & 2032)
15. Global Food Robotics Market Share by Application (2023 & 2032)
16. Global Food Robotics Market Share by Regions (2023 & 2032)
17. Global Food Robotics Market Share by Company (2022)
This study forecasts global, regional, and country revenue from 2019 to 2032. The Brainy Insights has segmented the global food robotics market based on the below-mentioned segments:
Global Food Robotics Market By Types of Robots:
Global Food Robotics Market By Payload:
Global Food Robotics Market By Application:
Global Food Robotics Market By Region:
Research has its special purpose to undertake marketing efficiently. In this competitive scenario, businesses need information across all industry verticals; the information about customer wants, market demand, competition, industry trends, distribution channels etc. This information needs to be updated regularly because businesses operate in a dynamic environment. Our organization, The Brainy Insights incorporates scientific and systematic research procedures in order to get proper market insights and industry analysis for overall business success. The analysis consists of studying the market from a miniscule level wherein we implement statistical tools which helps us in examining the data with accuracy and precision.
Our research reports feature both; quantitative and qualitative aspects for any market. Qualitative information for any market research process are fundamental because they reveal the customer needs and wants, usage and consumption for any product/service related to a specific industry. This in turn aids the marketers/investors in knowing certain perceptions of the customers. Qualitative research can enlighten about the different product concepts and designs along with unique service offering that in turn, helps define marketing problems and generate opportunities. On the other hand, quantitative research engages with the data collection process through interviews, e-mail interactions, surveys and pilot studies. Quantitative aspects for the market research are useful to validate the hypotheses generated during qualitative research method, explore empirical patterns in the data with the help of statistical tools, and finally make the market estimations.
The Brainy Insights offers comprehensive research and analysis, based on a wide assortment of factual insights gained through interviews with CXOs and global experts and secondary data from reliable sources. Our analysts and industry specialist assume vital roles in building up statistical tools and analysis models, which are used to analyse the data and arrive at accurate insights with exceedingly informative research discoveries. The data provided by our organization have proven precious to a diverse range of companies, facilitating them to address issues such as determining which products/services are the most appealing, whether or not customers use the product in the manner anticipated, the purchasing intentions of the market and many others.
Our research methodology encompasses an idyllic combination of primary and secondary initiatives. Key phases involved in this process are listed below:

The phase involves the gathering and collecting of market data and its related information with the help of different sources & research procedures.

The data procurement stage involves in data gathering and collecting through various data sources.
This stage involves in extensive research. These data sources includes:
Purchased Database: Purchased databases play a crucial role in estimating the market sizes irrespective of the domain. Our purchased database includes:
Primary Research: The Brainy Insights interacts with leading companies and experts of the concerned domain to develop the analyst team’s market understanding and expertise. It improves and substantiates every single data presented in the market reports. Primary research mainly involves in telephonic interviews, E-mail interactions and face-to-face interviews with the raw material providers, manufacturers/producers, distributors, & independent consultants. The interviews that we conduct provides valuable data on market size and industry growth trends prevailing in the market. Our organization also conducts surveys with the various industry experts in order to gain overall insights of the industry/market. For instance, in healthcare industry we conduct surveys with the pharmacists, doctors, surgeons and nurses in order to gain insights and key information of a medical product/device/equipment which the customers are going to usage. Surveys are conducted in the form of questionnaire designed by our own analyst team. Surveys plays an important role in primary research because surveys helps us to identify the key target audiences of the market. Additionally, surveys helps to identify the key target audience engaged with the market. Our survey team conducts the survey by targeting the key audience, thus gaining insights from them. Based on the perspectives of the customers, this information is utilized to formulate market strategies. Moreover, market surveys helps us to understand the current competitive situation of the industry. To be precise, our survey process typically involve with the 360 analysis of the market. This analytical process begins by identifying the prospective customers for a product or service related to the market/industry to obtain data on how a product/service could fit into customers’ lives.

Secondary Research: The secondary data sources includes information published by the on-profit organizations such as World bank, WHO, company fillings, investor presentations, annual reports, national government documents, statistical databases, blogs, articles, white papers and others. From the annual report, we analyse a company’s revenue to understand the key segment and market share of that organization in a particular region. We analyse the company websites and adopt the product mapping technique which is important for deriving the segment revenue. In the product mapping method, we select and categorize the products offered by the companies catering to domain specific market, deduce the product revenue for each of the companies so as to get overall estimation of the market size. We also source data and analyses trends based on information received from supply side and demand side intermediaries in the value chain. The supply side denotes the data gathered from supplier, distributor, wholesaler and the demand side illustrates the data gathered from the end customers for respective market domain.

The supply side for a domain specific market is analysed by:
The demand side for the market is estimated through:
In-house Library: Apart from these third-party sources, we have our in-house library of qualitative and quantitative information. Our in-house database includes market data for various industry and domains. These data are updated on regular basis as per the changing market scenario. Our library includes, historic databases, internal audit reports and archives.
Sometimes there are instances where there is no metadata or raw data available for any domain specific market. For those cases, we use our expertise to forecast and estimate the market size in order to generate comprehensive data sets. Our analyst team adopt a robust research technique in order to produce the estimates:
Data Synthesis: This stage involves the analysis & mapping of all the information obtained from the previous step. It also involves in scrutinizing the data for any discrepancy observed while data gathering related to the market. The data is collected with consideration to the heterogeneity of sources. Robust scientific techniques are in place for synthesizing disparate data sets and provide the essential contextual information that can orient market strategies. The Brainy Insights has extensive experience in data synthesis where the data passes through various stages:


Market Deduction & Formulation: The final stage comprises of assigning data points at appropriate market spaces so as to deduce feasible conclusions. Analyst perspective & subject matter expert based holistic form of market sizing coupled with industry analysis also plays a crucial role in this stage.
This stage involves in finalization of the market size and numbers that we have collected from data integration step. With data interpolation, it is made sure that there is no gap in the market data. Successful trend analysis is done by our analysts using extrapolation techniques, which provide the best possible forecasts for the market.
Data Validation & Market Feedback: Validation is the most important step in the process. Validation & re-validation via an intricately designed process helps us finalize data-points to be used for final calculations.

The Brainy Insights interacts with leading companies and experts of the concerned domain to develop the analyst team’s market understanding and expertise. It improves and substantiates every single data presented in the market reports. The data validation interview and discussion panels are typically composed of the most experienced industry members. The participants include, however, are not limited to:
Moreover, we always validate our data and findings through primary respondents from all the major regions we are working on.


Free Customization
Fortune 500 Clients
Free Yearly Update On Purchase Of Multi/Corporate License
Companies Served Till Date