- +1-315-215-1633
- sales@thebrainyinsights.com

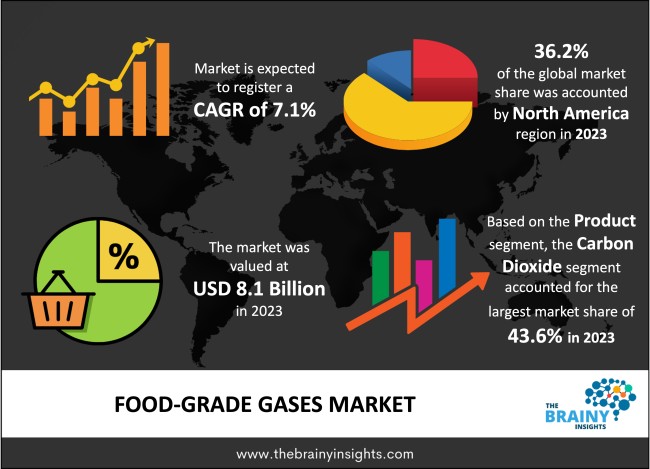
The Food-Grade Gases Market was valued at USD 8.1 billion in 2023 and grew at a CAGR of 7.1% from 2024 to 2033. Convenience food and carbonated drinks are becoming more and more popular, which is one of the main reasons driving the growth in the food-grade gases market. Food producers are using cutting-edge packaging technologies including oxygen scavenging, MAP, CAP, and active sealing as a response to consumers' growing concerns about the safety of their food. By establishing a regulated environment inside the container, these technologies protect food products' freshness and minimize the need for additives, all without sacrificing the food's quality.
The sector of the industrial gases business that concentrates on creating and providing gases appropriate for use in food processing, packaging, and preservation applications is known as the food-grade gases market. These gases are utilized to improve product quality, increase shelf life, and guarantee safety during different phases of the food production and packaging process. Strict regulatory criteria, such as those established by agencies like the European Food Safety Authority (EFSA) in Europe and the Food and Drug Administration (FDA) in the United States, are usually followed in the production and supply of food-grade gases. These regulations guarantee that the gases used in culinary applications adhere to strict safety and purity standards.
Get an overview of this study by requesting a free sample
Easy-to-prepare and eat convenience foods are becoming more and more popular due to urbanization and busy lifestyles. In order to maintain the freshness, flavor, and quality of these convenience foods, food-grade gases are used extensively throughout the production and packaging processes. Concerns regarding the safety and quality of the food they eat are also growing among consumers. Food-grade gases are used in a variety of food processing and packaging applications to ensure food product safety and quality by upholding hygienic requirements, preventing contamination, and extending shelf life.
Although food-grade gas safety and quality are guaranteed by regulatory requirements, manufacturers may face difficulties in adhering to them due to associated expenses, administrative demands, and the requirement for ongoing documentation and monitoring. Additionally, establishing facilities for the generation, distribution, and storage of gases fit for food calls for a large upfront expenditure on infrastructure, specialized machinery, and safety precautions. This high capital cost may discourage investment in particular areas or market segments and serve as a barrier to entry for new competitors.
Food items that are natural and organic are in greater demand as customers place a higher priority on their health and wellbeing. Food-grade gases can be very helpful in keeping these goods' flavor, freshness, and nutritional content intact without the use of artificial additives or preservatives. Additionally, the market for food-grade gases has a lot of potential in emerging nations due to factors like urbanization, population expansion, and rising disposable incomes. Furthermore, there are unexplored niches within established markets where there is likely to be an increase in demand for food-grade gases, such as small and medium-sized food producers, artisanal food manufacturers, and niche food categories.
North America led the market in 2023 with the largest market share of 36.2%. The food and beverage sector in North America is highly developed and diverse, with a broad spectrum of producers, processors, distributors, and retailers. This industry includes a number of different areas, including packaged foods, dairy products, meat and poultry, baked goods, drinks, and fruits and vegetables. Furthermore, North American consumers place a premium on food safety, quality, and freshness. Food-grade gases are therefore in greater demand in order to improve food preservation, increase shelf life, and preserve product integrity throughout the supply chain. In response to these consumer demands, modified atmosphere packaging (MAP) technology—which makes use of food-grade gases—is being increasingly used.
North America Region Food-Grade Gases Market Share in 2023 - 36.2%
www.thebrainyinsights.com
Check the geographical analysis of this market by requesting a free sample
The Carbon dioxide segment dominated the global market in 2023 with a market share of 43.6%. Many liquids, such as carbonated soft drinks, sparkling water, beer, and wine, are carbonated by adding carbon dioxide to them. It delivers the fizz and crisp flavor that customers want. Additionally, carbon dioxide is used in MAP systems to replace oxygen and produce a regulated environment that increases the shelf life of perishable foods such fruits, vegetables, meats, poultry, and seafood. CO2 aids in maintaining freshness and quality by preventing oxidative reactions and microbiological development. Moreover, CO2 is used in cryogenic freezing and chilling processes, which quickly chill or freeze food items without compromising their quality or texture.
The Freezing & Chilling segment dominated the global market in 2023 with a market share of 36.8%. The demand for frozen convenience foods has increased due to changing lifestyles and hectic schedules. For the freezing procedure to preserve product quality and increase shelf life, food-grade gases are necessary. Additionally, as freezing and chilling technologies continue to progress, more effective and economical ways are being adopted, which is fueling the market's demand for food-grade gases. Furthermore, tight norms and regulations on food safety and quality are enforced by regulatory bodies worldwide. Food-grade gases, which preserve sanitation and inhibit microbiological development during processing, are essential to guaranteeing that food items fulfill these strict requirements.
The frozen products segment dominated the global market in 2023 with a market share of 28.1%. Global demand for frozen goods has been rising gradually, including fruits, vegetables, meat, fish, and ready-to-eat meals. Convenience, increased food quality, and longer shelf lives are some of the elements driving this trend. Additionally, the use of freezing technology advancements such as cryogenic freezing and IQF (Individual Quick Freezing) has increased. These systems use food-grade gases, including carbon dioxide and nitrogen, to freeze food quickly and effectively without sacrificing the frozen item's texture or quality.
| Attribute | Description |
|---|---|
| Market Size | Revenue (USD Billion) |
| Market size value in 2023 | USD 8.1 Billion |
| Market size value in 2033 | USD 16.1 Billion |
| CAGR (2024 to 2033) | 7.1% |
| Historical data | 2020-2022 |
| Base Year | 2023 |
| Forecast | 2024-2033 |
| Region | The regions analyzed for the market are Asia Pacific, Europe, South America, North America, and Middle East & Africa. Furthermore, the regions are further analyzed at the country level. |
| Segments | Product, Application, End-use |
As per The Brainy Insights, the size of the food-grade gases market was valued at USD 8.1 billion in 2023 to USD 16.1 billion by 2033.
The global food-grade gases market is growing at a CAGR of 7.1% during the forecast period 2024-2033.
The North America region emerged as the largest market for the food-grade gases.
The increasing demand for packaged and processed foods will influence the market's growth.
1. Introduction
1.1. Objectives of the Study
1.2. Market Definition
1.3. Research Scope
1.4. Currency
1.5. Key Target Audience
2. Research Methodology and Assumptions
3. Executive Summary
4. Premium Insights
4.1. Porter’s Five Forces Analysis
4.2. Value Chain Analysis
4.3. Top Investment Pockets
4.3.1. Market Attractiveness Analysis by Product
4.3.2. Market Attractiveness Analysis by Application
4.3.3. Market Attractiveness Analysis by End-Use
4.3.4. Market Attractiveness Analysis by Region
4.4. Industry Trends
5. Market Dynamics
5.1. Market Evaluation
5.2. Drivers
5.2.1. Increasing Demand for Packaged and Processed Foods
5.3. Restraints
5.3.1. High Capital Investment
5.4. Opportunities
5.4.1. Expansion of Food Processing Industry
5.5. Challenges
5.5.1. Stringent regulatory standards and safety requirements
6. Global Food-Grade Gases Market Analysis and Forecast, By Product
6.1. Segment Overview
6.2. Carbon Di Oxide
6.3. Nitrogen
6.4. Oxygen
6.5. Sulfur dioxide
6.6. Others
7. Global Food-Grade Gases Market Analysis and Forecast, By Application
7.1. Segment Overview
7.2. Freezing & Chilling
7.3. Packaging
7.4. Carbonation
7.5. Other
8. Global Food-Grade Gases Market Analysis and Forecast, By End-Use
8.1. Segment Overview
8.2. Dairy & Frozen Products
8.3. Fish & Sea Food
8.4. Meat
8.5. Beverages
8.6. Fruit & Vegetables
8.7. Bakery & Confectionery
8.8. Other
9. Global Food-Grade Gases Market Analysis and Forecast, By Regional Analysis
9.1. Segment Overview
9.2. North America
9.2.1. U.S.
9.2.2. Canada
9.2.3. Mexico
9.3. Europe
9.3.1. Germany
9.3.2. France
9.3.3. U.K.
9.3.4. Italy
9.3.5. Spain
9.4. Asia-Pacific
9.4.1. Japan
9.4.2. China
9.4.3. India
9.5. South America
9.5.1. Brazil
9.6. Middle East and Africa
9.6.1. UAE
9.6.2. South Africa
10. Global Food-Grade Gases Market-Competitive Landscape
10.1. Overview
10.2. Market Share of Key Players in the Food-Grade Gases Market
10.2.1. Global Company Market Share
10.2.2. North America Company Market Share
10.2.3. Europe Company Market Share
10.2.4. APAC Company Market Share
10.3. Competitive Situations and Trends
10.3.1. Product Launches and Developments
10.3.2. Partnerships, Collaborations, and Agreements
10.3.3. Mergers & Acquisitions
10.3.4. Expansions
11. Company Profiles
11.1. National Gases Limited
11.1.1. Business Overview
11.1.2. Company Snapshot
11.1.3. Company Market Share Analysis
11.1.4. Company Product Portfolio
11.1.5. Recent Developments
11.1.6. SWOT Analysis
11.2. SIAD
11.2.1. Business Overview
11.2.2. Company Snapshot
11.2.3. Company Market Share Analysis
11.2.4. Company Product Portfolio
11.2.5. Recent Developments
11.2.6. SWOT Analysis
11.3. Cryogenic Gases
11.3.1. Business Overview
11.3.2. Company Snapshot
11.3.3. Company Market Share Analysis
11.3.4. Company Product Portfolio
11.3.5. Recent Developments
11.3.6. SWOT Analysis
11.4. Les Gaz Industriels Ltd.
11.4.1. Business Overview
11.4.2. Company Snapshot
11.4.3. Company Market Share Analysis
11.4.4. Company Product Portfolio
11.4.5. Recent Developments
11.4.6. SWOT Analysis
11.5. Aditya Air Products
11.5.1. Business Overview
11.5.2. Company Snapshot
11.5.3. Company Market Share Analysis
11.5.4. Company Product Portfolio
11.5.5. Recent Developments
11.5.6. SWOT Analysis
11.6. Sidewinder Dry Ice & Gas
11.6.1. Business Overview
11.6.2. Company Snapshot
11.6.3. Company Market Share Analysis
11.6.4. Company Product Portfolio
11.6.5. Recent Developments
11.6.6. SWOT Analysis
11.7. Axcel Gases
11.7.1. Business Overview
11.7.2. Company Snapshot
11.7.3. Company Market Share Analysis
11.7.4. Company Product Portfolio
11.7.5. Recent Developments
11.7.6. SWOT Analysis
11.8. Chengdu Taiyu Industrial Gases Co., Ltd
11.8.1. Business Overview
11.8.2. Company Snapshot
11.8.3. Company Market Share Analysis
11.8.4. Company Product Portfolio
11.8.5. Recent Developments
11.8.6. SWOT Analysis
11.9. Yingde Gas Group Ltd
11.9.1. Business Overview
11.9.2. Company Snapshot
11.9.3. Company Market Share Analysis
11.9.4. Company Product Portfolio
11.9.5. Recent Developments
11.9.6. SWOT Analysis
11.10. Siddhi Vinayak Industrial Gases Pvt Ltd
11.10.1. Business Overview
11.10.2. Company Snapshot
11.10.3. Company Market Share Analysis
11.10.4. Company Product Portfolio
11.10.5. Recent Developments
11.10.6. SWOT Analysis
11.11. American Welding & Gas
11.11.1. Business Overview
11.11.2. Company Snapshot
11.11.3. Company Market Share Analysis
11.11.4. Company Product Portfolio
11.11.5. Recent Developments
11.11.6. SWOT Analysis
11.12. Linde Group & Praxair, Inc.
11.12.1. Business Overview
11.12.2. Company Snapshot
11.12.3. Company Market Share Analysis
11.12.4. Company Product Portfolio
11.12.5. Recent Developments
11.12.6. SWOT Analysis
11.13. Air Products & Chemicals, Inc.
11.13.1. Business Overview
11.13.2. Company Snapshot
11.13.3. Company Market Share Analysis
11.13.4. Company Product Portfolio
11.13.5. Recent Developments
11.13.6. SWOT Analysis
11.14. Air Liquide
11.14.1. Business Overview
11.14.2. Company Snapshot
11.14.3. Company Market Share Analysis
11.14.4. Company Product Portfolio
11.14.5. Recent Developments
11.14.6. SWOT Analysis
11.15. The Messer Group GmbH
11.15.1. Business Overview
11.15.2. Company Snapshot
11.15.3. Company Market Share Analysis
11.15.4. Company Product Portfolio
11.15.5. Recent Developments
11.15.6. SWOT Analysis
11.16. Taiyo Nippon Sanso
11.16.1. Business Overview
11.16.2. Company Snapshot
11.16.3. Company Market Share Analysis
11.16.4. Company Product Portfolio
11.16.5. Recent Developments
11.16.6. SWOT Analysis
11.17. Wesfarmers Ltd SOL Group
11.17.1. Business Overview
11.17.2. Company Snapshot
11.17.3. Company Market Share Analysis
11.17.4. Company Product Portfolio
11.17.5. Recent Developments
11.17.6. SWOT Analysis
11.18. Gulf Cryo
11.18.1. Business Overview
11.18.2. Company Snapshot
11.18.3. Company Market Share Analysis
11.18.4. Company Product Portfolio
11.18.5. Recent Developments
11.18.6. SWOT Analysis
11.19. Air Water, Inc.
11.19.1. Business Overview
11.19.2. Company Snapshot
11.19.3. Company Market Share Analysis
11.19.4. Company Product Portfolio
11.19.5. Recent Developments
11.19.6. SWOT Analysis
11.20. Massy Group
11.20.1. Business Overview
11.20.2. Company Snapshot
11.20.3. Company Market Share Analysis
11.20.4. Company Product Portfolio
11.20.5. Recent Developments
11.20.6. SWOT Analysis
11.21. PT Aneka Industry
11.21.1. Business Overview
11.21.2. Company Snapshot
11.21.3. Company Market Share Analysis
11.21.4. Company Product Portfolio
11.21.5. Recent Developments
11.21.6. SWOT Analysis
List of Table
1. Global Food-Grade Gases Market, By Product, 2020-2033 (USD Billion)
2. Global Carbon Di Oxide Food-Grade Gases Market, By Region, 2020-2033 (USD Billion)
3. Global Nitrogen Food-Grade Gases Market, By Region, 2020-2033 (USD Billion)
4. Global Oxygen Food-Grade Gases Market, By Region, 2020-2033 (USD Billion)
5. Global Sulfur dioxide Food-Grade Gases Market, By Region, 2020-2033 (USD Billion)
6. Global Others Food-Grade Gases Market, By Region, 2020-2033 (USD Billion)
7. Global Food-Grade Gases Market, By Application, 2020-2033 (USD Billion)
8. Global Freezing & Chilling Food-Grade Gases Market, By Region, 2020-2033 (USD Billion)
9. Global Packaging Food-Grade Gases Market, By Region, 2020-2033 (USD Billion)
10. Global Carbonation Food-Grade Gases Market, By Region, 2020-2033 (USD Billion)
11. Global Other Food-Grade Gases Market, By Region, 2020-2033 (USD Billion)
12. Global Food-Grade Gases Market, By End-Use, 2020-2033 (USD Billion)
13. Global Dairy & Frozen Products Food-Grade Gases Market, By Region, 2020-2033 (USD Billion)
14. Global Fish & Sea Food, Food-Grade Gases Market, By Region, 2020-2033 (USD Billion)
15. Global Meat Food-Grade Gases Market, By Region, 2020-2033 (USD Billion)
16. Global Beverages Food-Grade Gases Market, By Region, 2020-2033 (USD Billion)
17. Global Fruit & Vegetables Food-Grade Gases Market, By Region, 2020-2033 (USD Billion)
18. Global Bakery & Confectionery Food-Grade Gases Market, By Region, 2020-2033 (USD Billion)
19. Global Other Food-Grade Gases Market, By Region, 2020-2033 (USD Billion)
20. Global Food-Grade Gases Market, By Region, 2020-2033 (USD Billion)
21. North America Food-Grade Gases Market, By Product, 2020-2033 (USD Billion)
22. North America Food-Grade Gases Market, By Application, 2020-2033 (USD Billion)
23. North America Food-Grade Gases Market, By End-Use, 2020-2033 (USD Billion)
24. U.S. Food-Grade Gases Market, By Product, 2020-2033 (USD Billion)
25. U.S. Food-Grade Gases Market, By Application, 2020-2033 (USD Billion)
26. U.S. Food-Grade Gases Market, By End-Use, 2020-2033 (USD Billion)
27. Canada Food-Grade Gases Market, By Product, 2020-2033 (USD Billion)
28. Canada Food-Grade Gases Market, By Application, 2020-2033 (USD Billion)
29. Canada Food-Grade Gases Market, By End-Use, 2020-2033 (USD Billion)
30. Mexico Food-Grade Gases Market, By Product, 2020-2033 (USD Billion)
31. Mexico Food-Grade Gases Market, By Application, 2020-2033 (USD Billion)
32. Mexico Food-Grade Gases Market, By End-Use, 2020-2033 (USD Billion)
33. Europe Food-Grade Gases Market, By Product, 2020-2033 (USD Billion)
34. Europe Food-Grade Gases Market, By Application, 2020-2033 (USD Billion)
35. Europe Food-Grade Gases Market, By End-Use, 2020-2033 (USD Billion)
36. Germany Food-Grade Gases Market, By Product, 2020-2033 (USD Billion)
37. Germany Food-Grade Gases Market, By Application, 2020-2033 (USD Billion)
38. Germany Food-Grade Gases Market, By End-Use, 2020-2033 (USD Billion)
39. France Food-Grade Gases Market, By Product, 2020-2033 (USD Billion)
40. France Food-Grade Gases Market, By Application, 2020-2033 (USD Billion)
41. France Food-Grade Gases Market, By End-Use, 2020-2033 (USD Billion)
42. U.K. Food-Grade Gases Market, By Product, 2020-2033 (USD Billion)
43. U.K. Food-Grade Gases Market, By Application, 2020-2033 (USD Billion)
44. U.K. Food-Grade Gases Market, By End-Use, 2020-2033 (USD Billion)
45. Italy Food-Grade Gases Market, By Product, 2020-2033 (USD Billion)
46. Italy Food-Grade Gases Market, By Application, 2020-2033 (USD Billion)
47. Italy Food-Grade Gases Market, By End-Use, 2020-2033 (USD Billion)
48. Spain Food-Grade Gases Market, By Product, 2020-2033 (USD Billion)
49. Spain Food-Grade Gases Market, By Application, 2020-2033 (USD Billion)
50. Spain Food-Grade Gases Market, By End-Use, 2020-2033 (USD Billion)
51. Asia Pacific Food-Grade Gases Market, By Product, 2020-2033 (USD Billion)
52. Asia Pacific Food-Grade Gases Market, By Application, 2020-2033 (USD Billion)
53. Asia Pacific Food-Grade Gases Market, By End-Use, 2020-2033 (USD Billion)
54. Japan Food-Grade Gases Market, By Product, 2020-2033 (USD Billion)
55. Japan Food-Grade Gases Market, By Application, 2020-2033 (USD Billion)
56. Japan Food-Grade Gases Market, By End-Use, 2020-2033 (USD Billion)
57. China Food-Grade Gases Market, By Product, 2020-2033 (USD Billion)
58. China Food-Grade Gases Market, By Application, 2020-2033 (USD Billion)
59. China Food-Grade Gases Market, By End-Use, 2020-2033 (USD Billion)
60. India Food-Grade Gases Market, By Product, 2020-2033 (USD Billion)
61. India Food-Grade Gases Market, By Application, 2020-2033 (USD Billion)
62. India Food-Grade Gases Market, By End-Use, 2020-2033 (USD Billion)
63. South America Food-Grade Gases Market, By Product, 2020-2033 (USD Billion)
64. South America Food-Grade Gases Market, By Application, 2020-2033 (USD Billion)
65. South America Food-Grade Gases Market, By End-Use, 2020-2033 (USD Billion)
66. Brazil Food-Grade Gases Market, By Product, 2020-2033 (USD Billion)
67. Brazil Food-Grade Gases Market, By Application, 2020-2033 (USD Billion)
68. Brazil Food-Grade Gases Market, By End-Use, 2020-2033 (USD Billion)
69. Middle East and Africa Food-Grade Gases Market, By Product, 2020-2033 (USD Billion)
70. Middle East and Africa Food-Grade Gases Market, By Application, 2020-2033 (USD Billion)
71. Middle East and Africa Food-Grade Gases Market, By End-Use, 2020-2033 (USD Billion)
72. UAE Food-Grade Gases Market, By Product, 2020-2033 (USD Billion)
73. UAE Food-Grade Gases Market, By Application, 2020-2033 (USD Billion)
74. UAE Food-Grade Gases Market, By End-Use, 2020-2033 (USD Billion)
75. South Africa Food-Grade Gases Market, By Product, 2020-2033 (USD Billion)
76. South Africa Food-Grade Gases Market, By Application, 2020-2033 (USD Billion)
77. South Africa Food-Grade Gases Market, By End-Use, 2020-2033 (USD Billion)
List of Figures
1. Global Food-Grade Gases Market Segmentation
2. Food-Grade Gases Market: Research Methodology
3. Market Size Estimation Methodology: Bottom-Up Approach
4. Market Size Estimation Methodology: Top-Down Approach
5. Data Triangulation
6. Porter’s Five Forces Analysis
7. Value Chain Analysis
8. Global Food-Grade Gases Market Attractiveness Analysis by Product
9. Global Food-Grade Gases Market Attractiveness Analysis by Application
10. Global Food-Grade Gases Market Attractiveness Analysis by End-Use
11. Global Food-Grade Gases Market Attractiveness Analysis by Region
12. Global Food-Grade Gases Market: Dynamics
13. Global Food-Grade Gases Market Share by Product (2023 & 2033)
14. Global Food-Grade Gases Market Share by Application (2023 & 2033)
15. Global Food-Grade Gases Market Share by End-Use (2023 & 2033)
16. Global Food-Grade Gases Market Share by Regions (2023 & 2033)
17. Global Food-Grade Gases Market Share by Company (2023)
This study forecasts revenue at global, regional, and country levels from 2020 to 2033. The Brainy Insights has segmented the global food-grade gases market based on below-mentioned segments:
Global Food-Grade Gases Market by Product:
Global Food-Grade Gases Market by Application:
Global Food-Grade Gases Market by End-Use:
Global Food-Grade Gases Market by Region:
Research has its special purpose to undertake marketing efficiently. In this competitive scenario, businesses need information across all industry verticals; the information about customer wants, market demand, competition, industry trends, distribution channels etc. This information needs to be updated regularly because businesses operate in a dynamic environment. Our organization, The Brainy Insights incorporates scientific and systematic research procedures in order to get proper market insights and industry analysis for overall business success. The analysis consists of studying the market from a miniscule level wherein we implement statistical tools which helps us in examining the data with accuracy and precision.
Our research reports feature both; quantitative and qualitative aspects for any market. Qualitative information for any market research process are fundamental because they reveal the customer needs and wants, usage and consumption for any product/service related to a specific industry. This in turn aids the marketers/investors in knowing certain perceptions of the customers. Qualitative research can enlighten about the different product concepts and designs along with unique service offering that in turn, helps define marketing problems and generate opportunities. On the other hand, quantitative research engages with the data collection process through interviews, e-mail interactions, surveys and pilot studies. Quantitative aspects for the market research are useful to validate the hypotheses generated during qualitative research method, explore empirical patterns in the data with the help of statistical tools, and finally make the market estimations.
The Brainy Insights offers comprehensive research and analysis, based on a wide assortment of factual insights gained through interviews with CXOs and global experts and secondary data from reliable sources. Our analysts and industry specialist assume vital roles in building up statistical tools and analysis models, which are used to analyse the data and arrive at accurate insights with exceedingly informative research discoveries. The data provided by our organization have proven precious to a diverse range of companies, facilitating them to address issues such as determining which products/services are the most appealing, whether or not customers use the product in the manner anticipated, the purchasing intentions of the market and many others.
Our research methodology encompasses an idyllic combination of primary and secondary initiatives. Key phases involved in this process are listed below:

The phase involves the gathering and collecting of market data and its related information with the help of different sources & research procedures.

The data procurement stage involves in data gathering and collecting through various data sources.
This stage involves in extensive research. These data sources includes:
Purchased Database: Purchased databases play a crucial role in estimating the market sizes irrespective of the domain. Our purchased database includes:
Primary Research: The Brainy Insights interacts with leading companies and experts of the concerned domain to develop the analyst team’s market understanding and expertise. It improves and substantiates every single data presented in the market reports. Primary research mainly involves in telephonic interviews, E-mail interactions and face-to-face interviews with the raw material providers, manufacturers/producers, distributors, & independent consultants. The interviews that we conduct provides valuable data on market size and industry growth trends prevailing in the market. Our organization also conducts surveys with the various industry experts in order to gain overall insights of the industry/market. For instance, in healthcare industry we conduct surveys with the pharmacists, doctors, surgeons and nurses in order to gain insights and key information of a medical product/device/equipment which the customers are going to usage. Surveys are conducted in the form of questionnaire designed by our own analyst team. Surveys plays an important role in primary research because surveys helps us to identify the key target audiences of the market. Additionally, surveys helps to identify the key target audience engaged with the market. Our survey team conducts the survey by targeting the key audience, thus gaining insights from them. Based on the perspectives of the customers, this information is utilized to formulate market strategies. Moreover, market surveys helps us to understand the current competitive situation of the industry. To be precise, our survey process typically involve with the 360 analysis of the market. This analytical process begins by identifying the prospective customers for a product or service related to the market/industry to obtain data on how a product/service could fit into customers’ lives.

Secondary Research: The secondary data sources includes information published by the on-profit organizations such as World bank, WHO, company fillings, investor presentations, annual reports, national government documents, statistical databases, blogs, articles, white papers and others. From the annual report, we analyse a company’s revenue to understand the key segment and market share of that organization in a particular region. We analyse the company websites and adopt the product mapping technique which is important for deriving the segment revenue. In the product mapping method, we select and categorize the products offered by the companies catering to domain specific market, deduce the product revenue for each of the companies so as to get overall estimation of the market size. We also source data and analyses trends based on information received from supply side and demand side intermediaries in the value chain. The supply side denotes the data gathered from supplier, distributor, wholesaler and the demand side illustrates the data gathered from the end customers for respective market domain.

The supply side for a domain specific market is analysed by:
The demand side for the market is estimated through:
In-house Library: Apart from these third-party sources, we have our in-house library of qualitative and quantitative information. Our in-house database includes market data for various industry and domains. These data are updated on regular basis as per the changing market scenario. Our library includes, historic databases, internal audit reports and archives.
Sometimes there are instances where there is no metadata or raw data available for any domain specific market. For those cases, we use our expertise to forecast and estimate the market size in order to generate comprehensive data sets. Our analyst team adopt a robust research technique in order to produce the estimates:
Data Synthesis: This stage involves the analysis & mapping of all the information obtained from the previous step. It also involves in scrutinizing the data for any discrepancy observed while data gathering related to the market. The data is collected with consideration to the heterogeneity of sources. Robust scientific techniques are in place for synthesizing disparate data sets and provide the essential contextual information that can orient market strategies. The Brainy Insights has extensive experience in data synthesis where the data passes through various stages:


Market Deduction & Formulation: The final stage comprises of assigning data points at appropriate market spaces so as to deduce feasible conclusions. Analyst perspective & subject matter expert based holistic form of market sizing coupled with industry analysis also plays a crucial role in this stage.
This stage involves in finalization of the market size and numbers that we have collected from data integration step. With data interpolation, it is made sure that there is no gap in the market data. Successful trend analysis is done by our analysts using extrapolation techniques, which provide the best possible forecasts for the market.
Data Validation & Market Feedback: Validation is the most important step in the process. Validation & re-validation via an intricately designed process helps us finalize data-points to be used for final calculations.

The Brainy Insights interacts with leading companies and experts of the concerned domain to develop the analyst team’s market understanding and expertise. It improves and substantiates every single data presented in the market reports. The data validation interview and discussion panels are typically composed of the most experienced industry members. The participants include, however, are not limited to:
Moreover, we always validate our data and findings through primary respondents from all the major regions we are working on.


Free Customization
Fortune 500 Clients
Free Yearly Update On Purchase Of Multi/Corporate License
Companies Served Till Date