- +1-315-215-1633
- sales@thebrainyinsights.com

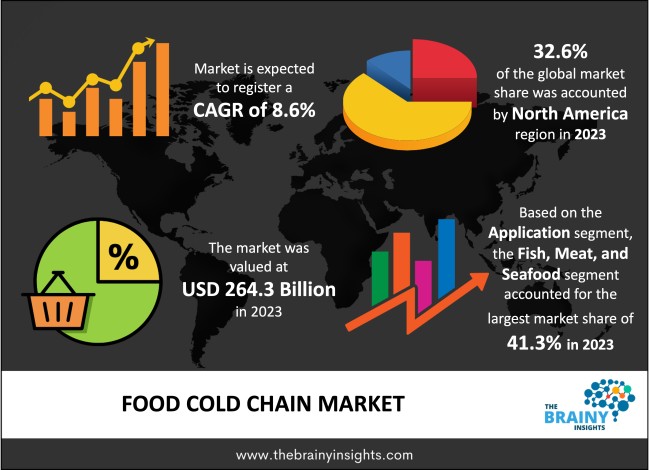
The food cold chain Market was valued at USD 264.3 billion in 2023 and grew at a CAGR of 8.6% from 2024 to 2033. Food perishability is becoming an increasing problem in many aspects of life, from sourcing to final product placement on store shelves. Climate change has made ambient temperature variations more frequent, making cold chain infrastructure more susceptible. As a result, robust cold chain solutions are becoming more and more important.
The act of moving and keeping perishable food items at regulated temperatures to preserve their nutritional value, safety, and freshness from manufacturing to consumption is known as the "food cold chain." This calls for several logistics that are temperature-controlled, such as distribution, transportation, and refrigerated storage. For many food items, such as fresh vegetables, dairy, meat, fish, and processed foods, to remain intact, the food cold chain is essential.
Get an overview of this study by requesting a free sample
The necessity for effective cold-chain logistics has grown as a result of the globalization in food production and distribution. A well-established cold chain is necessary to preserve freshness throughout the transporting of perishable food items, which are obtained from different areas and nations. Additionally, there has been a growth in consumer preferences for frozen and fresh goods. The need for efficient cold chain solutions to guarantee the safety and quality of products has been fueled by the need for a wide range of perishable goods, such as fresh fruit, dairy, meat, and seafood.
Substantial upfront investment and continuous operating expenditures are associated with the establishment and upkeep of a complete cold chain infrastructure, which includes transportation fleets, temperature monitoring systems, and refrigerated storage facilities. For some firms, especially smaller ones, this could be a hurdle. Furthermore, the cold chain could face difficulties getting to isolated and rural locations with inadequate infrastructure. Maintaining a supply of perishable goods in these kinds of places can be logistically difficult and expensive.
There is a chance to build more cold chain infrastructure in underdeveloped areas where it might not now exist. The delivery of perishable items may be supported and the entire supply chain improved with investments in transportation, distribution, and refrigerated storage. Additionally, the increasing focus on sustainability offers a chance for eco-friendly practices and technology to be adopted inside the cold chain. This covers the use of sustainable packaging, energy-efficient equipment, and environmentally friendly refrigerants.
North America led the market in 2023 with the largest market share of 32.6%. The food cold chain industry in North America is served by a vast and efficient distribution network. This includes cold storage facilities, refrigerated vehicles, and effective distribution networks that guarantee the prompt and secure delivery of perishable goods. Additionally, a variety of agricultural products are produced due to North America's varied environment, which ranges from cold to warmer places. In order to maintain the freshness and quality of goods like vegetables, fruits, dairy, and meat across a variety of climates, the food cold chain is essential.
North America Region Food Cold Chain Market Share in 2023 - 32.6%%
www.thebrainyinsights.com
Check the geographical analysis of this market by requesting a free sample
The Fish, meat, and seafood segment dominated the global market in 2023 with a market share of 41.3%. Seafood, meat, and fish are highly perishable goods that must be kept at a certain temperature to keep them fresh and avoid spoiling. This segment's food cold chain requires careful temperature control during distribution, transit, and storage. Additionally, a vital link in the cold chain for seafood, pork, and shellfish is chilled transportation. Refrigerated vans and containers are examples of temperature-controlled vehicles that guarantee goods are carried in the best possible conditions to avoid deterioration.
The frozen segment dominated the global market in 2023 with a market share of 58.2%. Foods that are frozen have a longer shelf life and are easier to prepare, which is why there is a growing demand for them. Foods that are frozen are also more suited for long-distance transportation because they don't easily spoil while being transported or stored. The cold chain market's frozen segment is being driven by the rising demand for frozen goods as well as the requirement for precisely controlled temperatures during storage and transportation. For the frozen segment, the need for logistics and cold chain services is anticipated to rise in the upcoming years due to an increasing need for frozen food, medications, and other products.
The Offline segment dominated the global market in 2023 with a market share of 68.4%. Physical warehouses with refrigeration systems outfitted to preserve perishable items at precise temperatures are known as offline cold storage facilities. By serving as a transitional hub between the manufacturing and distribution processes, these facilities guarantee a continuation of product quality. In the food cold chain, grocery stores, supermarkets, and convenience stores are examples of offline retail establishments that play a significant role. To keep perishable goods fresh for customers, some stores keep portions that are frozen and refrigerated.
| Attribute | Description |
|---|---|
| Market Size | Revenue (USD Billion) |
| Market size value in 2023 | USD 264.3 Billion |
| Market size value in 2033 | USD 555.3 Billion |
| CAGR (2024 to 2033) | 8.6% |
| Historical data | 2020-2022 |
| Base Year | 2023 |
| Forecast | 2024-2033 |
| Region | The regions analyzed for the market are Asia Pacific, Europe, South America, North America, and Middle East & Africa. Furthermore, the regions are further analyzed at the country level. |
| Segments | Application, Temperature Type, and Distribution Channel |
As per The Brainy Insights, the size of the food cold chain market was valued at USD 264.3 billion in 2023 to USD 555.3 billion by 2033.
The global food cold chain market is growing at a CAGR of 8.6% during the forecast period 2024-2033.
The North American region emerged as the largest market for the food cold chain.
The increasing globalization in food production and distribution will influence the market's growth.
1. Introduction
1.1. Objectives of the Study
1.2. Market Definition
1.3. Research Scope
1.4. Currency
1.5. Key Target Audience
2. Research Methodology and Assumptions
3. Executive Summary
4. Premium Insights
4.1. Porter’s Five Forces Analysis
4.2. Value Chain Analysis
4.3. Top Investment Pockets
4.3.1. Market Attractiveness Analysis by Application
4.3.2. Market Attractiveness Analysis by Temperature Type
4.3.3. Market Attractiveness Analysis by Distribution Channel
4.3.4. Market Attractiveness Analysis by Region
4.4. Industry Trends
5. Market Dynamics
5.1. Market Evaluation
5.2. Drivers
5.2.1. Globalization in food production and distribution
5.3. Restraints
5.3.1. High Initial Investment required
5.4. Opportunities
5.4.1. Rise in demand from underdeveloped regions
5.5. Challenges
5.5.1. Climate Change
6. Global Food Cold Chain Market Analysis and Forecast, By Application
6.1. Segment Overview
6.2. Dairy & Frozen products
6.3. Fish
6.4. Meat & Seafood
6.5. Fruits & Vegetables
6.6. Bakery & Confectionary
7. Global Food Cold Chain Market Analysis and Forecast, By Temperature Type
7.1. Segment Overview
7.2. Chilled
7.3. Frozen
8. Global Food Cold Chain Market Analysis and Forecast, By Distribution Channel
8.1. Segment Overview
8.2. Offline
8.3. Online
9. Global Food Cold Chain Market Analysis and Forecast, By Regional Analysis
9.1. Segment Overview
9.2. North America
9.2.1. U.S.
9.2.2. Canada
9.2.3. Mexico
9.3. Europe
9.3.1. Germany
9.3.2. France
9.3.3. U.K.
9.3.4. Italy
9.3.5. Spain
9.4. Asia-Pacific
9.4.1. Japan
9.4.2. China
9.4.3. India
9.5. South America
9.5.1. Brazil
9.6. Middle East and Africa
9.6.1. UAE
9.6.2. South Africa
10. Global Food Cold Chain Market-Competitive Landscape
10.1. Overview
10.2. Market Share of Key Players in the Food Cold Chain Market
10.2.1. Global Company Market Share
10.2.2. North America Company Market Share
10.2.3. Europe Company Market Share
10.2.4. APAC Company Market Share
10.3. Competitive Situations and Trends
10.3.1. Product Launches and Developments
10.3.2. Partnerships, Collaborations, and Agreements
10.3.3. Mergers & Acquisitions
10.3.4. Expansions
11. Company Profiles
11.1. Americold Logistics
11.1.1. Business Overview
11.1.2. Company Snapshot
11.1.3. Company Market Share Analysis
11.1.4. Company Product Portfolio
11.1.5. Recent Developments
11.1.6. SWOT Analysis
11.2. Lineage Logistics Holdings, LLC.
11.2.1. Business Overview
11.2.2. Company Snapshot
11.2.3. Company Market Share Analysis
11.2.4. Company Product Portfolio
11.2.5. Recent Developments
11.2.6. SWOT Analysis
11.3. Nichirei Corporation
11.3.1. Business Overview
11.3.2. Company Snapshot
11.3.3. Company Market Share Analysis
11.3.4. Company Product Portfolio
11.3.5. Recent Developments
11.3.6. SWOT Analysis
11.4. Burris Logistics
11.4.1. Business Overview
11.4.2. Company Snapshot
11.4.3. Company Market Share Analysis
11.4.4. Company Product Portfolio
11.4.5. Recent Developments
11.4.6. SWOT Analysis
11.5. A.P. Moller Maersk
11.5.1. Business Overview
11.5.2. Company Snapshot
11.5.3. Company Market Share Analysis
11.5.4. Company Product Portfolio
11.5.5. Recent Developments
11.5.6. SWOT Analysis
11.6. United States Cold Storage
11.6.1. Business Overview
11.6.2. Company Snapshot
11.6.3. Company Market Share Analysis
11.6.4. Company Product Portfolio
11.6.5. Recent Developments
11.6.6. SWOT Analysis
11.7. Tippmann Group
11.7.1. Business Overview
11.7.2. Company Snapshot
11.7.3. Company Market Share Analysis
11.7.4. Company Product Portfolio
11.7.5. Recent Developments
11.7.6. SWOT Analysis
11.8. VersaCold Logistics Services
11.8.1. Business Overview
11.8.2. Company Snapshot
11.8.3. Company Market Share Analysis
11.8.4. Company Product Portfolio
11.8.5. Recent Developments
11.8.6. SWOT Analysis
11.9. Coldman
11.9.1. Business Overview
11.9.2. Company Snapshot
11.9.3. Company Market Share Analysis
11.9.4. Company Product Portfolio
11.9.5. Recent Developments
11.9.6. SWOT Analysis
11.10. Congebec Inc.
11.10.1. Business Overview
11.10.2. Company Snapshot
11.10.3. Company Market Share Analysis
11.10.4. Company Product Portfolio
11.10.5. Recent Developments
11.10.6. SWOT Analysis
11.11. Conestoga Cold Storage
11.11.1. Business Overview
11.11.2. Company Snapshot
11.11.3. Company Market Share Analysis
11.11.4. Company Product Portfolio
11.11.5. Recent Developments
11.11.6. SWOT Analysis
11.12. NewCold
11.12.1. Business Overview
11.12.2. Company Snapshot
11.12.3. Company Market Share Analysis
11.12.4. Company Product Portfolio
11.12.5. Recent Developments
11.12.6. SWOT Analysis
11.13. Confederation Freezers
11.13.1. Business Overview
11.13.2. Company Snapshot
11.13.3. Company Market Share Analysis
11.13.4. Company Product Portfolio
11.13.5. Recent Developments
11.13.6. SWOT Analysis
11.14. Seafrigo
11.14.1. Business Overview
11.14.2. Company Snapshot
11.14.3. Company Market Share Analysis
11.14.4. Company Product Portfolio
11.14.5. Recent Developments
11.14.6. SWOT Analysis
11.15. Trenton Cold Storage
11.15.1. Business Overview
11.15.2. Company Snapshot
11.15.3. Company Market Share Analysis
11.15.4. Company Product Portfolio
11.15.5. Recent Developments
11.15.6. SWOT Analysis
List of Table
1. Global Food Cold Chain Market, By Application, 2020-2033 (USD Billion)
2. Global Dairy & Frozen products Food Cold Chain Market, By Region, 2020-2033 (USD Billion)
3. Global Fish Food Cold Chain Market, By Region, 2020-2033 (USD Billion)
4. Global Meat & Seafood Food Cold Chain Market, By Region, 2020-2033 (USD Billion)
5. Global Fruits & Vegetables Food Cold Chain Market, By Region, 2020-2033 (USD Billion)
6. Global Bakery & Confectionary Food Cold Chain Market, By Region, 2020-2033 (USD Billion)
7. Global Food Cold Chain Market, By Temperature Type, 2020-2033 (USD Billion)
8. Global Chilled Food Cold Chain Market, By Region, 2020-2033 (USD Billion)
9. Global Frozen Food Cold Chain Market, By Region, 2020-2033 (USD Billion)
10. Global Food Cold Chain Market, By Distribution Channel, 2020-2033 (USD Billion)
11. Global Offline Food Cold Chain Market, By Region, 2020-2033 (USD Billion)
12. Global Online Food Cold Chain Market, By Region, 2020-2033 (USD Billion)
13. Global Food Cold Chain Market, By Region, 2020-2033 (USD Billion)
14. North America Food Cold Chain Market, By Application, 2020-2033 (USD Billion)
15. North America Food Cold Chain Market, By Temperature Type, 2020-2033 (USD Billion)
16. North America Food Cold Chain Market, By Distribution Channel, 2020-2033 (USD Billion)
17. U.S. Food Cold Chain Market, By Application, 2020-2033 (USD Billion)
18. U.S. Food Cold Chain Market, By Temperature Type, 2020-2033 (USD Billion)
19. U.S. Food Cold Chain Market, By Distribution Channel, 2020-2033 (USD Billion)
20. Canada Food Cold Chain Market, By Application, 2020-2033 (USD Billion)
21. Canada Food Cold Chain Market, By Temperature Type, 2020-2033 (USD Billion)
22. Canada Food Cold Chain Market, By Distribution Channel, 2020-2033 (USD Billion)
23. Mexico Food Cold Chain Market, By Application, 2020-2033 (USD Billion)
24. Mexico Food Cold Chain Market, By Temperature Type, 2020-2033 (USD Billion)
25. Mexico Food Cold Chain Market, By Distribution Channel, 2020-2033 (USD Billion)
26. Europe Food Cold Chain Market, By Application, 2020-2033 (USD Billion)
27. Europe Food Cold Chain Market, By Temperature Type, 2020-2033 (USD Billion)
28. Europe Food Cold Chain Market, By Distribution Channel, 2020-2033 (USD Billion)
29. Germany Food Cold Chain Market, By Application, 2020-2033 (USD Billion)
30. Germany Food Cold Chain Market, By Temperature Type, 2020-2033 (USD Billion)
31. Germany Food Cold Chain Market, By Distribution Channel, 2020-2033 (USD Billion)
32. France Food Cold Chain Market, By Application, 2020-2033 (USD Billion)
33. France Food Cold Chain Market, By Temperature Type, 2020-2033 (USD Billion)
34. France Food Cold Chain Market, By Distribution Channel, 2020-2033 (USD Billion)
35. U.K. Food Cold Chain Market, By Application, 2020-2033 (USD Billion)
36. U.K. Food Cold Chain Market, By Temperature Type, 2020-2033 (USD Billion)
37. U.K. Food Cold Chain Market, By Distribution Channel, 2020-2033 (USD Billion)
38. Italy Food Cold Chain Market, By Application, 2020-2033 (USD Billion)
39. Italy Food Cold Chain Market, By Temperature Type, 2020-2033 (USD Billion)
40. Italy Food Cold Chain Market, By Distribution Channel, 2020-2033 (USD Billion)
41. Spain Food Cold Chain Market, By Application, 2020-2033 (USD Billion)
42. Spain Food Cold Chain Market, By Temperature Type, 2020-2033 (USD Billion)
43. Spain Food Cold Chain Market, By Distribution Channel, 2020-2033 (USD Billion)
44. Asia Pacific Food Cold Chain Market, By Application, 2020-2033 (USD Billion)
45. Asia Pacific Food Cold Chain Market, By Temperature Type, 2020-2033 (USD Billion)
46. Asia Pacific Food Cold Chain Market, By Distribution Channel, 2020-2033 (USD Billion)
47. Japan Food Cold Chain Market, By Application, 2020-2033 (USD Billion)
48. Japan Food Cold Chain Market, By Temperature Type, 2020-2033 (USD Billion)
49. Japan Food Cold Chain Market, By Distribution Channel, 2020-2033 (USD Billion)
50. China Food Cold Chain Market, By Application, 2020-2033 (USD Billion)
51. China Food Cold Chain Market, By Temperature Type, 2020-2033 (USD Billion)
52. China Food Cold Chain Market, By Distribution Channel, 2020-2033 (USD Billion)
53. India Food Cold Chain Market, By Application, 2020-2033 (USD Billion)
54. India Food Cold Chain Market, By Temperature Type, 2020-2033 (USD Billion)
55. India Food Cold Chain Market, By Distribution Channel, 2020-2033 (USD Billion)
56. South America Food Cold Chain Market, By Application, 2020-2033 (USD Billion)
57. South America Food Cold Chain Market, By Temperature Type, 2020-2033 (USD Billion)
58. South America Food Cold Chain Market, By Distribution Channel, 2020-2033 (USD Billion)
59. Brazil Food Cold Chain Market, By Application, 2020-2033 (USD Billion)
60. Brazil Food Cold Chain Market, By Temperature Type, 2020-2033 (USD Billion)
61. Brazil Food Cold Chain Market, By Distribution Channel, 2020-2033 (USD Billion)
62. Middle East and Africa Food Cold Chain Market, By Application, 2020-2033 (USD Billion)
63. Middle East and Africa Food Cold Chain Market, By Temperature Type, 2020-2033 (USD Billion)
64. Middle East and Africa Food Cold Chain Market, By Distribution Channel, 2020-2033 (USD Billion)
65. UAE Food Cold Chain Market, By Application, 2020-2033 (USD Billion)
66. UAE Food Cold Chain Market, By Temperature Type, 2020-2033 (USD Billion)
67. UAE Food Cold Chain Market, By Distribution Channel, 2020-2033 (USD Billion)
68. South Africa Food Cold Chain Market, By Application, 2020-2033 (USD Billion)
69. South Africa Food Cold Chain Market, By Temperature Type, 2020-2033 (USD Billion)
70. South Africa Food Cold Chain Market, By Distribution Channel, 2020-2033 (USD Billion)
List of Figures
1. Global Food Cold Chain Market Segmentation
2. Food Cold Chain Market: Research Methodology
3. Market Size Estimation Methodology: Bottom-Up Approach
4. Market Size Estimation Methodology: Top-Down Approach
5. Data Triangulation
6. Porter’s Five Forces Analysis
7. Value Chain Analysis
8. Global Food Cold Chain Market Attractiveness Analysis by Application
9. Global Food Cold Chain Market Attractiveness Analysis by Temperature Type
10. Global Food Cold Chain Market Attractiveness Analysis by Distribution Channel
11. Global Food Cold Chain Market Attractiveness Analysis by Region
12. Global Food Cold Chain Market: Dynamics
13. Global Food Cold Chain Market Share by Application (2023 & 2033)
14. Global Food Cold Chain Market Share by Temperature Type (2023 & 2033)
15. Global Food Cold Chain Market Share by Distribution Channel (2023 & 2033)
16. Global Food Cold Chain Market Share by Regions (2023 & 2033)
17. Global Food Cold Chain Market Share by Company (2023)
This study forecasts revenue at global, regional, and country levels from 2019 to 2032. The Brainy Insights has segmented the global food cold chain market based on below-mentioned segments:
Global Food Cold Chain Market by Application:
Global Food Cold Chain Market by Temperature Type:
Global Food Cold Chain Market by Distribution Channel:
Global Food Cold Chain Market by Region:
Research has its special purpose to undertake marketing efficiently. In this competitive scenario, businesses need information across all industry verticals; the information about customer wants, market demand, competition, industry trends, distribution channels etc. This information needs to be updated regularly because businesses operate in a dynamic environment. Our organization, The Brainy Insights incorporates scientific and systematic research procedures in order to get proper market insights and industry analysis for overall business success. The analysis consists of studying the market from a miniscule level wherein we implement statistical tools which helps us in examining the data with accuracy and precision.
Our research reports feature both; quantitative and qualitative aspects for any market. Qualitative information for any market research process are fundamental because they reveal the customer needs and wants, usage and consumption for any product/service related to a specific industry. This in turn aids the marketers/investors in knowing certain perceptions of the customers. Qualitative research can enlighten about the different product concepts and designs along with unique service offering that in turn, helps define marketing problems and generate opportunities. On the other hand, quantitative research engages with the data collection process through interviews, e-mail interactions, surveys and pilot studies. Quantitative aspects for the market research are useful to validate the hypotheses generated during qualitative research method, explore empirical patterns in the data with the help of statistical tools, and finally make the market estimations.
The Brainy Insights offers comprehensive research and analysis, based on a wide assortment of factual insights gained through interviews with CXOs and global experts and secondary data from reliable sources. Our analysts and industry specialist assume vital roles in building up statistical tools and analysis models, which are used to analyse the data and arrive at accurate insights with exceedingly informative research discoveries. The data provided by our organization have proven precious to a diverse range of companies, facilitating them to address issues such as determining which products/services are the most appealing, whether or not customers use the product in the manner anticipated, the purchasing intentions of the market and many others.
Our research methodology encompasses an idyllic combination of primary and secondary initiatives. Key phases involved in this process are listed below:

The phase involves the gathering and collecting of market data and its related information with the help of different sources & research procedures.

The data procurement stage involves in data gathering and collecting through various data sources.
This stage involves in extensive research. These data sources includes:
Purchased Database: Purchased databases play a crucial role in estimating the market sizes irrespective of the domain. Our purchased database includes:
Primary Research: The Brainy Insights interacts with leading companies and experts of the concerned domain to develop the analyst team’s market understanding and expertise. It improves and substantiates every single data presented in the market reports. Primary research mainly involves in telephonic interviews, E-mail interactions and face-to-face interviews with the raw material providers, manufacturers/producers, distributors, & independent consultants. The interviews that we conduct provides valuable data on market size and industry growth trends prevailing in the market. Our organization also conducts surveys with the various industry experts in order to gain overall insights of the industry/market. For instance, in healthcare industry we conduct surveys with the pharmacists, doctors, surgeons and nurses in order to gain insights and key information of a medical product/device/equipment which the customers are going to usage. Surveys are conducted in the form of questionnaire designed by our own analyst team. Surveys plays an important role in primary research because surveys helps us to identify the key target audiences of the market. Additionally, surveys helps to identify the key target audience engaged with the market. Our survey team conducts the survey by targeting the key audience, thus gaining insights from them. Based on the perspectives of the customers, this information is utilized to formulate market strategies. Moreover, market surveys helps us to understand the current competitive situation of the industry. To be precise, our survey process typically involve with the 360 analysis of the market. This analytical process begins by identifying the prospective customers for a product or service related to the market/industry to obtain data on how a product/service could fit into customers’ lives.

Secondary Research: The secondary data sources includes information published by the on-profit organizations such as World bank, WHO, company fillings, investor presentations, annual reports, national government documents, statistical databases, blogs, articles, white papers and others. From the annual report, we analyse a company’s revenue to understand the key segment and market share of that organization in a particular region. We analyse the company websites and adopt the product mapping technique which is important for deriving the segment revenue. In the product mapping method, we select and categorize the products offered by the companies catering to domain specific market, deduce the product revenue for each of the companies so as to get overall estimation of the market size. We also source data and analyses trends based on information received from supply side and demand side intermediaries in the value chain. The supply side denotes the data gathered from supplier, distributor, wholesaler and the demand side illustrates the data gathered from the end customers for respective market domain.

The supply side for a domain specific market is analysed by:
The demand side for the market is estimated through:
In-house Library: Apart from these third-party sources, we have our in-house library of qualitative and quantitative information. Our in-house database includes market data for various industry and domains. These data are updated on regular basis as per the changing market scenario. Our library includes, historic databases, internal audit reports and archives.
Sometimes there are instances where there is no metadata or raw data available for any domain specific market. For those cases, we use our expertise to forecast and estimate the market size in order to generate comprehensive data sets. Our analyst team adopt a robust research technique in order to produce the estimates:
Data Synthesis: This stage involves the analysis & mapping of all the information obtained from the previous step. It also involves in scrutinizing the data for any discrepancy observed while data gathering related to the market. The data is collected with consideration to the heterogeneity of sources. Robust scientific techniques are in place for synthesizing disparate data sets and provide the essential contextual information that can orient market strategies. The Brainy Insights has extensive experience in data synthesis where the data passes through various stages:


Market Deduction & Formulation: The final stage comprises of assigning data points at appropriate market spaces so as to deduce feasible conclusions. Analyst perspective & subject matter expert based holistic form of market sizing coupled with industry analysis also plays a crucial role in this stage.
This stage involves in finalization of the market size and numbers that we have collected from data integration step. With data interpolation, it is made sure that there is no gap in the market data. Successful trend analysis is done by our analysts using extrapolation techniques, which provide the best possible forecasts for the market.
Data Validation & Market Feedback: Validation is the most important step in the process. Validation & re-validation via an intricately designed process helps us finalize data-points to be used for final calculations.

The Brainy Insights interacts with leading companies and experts of the concerned domain to develop the analyst team’s market understanding and expertise. It improves and substantiates every single data presented in the market reports. The data validation interview and discussion panels are typically composed of the most experienced industry members. The participants include, however, are not limited to:
Moreover, we always validate our data and findings through primary respondents from all the major regions we are working on.


Free Customization
Fortune 500 Clients
Free Yearly Update On Purchase Of Multi/Corporate License
Companies Served Till Date