- +1-315-215-1633
- sales@thebrainyinsights.com

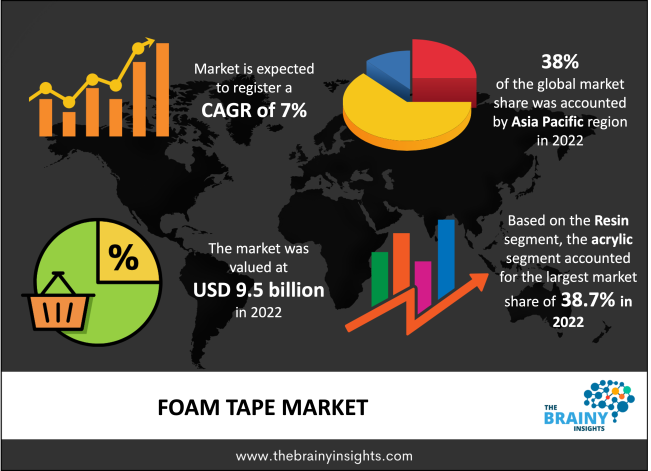
The global foam tape market is expected to reach USD 18.6 billion by 2032, at a CAGR of 7% during the forecast period 2022 to 2032. North America is expected to grow the fastest during the forecast period.
Foam tape is a self-adhesive tape that is pressure sensitive. It comprises foam with several different backing materials and is sticky on one or both sides. It is available in various lengths, widths, thicknesses, and colours, making it a highly versatile product that can quickly change to fit diverse purposes and situations across multiple industries. Because of foam tape's unique chemical qualities, these tapes are self-adhesive and pressure-sensitive. It is utilized for bonding, holding, splicing, and mounting because of its numerous advantages. These tapes are useful in various automotive, electrical, building, and construction industries. As the automotive industry expands, so does the foam tape market. To minimize vehicle weight, key market participants are turning their focus away from mechanical fasteners and toward automotive foam tapes with adhesive qualities. Rising demand for foam tape in the creation of lightweight materials and lower-cost components, as well as the development and growth of numerous end-user verticals in emerging economies, will all directly and positively impact the market's growth rate. An increase in the rate of industrialization, rising expenditure for research and development capabilities by major companies, surging demand for adhesives, and a growing focus on technological advancements and modernization in manufacturing techniques will pave the way for market growth.
Get an overview of this study by requesting a free sample
Wide range of applications of foam tape- Foam tape application is rising in the building and construction industries and the automobile industry. The rising usage of electronic devices and lightweight automobiles drives the foam tape market. Research conducted by the U.S. Department of Energy discovered that reducing vehicle weight by 10% might enhance fuel efficiency by 6-8%. The building and construction sector is a primary end-use market for foam tape, particularly in APAC, South America, and the Middle East.
High cost - Polyethylene, acrylic, polyurethane, nitrile, EVA, adhesives, release liners, and refined petroleum compounds are some raw components used to make foam tape. Most of these basic materials are petroleum derivatives which makes them expensive. The price increase of foam tape goods affects the global market for end users in the automotive, building, and construction industries.
Technological advancements - The need for biodegradable and ecologically friendly foam has recently increased due to strict environmental protection laws and consumer desire. Because of the advancement of hot-melt-based and U.V., The application of hot-melt and U.V. hot-melt technologies is rising, particularly in Asia. Curable foam tape is an example of a specialty tape innovation (U.V. and E.B. or both rubber and acrylic systems).
Few disadvantages- The market's growth will be hampered by a lack of raw material demand and supply due to the lockdown and volatility in their prices. Significant costs associated with R&D capabilities, the high investment involved in the production, and severe worldwide trade prohibitions will slow industry expansion.
The regions analyzed for the market include North America, Europe, South America, Asia Pacific, the Middle East, and Africa. Asia Pacific emerged as the largest market for the global foam tape market, with a 38% share of the market revenue in 2022.
Asia Pacific currently dominates the foam tape market with a 38% market revenue share in 2022. The burgeoning population in developing nations such as India and China is driving up demand for foam tape in the building industry. The Chinese construction market was estimated to be worth USD 1,049.2 billion in 2020, and by 2021, it is anticipated to have grown by USD 1,117.4 billion, or 6.5%. In addition, the total area of the new buildings in Japan was around 127.55 million square meters in 2019 and is projected to shrink by 10.5% in 2020 to 113.74 million square meters. Residential and commercial development in India has increased as the country's service sector has grown.
North America is expected to witness the fastest growth during the forecast period. Because of the region's well-established construction and automobile industries. In the automotive sector, foam tapes provide good temperature resistance and reduce fogging. The region will likely lead the worldwide foam tapes market during the forecast period due to the high penetration of the automotive industries. Polyurethane foam has environmental benefits like energy efficiency and weight reduction, promoting its use in the automotive industry.
Asia Pacific Region Foam Tape Market Share in 2022 - 38%
www.thebrainyinsights.com
www.thebrainyinsights.com
Check the geographical analysis of this market by requesting a free sample
The resin segment is divided into rubber, acrylic, and silicone. The acrylic segment dominated the market, with a market share of around 38.7% in 2022. Because of its outstanding cohesiveness and resilience to humidity, it can be employed in various environmental circumstances. Acrylic resin foam tapes are also less expensive than those created from other materials. It is widely used in the automotive industry due to its outstanding adhesive properties.
The technology segment is divided into hot-melt based, water-based, and solvent-based. The solvent-based segment dominated the market, with a market share of around 40.7% in 2022. Solvent-based technology is employed when high tensile strength, longevity, and peel and shear strength are required for foam tapes. Solvent-based foam tapes are also sturdy and temperature resistant, making them suitable for various applications.
The type segment is divided into polyurethane and polyethylene. The polyethylene segment dominated the market, with a market share of around 44.5% in 2022. Shock absorption, noise, and vibration cancellation are all characteristics of PE-backed foam tape. This expansion is due to its use in a variety of applications in the building and construction, as well as automotive industries, both of which are rapidly expanding in the APAC region as a result of rising private and public investments, a growing population, and a focus on the renewable energy sector.
| Attribute | Description |
|---|---|
| Market Size | Revenue (USD Billion) |
| Market size value in 2022 | USD 9.5 billion |
| Market size value in 2032 | USD 18.6 billion |
| CAGR (2023 to 2032) | 7% |
| Historical data | 2019-2021 |
| Base Year | 2022 |
| Forecast | 2023-2032 |
| Regional Segments | North America, Asia Pacific, Europe, Latin America, Middle East and Africa |
| Segments | Resin, Technology, Type |
As per The Brainy Insights, the size of the foam tape market was valued at USD 9.5 billion in 2022 to USD 18.6 billion by 2032.
The global foam tape market is growing at a CAGR of 7% during the forecast period 2023-2032.
Asia Pacific emerged as the largest foam tape market.
Key players in the foam tape market are 3M Company, Nitto Denko Corporation, Scapa Group Plc, 3F, Intertape Polymer Group, Inc., Lintec Corporation, Tesa S.E., Avery Dennison Corporation, Halco among others.
1. Introduction
1.1. Objectives of the Study
1.2. Market Definition
1.3. Research Scope
1.4. Currency
1.5. Key Target Audience
2. Research Methodology and Assumptions
3. Executive Summary
4. Premium Insights
4.1. Porter’s Five Forces Analysis
4.2. Value Chain Analysis
4.3. Top Investment Pockets
4.3.1. Market Attractiveness Analysis by Resin
4.3.2. Market Attractiveness Analysis by Technology
4.3.3. Market Attractiveness Analysis by Type
4.3.4. Market Attractiveness Analysis by Region
4.4. Industry Trends
5. Market Dynamics
5.1. Market Evaluation
5.2. Drivers
5.2.1. Wide range of applications of foam tape
5.3. Restraints
5.3.1. High cost
5.4. Opportunities
5.4.1. Technological advancements
5.5. Challenges
5.5.1. Few disadvantages
6. Global Foam Tape Market Analysis and Forecast, By Resin
6.1. Segment Overview
6.2. Rubber
6.3. Acrylic
6.4. Silicone
7. Global Foam Tape Market Analysis and Forecast, By Technology
7.1. Segment Overview
7.2. Hot-Melt Based
7.3. Water-Based
7.4. Solvent-Based
8. Global Foam Tape Market Analysis and Forecast, By Type
8.1. Segment Overview
8.2. Polyurethane
8.3. Polyethylene
9. Global Foam Tape Market Analysis and Forecast, By Regional Analysis
9.1. Segment Overview
9.2. North America
9.2.1. U.S.
9.2.2. Canada
9.2.3. Mexico
9.3. Europe
9.3.1. Germany
9.3.2. France
9.3.3. U.K.
9.3.4. Italy
9.3.5. Spain
9.4. Asia-Pacific
9.4.1. Japan
9.4.2. China
9.4.3. India
9.5. South America
9.5.1. Brazil
9.6. Middle East and Africa
9.6.1. UAE
9.6.2. South Africa
10. Global Foam Tape Market-Competitive Landscape
10.1. Overview
10.2. Market Share of Key Players in Global Foam Tape Market
10.2.1. Global Company Market Share
10.2.2. North America Company Market Share
10.2.3. Europe Company Market Share
10.2.4. APAC Company Market Share
10.3. Competitive Situations and Trends
10.3.1. Product Launches and Developments
10.3.2. Partnerships, Collaborations, and Agreements
10.3.3. Mergers & Acquisitions
10.3.4. Expansions
11. Company Profiles
11.1. 3M Company
11.1.1. Business Overview
11.1.2. Company Snapshot
11.1.3. Company Market Share Analysis
11.1.4. Company Product Portfolio
11.1.5. Recent Developments
11.1.6. SWOT Analysis
11.2. Nitto Denko Corporation
11.2.1. Business Overview
11.2.2. Company Snapshot
11.2.3. Company Market Share Analysis
11.2.4. Company Product Portfolio
11.2.5. Recent Developments
11.2.6. SWOT Analysis
11.3. Scapa Group Plc
11.3.1. Business Overview
11.3.2. Company Snapshot
11.3.3. Company Market Share Analysis
11.3.4. Company Product Portfolio
11.3.5. Recent Developments
11.3.6. SWOT Analysis
11.4. 3F
11.4.1. Business Overview
11.4.2. Company Snapshot
11.4.3. Company Market Share Analysis
11.4.4. Company Product Portfolio
11.4.5. Recent Developments
11.4.6. SWOT Analysis
11.5. Intertape Polymer Group, Inc.
11.5.1. Business Overview
11.5.2. Company Snapshot
11.5.3. Company Market Share Analysis
11.5.4. Company Product Portfolio
11.5.5. Recent Developments
11.5.6. SWOT Analysis
11.6. Lintec Corporation
11.6.1. Business Overview
11.6.2. Company Snapshot
11.6.3. Company Market Share Analysis
11.6.4. Company Product Portfolio
11.6.5. Recent Developments
11.6.6. SWOT Analysis
11.7. Tesa S.E.
11.7.1. Business Overview
11.7.2. Company Snapshot
11.7.3. Company Market Share Analysis
11.7.4. Company Product Portfolio
11.7.5. Recent Developments
11.7.6. SWOT Analysis
11.8. Avery Dennison Corporation
11.8.1. Business Overview
11.8.2. Company Snapshot
11.8.3. Company Market Share Analysis
11.8.4. Company Product Portfolio
11.8.5. Recent Developments
11.8.6. SWOT Analysis
11.9. Halco
11.9.1. Business Overview
11.9.2. Company Snapshot
11.9.3. Company Market Share Analysis
11.9.4. Company Product Portfolio
11.9.5. Recent Developments
11.9.6. SWOT Analysis
List of Table
1. Global Foam Tape Market, By Resin, 2019-2032 (USD Billion)
2. Global Rubber, Foam Tape Market, By Region, 2019-2032 (USD Billion)
3. Global Acrylic, Foam Tape Market, By Region, 2019-2032 (USD Billion)
4. Global Silicone, Foam Tape Market, By Region, 2019-2032 (USD Billion)
5. Global Foam Tape Market, By Technology, 2019-2032 (USD Billion)
6. Global Hot-Melt Based, Foam Tape Market, By Region, 2019-2032 (USD Billion)
7. Global Water-Based, Foam Tape Market, By Region, 2019-2032 (USD Billion)
8. Global Solvent-Based, Foam Tape Market, By Region, 2019-2032 (USD Billion)
9. Global Foam Tape Market, By Type, 2019-2032 (USD Billion)
10. Global Polyurethane, Foam Tape Market, By Region, 2019-2032 (USD Billion)
11. Global Polyethylene, Foam Tape Market, By Region, 2019-2032 (USD Billion)
12. North America Foam Tape Market, By Resin, 2019-2032 (USD Billion)
13. North America Foam Tape Market, By Technology, 2019-2032 (USD Billion)
14. North America Foam Tape Market, By Type, 2019-2032 (USD Billion)
15. U.S. Foam Tape Market, By Resin, 2019-2032 (USD Billion)
16. U.S. Foam Tape Market, By Technology, 2019-2032 (USD Billion)
17. U.S. Foam Tape Market, By Type, 2019-2032 (USD Billion)
18. Canada Foam Tape Market, By Resin, 2019-2032 (USD Billion)
19. Canada Foam Tape Market, By Technology, 2019-2032 (USD Billion)
20. Canada Foam Tape Market, By Type, 2019-2032 (USD Billion)
21. Mexico Foam Tape Market, By Resin, 2019-2032 (USD Billion)
22. Mexico Foam Tape Market, By Technology, 2019-2032 (USD Billion)
23. Mexico Foam Tape Market, By Type, 2019-2032 (USD Billion)
24. Europe Foam Tape Market, By Resin, 2019-2032 (USD Billion)
25. Europe Foam Tape Market, By Technology, 2019-2032 (USD Billion)
26. Europe Foam Tape Market, By Type, 2019-2032 (USD Billion)
27. Germany Foam Tape Market, By Resin, 2019-2032 (USD Billion)
28. Germany Foam Tape Market, By Technology, 2019-2032 (USD Billion)
29. Germany Foam Tape Market, By Type, 2019-2032 (USD Billion)
30. France Foam Tape Market, By Resin, 2019-2032 (USD Billion)
31. France Foam Tape Market, By Technology, 2019-2032 (USD Billion)
32. France Foam Tape Market, By Type, 2019-2032 (USD Billion)
33. U.K. Foam Tape Market, By Resin, 2019-2032 (USD Billion)
34. U.K. Foam Tape Market, By Technology, 2019-2032 (USD Billion)
35. U.K. Foam Tape Market, By Type, 2019-2032 (USD Billion)
36. Italy Foam Tape Market, By Resin, 2019-2032 (USD Billion)
37. Italy Foam Tape Market, By Technology, 2019-2032 (USD Billion)
38. Italy Foam Tape Market, By Type, 2019-2032 (USD Billion)
39. Spain Foam Tape Market, By Resin, 2019-2032 (USD Billion)
40. Spain Foam Tape Market, By Technology, 2019-2032 (USD Billion)
41. Spain Foam Tape Market, By Type, 2019-2032 (USD Billion)
42. Asia Pacific Foam Tape Market, By Resin, 2019-2032 (USD Billion)
43. Asia Pacific Foam Tape Market, By Technology, 2019-2032 (USD Billion)
44. Asia Pacific Foam Tape Market, By Type, 2019-2032 (USD Billion)
45. Japan Foam Tape Market, By Resin, 2019-2032 (USD Billion)
46. Japan Foam Tape Market, By Technology, 2019-2032 (USD Billion)
47. Japan Foam Tape Market, By Type, 2019-2032 (USD Billion)
48. China Foam Tape Market, By Resin, 2019-2032 (USD Billion)
49. China Foam Tape Market, By Technology, 2019-2032 (USD Billion)
50. China Foam Tape Market, By Type, 2019-2032 (USD Billion)
51. India Foam Tape Market, By Resin, 2019-2032 (USD Billion)
52. India Foam Tape Market, By Technology, 2019-2032 (USD Billion)
53. India Foam Tape Market, By Type, 2019-2032 (USD Billion)
54. South America Foam Tape Market, By Resin, 2019-2032 (USD Billion)
55. South America Foam Tape Market, By Technology, 2019-2032 (USD Billion)
56. South America Foam Tape Market, By Type, 2019-2032 (USD Billion)
57. Brazil Foam Tape Market, By Resin, 2019-2032 (USD Billion)
58. Brazil Foam Tape Market, By Technology, 2019-2032 (USD Billion)
59. Brazil Foam Tape Market, By Type, 2019-2032 (USD Billion)
60. Middle East and Africa Foam Tape Market, By Resin, 2019-2032 (USD Billion)
61. Middle East and Africa Foam Tape Market, By Technology, 2019-2032 (USD Billion)
62. Middle East and Africa Foam Tape Market, By Type, 2019-2032 (USD Billion)
63. UAE Foam Tape Market, By Resin, 2019-2032 (USD Billion)
64. UAE Foam Tape Market, By Technology, 2019-2032 (USD Billion)
65. UAE Foam Tape Market, By Type, 2019-2032 (USD Billion)
66. South Africa Foam Tape Market, By Resin, 2019-2032 (USD Billion)
67. South Africa Foam Tape Market, By Technology, 2019-2032 (USD Billion)
68. South Africa Foam Tape Market, By Type, 2019-2032 (USD Billion)
List of Figures
1. Global Foam Tape Market Segmentation
2. Global Foam Tape Market: Research Methodology
3. Market Size Estimation Methodology: Bottom-Up Approach
4. Market Size Estimation Methodology: Top-Down Approach
5. Data Triangulation
6. Porter’s Five Forces Analysis
7. Value Chain Analysis
8. Global Foam Tape Market Attractiveness Analysis by Resin
9. Global Foam Tape Market Attractiveness Analysis by Technology
10. Global Foam Tape Market Attractiveness Analysis by Type
11. Global Foam Tape Market Attractiveness Analysis by Region
12. Global Foam Tape Market: Dynamics
13. Global Foam Tape Market Share by Resin (2023 & 2032)
14. Global Foam Tape Market Share by Technology (2023 & 2032)
15. Global Foam Tape Market Share by Type (2023 & 2032)
16. Global Foam Tape Market Share by Regions (2023 & 2032)
17. Global Foam Tape Market Share by Company (2022)
This study forecasts global, regional, and country revenue from 2019 to 2032. Brainy Insights has segmented the global foam tape market based on the below-mentioned segments:
Global Foam Tape Market By Resin:
Global Foam Tape Market By Technology:
Global Foam Tape Market By Type:
Global Foam Tape Market By Region:
Research has its special purpose to undertake marketing efficiently. In this competitive scenario, businesses need information across all industry verticals; the information about customer wants, market demand, competition, industry trends, distribution channels etc. This information needs to be updated regularly because businesses operate in a dynamic environment. Our organization, The Brainy Insights incorporates scientific and systematic research procedures in order to get proper market insights and industry analysis for overall business success. The analysis consists of studying the market from a miniscule level wherein we implement statistical tools which helps us in examining the data with accuracy and precision.
Our research reports feature both; quantitative and qualitative aspects for any market. Qualitative information for any market research process are fundamental because they reveal the customer needs and wants, usage and consumption for any product/service related to a specific industry. This in turn aids the marketers/investors in knowing certain perceptions of the customers. Qualitative research can enlighten about the different product concepts and designs along with unique service offering that in turn, helps define marketing problems and generate opportunities. On the other hand, quantitative research engages with the data collection process through interviews, e-mail interactions, surveys and pilot studies. Quantitative aspects for the market research are useful to validate the hypotheses generated during qualitative research method, explore empirical patterns in the data with the help of statistical tools, and finally make the market estimations.
The Brainy Insights offers comprehensive research and analysis, based on a wide assortment of factual insights gained through interviews with CXOs and global experts and secondary data from reliable sources. Our analysts and industry specialist assume vital roles in building up statistical tools and analysis models, which are used to analyse the data and arrive at accurate insights with exceedingly informative research discoveries. The data provided by our organization have proven precious to a diverse range of companies, facilitating them to address issues such as determining which products/services are the most appealing, whether or not customers use the product in the manner anticipated, the purchasing intentions of the market and many others.
Our research methodology encompasses an idyllic combination of primary and secondary initiatives. Key phases involved in this process are listed below:

The phase involves the gathering and collecting of market data and its related information with the help of different sources & research procedures.

The data procurement stage involves in data gathering and collecting through various data sources.
This stage involves in extensive research. These data sources includes:
Purchased Database: Purchased databases play a crucial role in estimating the market sizes irrespective of the domain. Our purchased database includes:
Primary Research: The Brainy Insights interacts with leading companies and experts of the concerned domain to develop the analyst team’s market understanding and expertise. It improves and substantiates every single data presented in the market reports. Primary research mainly involves in telephonic interviews, E-mail interactions and face-to-face interviews with the raw material providers, manufacturers/producers, distributors, & independent consultants. The interviews that we conduct provides valuable data on market size and industry growth trends prevailing in the market. Our organization also conducts surveys with the various industry experts in order to gain overall insights of the industry/market. For instance, in healthcare industry we conduct surveys with the pharmacists, doctors, surgeons and nurses in order to gain insights and key information of a medical product/device/equipment which the customers are going to usage. Surveys are conducted in the form of questionnaire designed by our own analyst team. Surveys plays an important role in primary research because surveys helps us to identify the key target audiences of the market. Additionally, surveys helps to identify the key target audience engaged with the market. Our survey team conducts the survey by targeting the key audience, thus gaining insights from them. Based on the perspectives of the customers, this information is utilized to formulate market strategies. Moreover, market surveys helps us to understand the current competitive situation of the industry. To be precise, our survey process typically involve with the 360 analysis of the market. This analytical process begins by identifying the prospective customers for a product or service related to the market/industry to obtain data on how a product/service could fit into customers’ lives.

Secondary Research: The secondary data sources includes information published by the on-profit organizations such as World bank, WHO, company fillings, investor presentations, annual reports, national government documents, statistical databases, blogs, articles, white papers and others. From the annual report, we analyse a company’s revenue to understand the key segment and market share of that organization in a particular region. We analyse the company websites and adopt the product mapping technique which is important for deriving the segment revenue. In the product mapping method, we select and categorize the products offered by the companies catering to domain specific market, deduce the product revenue for each of the companies so as to get overall estimation of the market size. We also source data and analyses trends based on information received from supply side and demand side intermediaries in the value chain. The supply side denotes the data gathered from supplier, distributor, wholesaler and the demand side illustrates the data gathered from the end customers for respective market domain.

The supply side for a domain specific market is analysed by:
The demand side for the market is estimated through:
In-house Library: Apart from these third-party sources, we have our in-house library of qualitative and quantitative information. Our in-house database includes market data for various industry and domains. These data are updated on regular basis as per the changing market scenario. Our library includes, historic databases, internal audit reports and archives.
Sometimes there are instances where there is no metadata or raw data available for any domain specific market. For those cases, we use our expertise to forecast and estimate the market size in order to generate comprehensive data sets. Our analyst team adopt a robust research technique in order to produce the estimates:
Data Synthesis: This stage involves the analysis & mapping of all the information obtained from the previous step. It also involves in scrutinizing the data for any discrepancy observed while data gathering related to the market. The data is collected with consideration to the heterogeneity of sources. Robust scientific techniques are in place for synthesizing disparate data sets and provide the essential contextual information that can orient market strategies. The Brainy Insights has extensive experience in data synthesis where the data passes through various stages:


Market Deduction & Formulation: The final stage comprises of assigning data points at appropriate market spaces so as to deduce feasible conclusions. Analyst perspective & subject matter expert based holistic form of market sizing coupled with industry analysis also plays a crucial role in this stage.
This stage involves in finalization of the market size and numbers that we have collected from data integration step. With data interpolation, it is made sure that there is no gap in the market data. Successful trend analysis is done by our analysts using extrapolation techniques, which provide the best possible forecasts for the market.
Data Validation & Market Feedback: Validation is the most important step in the process. Validation & re-validation via an intricately designed process helps us finalize data-points to be used for final calculations.

The Brainy Insights interacts with leading companies and experts of the concerned domain to develop the analyst team’s market understanding and expertise. It improves and substantiates every single data presented in the market reports. The data validation interview and discussion panels are typically composed of the most experienced industry members. The participants include, however, are not limited to:
Moreover, we always validate our data and findings through primary respondents from all the major regions we are working on.


Free Customization
Fortune 500 Clients
Free Yearly Update On Purchase Of Multi/Corporate License
Companies Served Till Date