- +1-315-215-1633
- sales@thebrainyinsights.com

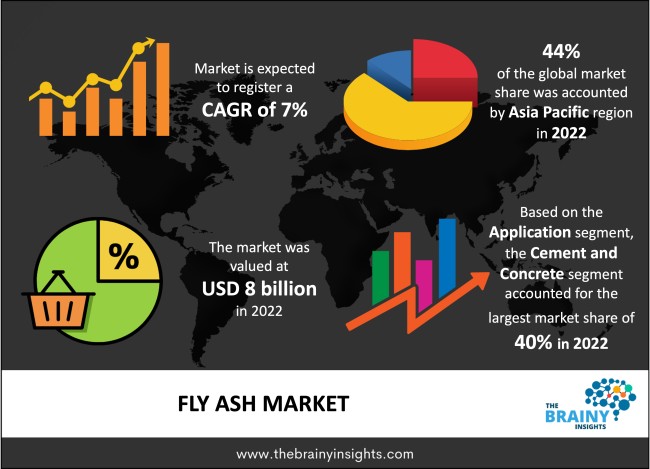
The global fly ash market is expected to grow from USD 8 billion in 2022 to USD 15.73 billion by 2032, at a CAGR of 7% from 2023-2032. The rising demand for fly ash bricks in the building and construction sector will augment the growth of the global fly ash market.
When pulverized coal is burned in a furnace in thermal power plants to produce energy, it leaves a residue called fly ash. Before, fly ash was considered to have a negative impact on the environment, considering it was of no use and primarily dumped in landfills. However, after studying the properties of fly ash, it was concluded that it is an excellent pozzolanic additive. This discovery led to its use in concrete to reduce the pores or permeability of the finished construction. Fly ash can be combined with lime and water to produce a material resembling cement. This product can be used to improve the strength and workability of concrete. It can be used in roads, buildings, flyovers, and embankments, among other things. Fly ash in concrete improves the workability of the mixture, making it more flexible for use in the building and construction industry. It also enhances the longevity of the concrete. Paints, adhesives, and compounds made of metal and plastic also use fly ash as a filler. It is also used in porcelain tiles, plaster, and ready-to-use cement. Fly ash is economical or cost-effective. It reduces the risk of concrete developing cracks or other faults. The fly ash bricks do not require heat energy for production, making them a sustainable and environmentally friendly choice. Fly is also utilized in soil and waste stabilization.
Get an overview of this study by requesting a free sample
January 2023 – Lafarge Canada will use the decommissioned Edmonton coal-fired power plant's site to recover and process fly ash under a contract the company has inked with energy provider TransAlta. The initiative will utilize the fly ash beneficiation technology known as the Ponded Ash Beneficiation System (PABS) from Ash-TEK. When making low-CO2 concrete, the processed ash can substitute up to 25% of the cement. With Lafarge Canada, TransAlta had agreed to supply renewable energy to the latter's Exshaw cement plant in February 2022.
The thriving building and construction industry – The growing world population and rising disposable income in the developing world are driving the demand for houses. The growing population is also driving the demand for a better quality of life which is being met by the rising government expenditure on infrastructure. The federal funding for developing healthcare, education, roads, and other public utilities has increased in the recent past. Furthermore, private investment in the building and construction is also garnering pace given the rising demand for smart houses, real estate, office spaces, commercial complexes and other infrastructure. Bilateral and multilateral agreements between nations aimed towards improving global connectivity are also significant driving factors in worldwide infrastructural development. Increasing infrastructural spending at private, commercial and public levels will propel the global fly ash market's demand. Fly ash is a pozzolanic additive in concrete and other construction materials like cement. Therefore, the increasing demand for building and construction will drive the demand for fly ash worldwide.
The inconsistent and poor quality of fly ash – While fly ash has numerous advantages in the building and construction industry, it is also plagued by certain limitations. The fly ash from thermal power plants is the most suitable and ideal for producing fly bricks. The quality of fly ash is determined by the combustion process in thermal plants. An inconsistent pattern in fly ash production contributes to low mechanical strength, longer setting times, restricted sizes and gradual concrete discolouration. Furthermore, the inconsistency in the material causes higher permeability, increasing the risk of damage to the concrete. This risk increases in winter, which restricts the use of fly ash in buildings and construction only to a few months. Therefore, the inconsistency combined with poor quality fly ash makes it unsuitable for the building and construction industry, hampering the market's growth.
The environmental benefits offered by fly ash bricks – The environmental benefits offered by fly ash bricks are two-fold. Firstly, fly ash is a by-product of the combustion of coal in thermal power plants. These emissions are major contributors to the rise in global warming. With the rising concerns about warming temperatures, the use of fly ash will reduce the emission burden on the earth and contribute to the national goals of achieving sustainable development by using the fly as bricks in infrastructural developments. Secondly, the production of fly ash bricks does not require combustion or kilns which are used in red brick production. Fly ash offers greater strength, durability and flexibility than conventional concrete. Therefore, the rising environmental concerns will encourage market stakeholders to adopt fly ash in the building and construction industry, offering lucrative opportunities to the market players in the forecast period. Positive government initiatives will also augment the global fly ash market's growth.
The growing shift towards renewable energy sources – The world primarily depends on natural resources such as fossil fuels and crude oil and has for meeting most of its energy needs. Fossil fuels are limited and non-renewable in nature. Additionally, the over-exploitation of these natural resources has reduced their stock in nature and contributed to the rising global temperatures. Therefore, the nations have agreed to shift towards renewable and sustainable energy sources like solar, wind and hydroelectric power. The shift will ensure an uninterrupted energy supply, sustainable development and no emissions. The growing shift towards renewable energy sources is a shift away from thermal power. Thermal power forms the basis of fly ash, and shifting away from it would challenge the market's growth.
The regions analyzed for the market include North America, Europe, South America, Asia Pacific, the Middle East, and Africa. The Asia Pacific emerged as the largest global fly ash market, with a 44% market revenue share in 2022. China and India rank the highest in the population charts. India is witnessing steady population growth, which is expected to continue contributing to the vast consumer base of the region that will drive the demand for infrastructural development. The region's vast population is witnessing an increase in per capita income and rapid urbanization, which has increased the demand for housing, healthcare, education, commercial spaces, and other public utilities. The increase in demand for housing is catered by the well-established building and construction private sector with thriving cement and steel production units in India and China. The region's countries primarily depend on thermal power to meet their energy needs, which will bode well for the fly ash market. The rising concerns about thermal emissions and increasing demand for building and construction have encouraged the government authorities to push for the production and consumption of fly ash, thereby contributing to the market's growth. The increasing housing needs and private and public infrastructural investment will propel the Asia Pacific fly ash market's growth and development in the forecast period.
Asia Pacific Region Fly Ash Market Share in 2022 - 44%
www.thebrainyinsights.com
Check the geographical analysis of this market by requesting a free sample
The type segment is divided into class C and class F. The class F segment dominated the market with a market share of around 60% in 2022. The difference is these two types of fly ash are derived from their genesis. For instance, class C fly ash is derived from the combustion of lignite. In contrast, class F fly ash is based on bituminous and anthracite coals. Class F fly ash also contains trace amounts of quartz, mullite, and magnetite. The thermal power plants predominantly use bituminous coal for energy production, which translates to class F fly ash dominating the global market. Furthermore, class F fly ash creates denser concrete with higher mechanical strength. The permeability of the concrete is also reduced. The greater silica content in class F fly ash makes it more suitable for the building and construction industry. Therefore, the class F fly ash segment dominates the global market.
The application is divided into cement and concrete, waste stabilization, oilfield service, fills and embankments, mining, road stabilization and others. The cement and concrete segment dominated the market with a market share of around 40% in 2022. Cement is a binder which is used in combination with other materials. It facilitates the biding, which sets, hardens, and adheres to other materials. Concrete is a composite substance of fine and coarse materials bonded with fluid cement. Concrete is the second most used material after water that is used around the world on a daily basis. Concrete is used extensively in the building and construction industry. Fly ash is a pozzolanic additive that enhances the concrete's strength and longevity. Fly ash concrete uses less water and is more economical than red bricks. It is also environmentally friendly. The multiple benefits fly ash offers in cement and concrete have recently increased their adoption. With the increase in building and construction worldwide, the cement and concrete segment is anticipated to dominate the application segment of the global fly ash market.
| Attribute | Description |
|---|---|
| Market Size | Revenue (USD Billion) |
| Market size value in 2022 | USD 8 Billion |
| Market size value in 2032 | USD 15.73 Billion |
| CAGR (2023 to 2032) | 7% |
| Historical data | 2019-2021 |
| Base Year | 2022 |
| Forecast | 2023-2032 |
| Regional Segments | The regions examined for the market are Europe, Asia Pacific, North America, South America, and Middle East & Africa. |
| Segments | The research segment is based on the type and application. |
As per The Brainy Insights, the size of the global fly ash market was valued at USD 8 billion in 2022 to USD 15.73 billion by 2032.
Global fly ash market is growing at a CAGR of 7% during the forecast period 2023-2032.
The market's growth will be influenced by the thriving building and construction industry.
The inconsistent and poor quality of fly ash could hampers the market growth.
1. Introduction
1.1. Objectives of the Study
1.2. Market Definition
1.3. Research Scope
1.4. Currency
1.5. Key Target Audience
2. Research Methodology and Assumptions
3. Executive Summary
4. Premium Insights
4.1. Porter’s Five Forces Analysis
4.2. Value Chain Analysis
4.3. Top Investment Pockets
4.3.1. Market Attractiveness Analysis By Type
4.3.2. Market Attractiveness Analysis By Application
4.3.3. Market Attractiveness Analysis By Region
4.4. Industry Trends
5. Market Dynamics
5.1. Market Evaluation
5.2. Drivers
5.2.1. The thriving building and construction industry
5.3. Restraints
5.3.1. The inconsistent and poor quality of fly ash
5.4. Opportunities
5.4.1. The environmental benefits offered by fly ash bricks
5.5. Challenges
5.5.1. The growing shift towards renewable energy sources
6. Global Fly Ash Market Analysis and Forecast, By Type
6.1. Segment Overview
6.2. Class C
6.3. Class F
7. Global Fly Ash Market Analysis and Forecast, By Application
7.1. Segment Overview
7.2. Cement and Concrete
7.3. Waste Stabilization
7.4. Oilfield Service
7.5. Fills and Embankments
7.6. Mining
7.7. Road Stabilization
7.8. Others
8. Global Fly Ash Market Analysis and Forecast, By Regional Analysis
8.1. Segment Overview
8.2. North America
8.2.1. U.S.
8.2.2. Canada
8.2.3. Mexico
8.3. Europe
8.3.1. Germany
8.3.2. France
8.3.3. U.K.
8.3.4. Italy
8.3.5. Spain
8.4. Asia-Pacific
8.4.1. Japan
8.4.2. China
8.4.3. India
8.5. South America
8.5.1. Brazil
8.6. Middle East and Africa
8.6.1. UAE
8.6.2. South Africa
9. Global Fly Ash Market-Competitive Landscape
9.1. Overview
9.2. Market Share of Key Players in the Fly Ash Market
9.2.1. Global Company Market Share
9.2.2. North America Company Market Share
9.2.3. Europe Company Market Share
9.2.4. APAC Company Market Share
9.3. Competitive Situations and Trends
9.3.1. Product Launches and Developments
9.3.2. Partnerships, Collaborations, and Agreements
9.3.3. Mergers & Acquisitions
9.3.4. Expansions
10. Company Profiles
10.1. Aggregate Industries
10.1.1. Business Overview
10.1.2. Company Snapshot
10.1.3. Company Market Share Analysis
10.1.4. Company Product Portfolio
10.1.5. Recent Developments
10.1.6. SWOT Analysis
10.2. Ashtech Pvt. Ltd.
10.2.1. Business Overview
10.2.2. Company Snapshot
10.2.3. Company Market Share Analysis
10.2.4. Company Product Portfolio
10.2.5. Recent Developments
10.2.6. SWOT Analysis
10.3. Boral Ltd.
10.3.1. Business Overview
10.3.2. Company Snapshot
10.3.3. Company Market Share Analysis
10.3.4. Company Product Portfolio
10.3.5. Recent Developments
10.3.6. SWOT Analysis
10.4. Cement Australia Pty Ltd
10.4.1. Business Overview
10.4.2. Company Snapshot
10.4.3. Company Market Share Analysis
10.4.4. Company Product Portfolio
10.4.5. Recent Developments
10.4.6. SWOT Analysis
10.5. Cemex S.A.B. de C.V.
10.5.1. Business Overview
10.5.2. Company Snapshot
10.5.3. Company Market Share Analysis
10.5.4. Company Product Portfolio
10.5.5. Recent Developments
10.5.6. SWOT Analysis
10.6. Charah LLC
10.6.1. Business Overview
10.6.2. Company Snapshot
10.6.3. Company Market Share Analysis
10.6.4. Company Product Portfolio
10.6.5. Recent Developments
10.6.6. SWOT Analysis
10.7. Lafarge America Inc.
10.7.1. Business Overview
10.7.2. Company Snapshot
10.7.3. Company Market Share Analysis
10.7.4. Company Product Portfolio
10.7.5. Recent Developments
10.7.6. SWOT Analysis
10.8. Salt River Materials Group
10.8.1. Business Overview
10.8.2. Company Snapshot
10.8.3. Company Market Share Analysis
10.8.4. Company Product Portfolio
10.8.5. Recent Developments
10.8.6. SWOT Analysis
10.9. Separation Technologies
10.9.1. Business Overview
10.9.2. Company Snapshot
10.9.3. Company Market Share Analysis
10.9.4. Company Product Portfolio
10.9.5. Recent Developments
10.9.6. SWOT Analysis
10.10. Tarmac Holdings Ltd.
10.10.1. Business Overview
10.10.2. Company Snapshot
10.10.3. Company Market Share Analysis
10.10.4. Company Component Portfolio
10.10.5. Recent Developments
10.10.6. SWOT Analysis
List of Table
1. Global Fly Ash Market, By Type, 2019-2032 (USD Billion)
2. Global Class C Fly Ash Market, By Region, 2019-2032 (USD Billion)
3. Global Class F Fly Ash Market, By Region, 2019-2032 (USD Billion)
4. Global Fly Ash Market, By Application, 2019-2032 (USD Billion)
5. Global Cement and Concrete Fly Ash Market, By Region, 2019-2032 (USD Billion)
6. Global Waste Stabilization Fly Ash Market, By Region, 2019-2032 (USD Billion)
7. Global Oilfield Service Fly Ash Market, By Region, 2019-2032 (USD Billion)
8. Global Fills and Embankments Fly Ash Market, By Region, 2019-2032 (USD Billion)
9. Global Mining Fly Ash Market, By Region, 2019-2032 (USD Billion)
10. Global Road Stabilization Fly Ash Market, By Region, 2019-2032 (USD Billion)
11. Global Others Fly Ash Market, By Region, 2019-2032 (USD Billion)
12. Global Fly Ash Market, By Region, 2019-2032 (USD Billion)
13. North America Fly Ash Market, By Type, 2019-2032 (USD Billion)
14. North America Fly Ash Market, By Application, 2019-2032 (USD Billion)
15. U.S. Fly Ash Market, By Type, 2019-2032 (USD Billion)
16. U.S. Fly Ash Market, By Application, 2019-2032 (USD Billion)
17. Canada Fly Ash Market, By Type, 2019-2032 (USD Billion)
18. Canada Fly Ash Market, By Application, 2019-2032 (USD Billion)
19. Mexico Fly Ash Market, By Type, 2019-2032 (USD Billion)
20. Mexico Fly Ash Market, By Application, 2019-2032 (USD Billion)
21. Europe Fly Ash Market, By Type, 2019-2032 (USD Billion)
22. Europe Fly Ash Market, By Application, 2019-2032 (USD Billion)
23. Germany Fly Ash Market, By Type, 2019-2032 (USD Billion)
24. Germany Fly Ash Market, By Application, 2019-2032 (USD Billion)
25. France Fly Ash Market, By Type, 2019-2032 (USD Billion)
26. France Fly Ash Market, By Application, 2019-2032 (USD Billion)
27. U.K. Fly Ash Market, By Type, 2019-2032 (USD Billion)
28. U.K. Fly Ash Market, By Application, 2019-2032 (USD Billion)
29. Italy Fly Ash Market, By Type, 2019-2032 (USD Billion)
30. Italy Fly Ash Market, By Application, 2019-2032 (USD Billion)
31. Spain Fly Ash Market, By Type, 2019-2032 (USD Billion)
32. Spain Fly Ash Market, By Application, 2019-2032 (USD Billion)
33. Asia Pacific Fly Ash Market, By Type, 2019-2032 (USD Billion)
34. Asia Pacific Fly Ash Market, By Application, 2019-2032 (USD Billion)
35. Japan Fly Ash Market, By Type, 2019-2032 (USD Billion)
36. Japan Fly Ash Market, By Application, 2019-2032 (USD Billion)
37. China Fly Ash Market, By Type, 2019-2032 (USD Billion)
38. China Fly Ash Market, By Application, 2019-2032 (USD Billion)
39. India Fly Ash Market, By Type, 2019-2032 (USD Billion)
40. India Fly Ash Market, By Application, 2019-2032 (USD Billion)
41. South America Fly Ash Market, By Type, 2019-2032 (USD Billion)
42. South America Fly Ash Market, By Application, 2019-2032 (USD Billion)
43. Brazil Fly Ash Market, By Type, 2019-2032 (USD Billion)
44. Brazil Fly Ash Market, By Application, 2019-2032 (USD Billion)
45. Middle East and Africa Fly Ash Market, By Type, 2019-2032 (USD Billion)
46. Middle East and Africa Fly Ash Market, By Application, 2019-2032 (USD Billion)
47. UAE Fly Ash Market, By Type, 2019-2032 (USD Billion)
48. UAE Fly Ash Market, By Application, 2019-2032 (USD Billion)
49. South Africa Fly Ash Market, By Type, 2019-2032 (USD Billion)
50. South Africa Fly Ash Market, By Application, 2019-2032 (USD Billion)
List of Figures
1. Global Fly Ash Market Segmentation
2. Fly Ash Market: Research Methodology
3. Market Size Estimation Methodology: Bottom-Up Approach
4. Market Size Estimation Methodology: Top-Down Approach
5. Data Triangulation
6. Porter’s Five Forces Analysis
7. Value Chain Analysis
8. Global Fly Ash Market Attractiveness Analysis By Type
9. Global Fly Ash Market Attractiveness Analysis By Application
10. Global Fly Ash Market Attractiveness Analysis By Region
11. Global Fly Ash Market: Dynamics
12. Global Fly Ash Market Share by Type (2022 & 2032)
13. Global Fly Ash Market Share by Application (2022 & 2032)
14. Global Fly Ash Market Share by Regions (2022 & 2032)
15. Global Fly Ash Market Share by Company (2022)
This study forecasts revenue at global, regional, and country levels from 2019 to 2032. The Brainy Insights has segmented the global fly ash market based on below mentioned segments:
Global Fly Ash Market by Type:
Global Fly Ash Market by Application:
Global Fly Ash Market by Region:
Research has its special purpose to undertake marketing efficiently. In this competitive scenario, businesses need information across all industry verticals; the information about customer wants, market demand, competition, industry trends, distribution channels etc. This information needs to be updated regularly because businesses operate in a dynamic environment. Our organization, The Brainy Insights incorporates scientific and systematic research procedures in order to get proper market insights and industry analysis for overall business success. The analysis consists of studying the market from a miniscule level wherein we implement statistical tools which helps us in examining the data with accuracy and precision.
Our research reports feature both; quantitative and qualitative aspects for any market. Qualitative information for any market research process are fundamental because they reveal the customer needs and wants, usage and consumption for any product/service related to a specific industry. This in turn aids the marketers/investors in knowing certain perceptions of the customers. Qualitative research can enlighten about the different product concepts and designs along with unique service offering that in turn, helps define marketing problems and generate opportunities. On the other hand, quantitative research engages with the data collection process through interviews, e-mail interactions, surveys and pilot studies. Quantitative aspects for the market research are useful to validate the hypotheses generated during qualitative research method, explore empirical patterns in the data with the help of statistical tools, and finally make the market estimations.
The Brainy Insights offers comprehensive research and analysis, based on a wide assortment of factual insights gained through interviews with CXOs and global experts and secondary data from reliable sources. Our analysts and industry specialist assume vital roles in building up statistical tools and analysis models, which are used to analyse the data and arrive at accurate insights with exceedingly informative research discoveries. The data provided by our organization have proven precious to a diverse range of companies, facilitating them to address issues such as determining which products/services are the most appealing, whether or not customers use the product in the manner anticipated, the purchasing intentions of the market and many others.
Our research methodology encompasses an idyllic combination of primary and secondary initiatives. Key phases involved in this process are listed below:

The phase involves the gathering and collecting of market data and its related information with the help of different sources & research procedures.

The data procurement stage involves in data gathering and collecting through various data sources.
This stage involves in extensive research. These data sources includes:
Purchased Database: Purchased databases play a crucial role in estimating the market sizes irrespective of the domain. Our purchased database includes:
Primary Research: The Brainy Insights interacts with leading companies and experts of the concerned domain to develop the analyst team’s market understanding and expertise. It improves and substantiates every single data presented in the market reports. Primary research mainly involves in telephonic interviews, E-mail interactions and face-to-face interviews with the raw material providers, manufacturers/producers, distributors, & independent consultants. The interviews that we conduct provides valuable data on market size and industry growth trends prevailing in the market. Our organization also conducts surveys with the various industry experts in order to gain overall insights of the industry/market. For instance, in healthcare industry we conduct surveys with the pharmacists, doctors, surgeons and nurses in order to gain insights and key information of a medical product/device/equipment which the customers are going to usage. Surveys are conducted in the form of questionnaire designed by our own analyst team. Surveys plays an important role in primary research because surveys helps us to identify the key target audiences of the market. Additionally, surveys helps to identify the key target audience engaged with the market. Our survey team conducts the survey by targeting the key audience, thus gaining insights from them. Based on the perspectives of the customers, this information is utilized to formulate market strategies. Moreover, market surveys helps us to understand the current competitive situation of the industry. To be precise, our survey process typically involve with the 360 analysis of the market. This analytical process begins by identifying the prospective customers for a product or service related to the market/industry to obtain data on how a product/service could fit into customers’ lives.

Secondary Research: The secondary data sources includes information published by the on-profit organizations such as World bank, WHO, company fillings, investor presentations, annual reports, national government documents, statistical databases, blogs, articles, white papers and others. From the annual report, we analyse a company’s revenue to understand the key segment and market share of that organization in a particular region. We analyse the company websites and adopt the product mapping technique which is important for deriving the segment revenue. In the product mapping method, we select and categorize the products offered by the companies catering to domain specific market, deduce the product revenue for each of the companies so as to get overall estimation of the market size. We also source data and analyses trends based on information received from supply side and demand side intermediaries in the value chain. The supply side denotes the data gathered from supplier, distributor, wholesaler and the demand side illustrates the data gathered from the end customers for respective market domain.

The supply side for a domain specific market is analysed by:
The demand side for the market is estimated through:
In-house Library: Apart from these third-party sources, we have our in-house library of qualitative and quantitative information. Our in-house database includes market data for various industry and domains. These data are updated on regular basis as per the changing market scenario. Our library includes, historic databases, internal audit reports and archives.
Sometimes there are instances where there is no metadata or raw data available for any domain specific market. For those cases, we use our expertise to forecast and estimate the market size in order to generate comprehensive data sets. Our analyst team adopt a robust research technique in order to produce the estimates:
Data Synthesis: This stage involves the analysis & mapping of all the information obtained from the previous step. It also involves in scrutinizing the data for any discrepancy observed while data gathering related to the market. The data is collected with consideration to the heterogeneity of sources. Robust scientific techniques are in place for synthesizing disparate data sets and provide the essential contextual information that can orient market strategies. The Brainy Insights has extensive experience in data synthesis where the data passes through various stages:


Market Deduction & Formulation: The final stage comprises of assigning data points at appropriate market spaces so as to deduce feasible conclusions. Analyst perspective & subject matter expert based holistic form of market sizing coupled with industry analysis also plays a crucial role in this stage.
This stage involves in finalization of the market size and numbers that we have collected from data integration step. With data interpolation, it is made sure that there is no gap in the market data. Successful trend analysis is done by our analysts using extrapolation techniques, which provide the best possible forecasts for the market.
Data Validation & Market Feedback: Validation is the most important step in the process. Validation & re-validation via an intricately designed process helps us finalize data-points to be used for final calculations.

The Brainy Insights interacts with leading companies and experts of the concerned domain to develop the analyst team’s market understanding and expertise. It improves and substantiates every single data presented in the market reports. The data validation interview and discussion panels are typically composed of the most experienced industry members. The participants include, however, are not limited to:
Moreover, we always validate our data and findings through primary respondents from all the major regions we are working on.


Free Customization
Fortune 500 Clients
Free Yearly Update On Purchase Of Multi/Corporate License
Companies Served Till Date