- +1-315-215-1633
- sales@thebrainyinsights.com

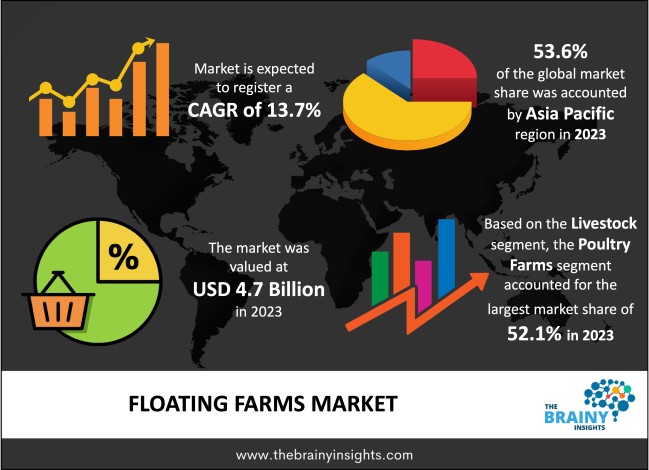
The Floating Farms Market was valued at USD 4.7 billion in 2023 and grew at a CAGR of 13.7% from 2024 to 2033. The floating farm market is an agricultural concept based on advanced technology that is less reliant on the environment, more effective at generating a good volume, and takes less work. It is separated into livestock, vegetable, and food markets. Consequently, the concept of floating farms has captured the imagination of business leaders worldwide.
Artificial farms built over a body of water, such as a pond, lake, or marsh, commonly found in urban areas, are known as floating farms. A novel concept that is thought to help address the problems of nutrition and climate change is the floating farm. These farms promote poultry, dairy, or agricultural farming, or a mix of the three. Under it, man-made platforms or buildings are built to support agricultural growth, and water is delivered straight from the source. The floating farms are less harmful to the environment because they operate on renewable energy produced by water.
Get an overview of this study by requesting a free sample
A wide number of sectors, particularly municipal governments, global organizations, classification organizations, and insurance firms, have expressed a great deal of interest in the practice of floating farming. However, in contrast to other types of conventional floating structures, rather than being streamlined, the coordination across multiple bodies is distributed, specialized, and project-specific. It is expected that this process will evolve into the all-important, complete structure for marine floating farming in the next years. However, one of the main factors driving the market's growth is floating farming, an idea for environmentally friendly farming at sea that uses less water and is immune to weather fluctuations.
There are many engineering obstacles in designing and building stable floating structures that can endure the shifting forces of water, waves, and weather. It is essential to guarantee the robustness and security of these constructions. Additionally, floating farms might have expensive starting expenditures and continuous maintenance requirements. The materials and specific technology needed for stability, buoyancy, and water management may add to the total cost.
Using water surfaces—lakes, rivers, and oceans—that aren't usually used for agriculture is made possible by floating farms. This aids in the best use of existing land, particularly in crowded places with a shortage of arable land. Additionally, putting floating farms in or close to cities can support regional and sustainable agriculture. Because of the shorter travel lengths, the distribution of food has a lower carbon footprint.
Asia Pacific led the market in 2023 with the largest market share of 53.6%. The population of the Asia-Pacific area is substantial and expanding quickly. It is anticipated that food demand would increase as urbanization progresses. Floating farms, especially those close to cities, could contribute to meeting this demand by supplying locally grown and fresh vegetables. Governments, businesses, and academic institutions working together could hasten the creation and implementation of floating farms. These collaborations could support research projects, the sharing of expertise, and the expansion of successful projects.
Asia Pacific Region Floating Farms Market Share in 2023 - 53.6%
www.thebrainyinsights.com
Check the geographical analysis of this market by requesting a free sample
The Poultry farms segment dominated the global market in 2023 with a market share of 52.1%. The global floating farm and the protein farms market split the highest revenue due to the increase in demand for poultry products. The poultry farm is credited with making the largest contribution to the global floating farm growth plan 2025–2030 due to increased demand and technological advancements in the production of chicken and eggs. Furthermore, it is expected that 3000 metric tons of seafood will be produced during the projected time to meet the need for high-protein food in the region and worldwide.
The Dairy products segment dominated the global market in 2023 with a market share of 51.2%. Worldwide consumption of dairy products is impacted by several factors, including changing dietary preferences, population growth, and economic levels. Also, the dairy market has been impacted by consumer awareness of wellness and health. The development and promotion of goods with extra nutritional advantages, such as probiotics, vitamins, and minerals, is a priority.
The Building based segment dominated the global market in 2023 with a market share of 66.1%. An essential component of floating farms is the architecture of their building-based constructions. For agricultural operations, such as crop cultivation and maybe livestock housing, these structures must offer a sturdy and secure environment. Moreover, modularity and adaptability are frequently highlighted in building-based floating farms. This makes it simple to expand and modify the farm to fit various crop varieties or farming techniques.
| Attribute | Description |
|---|---|
| Market Size | Revenue (USD Billion) |
| Market size value in 2023 | USD 4.7 Billion |
| Market size value in 2033 | USD 14.9 Billion |
| CAGR (2024 to 2033) | 13.7% |
| Historical data | 2020-2022 |
| Base Year | 2023 |
| Forecast | 2024-2033 |
| Region | The regions analyzed for the market are Asia Pacific, Europe, South America, North America, and Middle East & Africa. Furthermore, the regions are further analyzed at the country level. |
| Segments | Livestock, Consumable product, Building structure |
As per The Brainy Insights, the size of the floating farms market was valued at USD 4.7 billion in 2023 to USD 14.9 billion by 2033.
The global floating farms market is growing at a CAGR of 13.7% during the forecast period 2024-2033.
The Asia Pacific region emerged as the largest market for the floating farms.
The water conservation and efficiency will influence the market's growth.
1. Introduction
1.1. Objectives of the Study
1.2. Market Definition
1.3. Research Scope
1.4. Currency
1.5. Key Target Audience
2. Research Methodology and Assumptions
3. Executive Summary
4. Premium Insights
4.1. Porter’s Five Forces Analysis
4.2. Value Chain Analysis
4.3. Top Investment Pockets
4.3.1. Market Attractiveness Analysis by Livestock
4.3.2. Market Attractiveness Analysis by Consumable Product
4.3.3. Market Attractiveness Analysis by Building Structure
4.3.4. Market Attractiveness Analysis by Region
4.4. Industry Trends
5. Market Dynamics
5.1. Market Evaluation
5.2. Drivers
5.2.1. Water Conservation and Efficiency
5.3. Restraints
5.3.1. Technological and Infrastructural
5.4. Opportunities
5.4.1. Expansion of Sustainable Agriculture
5.5. Challenges
5.5.1. Public Perception and Acceptance
6. Global Floating Farms Market Analysis and Forecast, By Livestock
6.1. Segment Overview
6.2. Cow Shelters
6.3. Poultry Farms
6.4. Fishing
6.5. Others
7. Global Floating Farms Market Analysis and Forecast, By Consumable Product
7.1. Segment Overview
7.2. Dairy Products
7.3. Vegetable
7.4. Fruit
7.5. Grain
7.6. Others
8. Global Floating Farms Market Analysis and Forecast, By Building Structure
8.1. Segment Overview
8.2. Building
8.3. Shipping
9. Global Floating Farms Market Analysis and Forecast, By Regional Analysis
9.1. Segment Overview
9.2. North America
9.2.1. U.S.
9.2.2. Canada
9.2.3. Mexico
9.3. Europe
9.3.1. Germany
9.3.2. France
9.3.3. U.K.
9.3.4. Italy
9.3.5. Spain
9.4. Asia-Pacific
9.4.1. Japan
9.4.2. China
9.4.3. India
9.5. South America
9.5.1. Brazil
9.6. Middle East and Africa
9.6.1. UAE
9.6.2. South Africa
10. Global Floating Farms Market-Competitive Landscape
10.1. Overview
10.2. Market Share of Key Players in the Floating Farms Market
10.2.1. Global Company Market Share
10.2.2. North America Company Market Share
10.2.3. Europe Company Market Share
10.2.4. APAC Company Market Share
10.3. Competitive Situations and Trends
10.3.1. Product Launches and Developments
10.3.2. Partnerships, Collaborations, and Agreements
10.3.3. Mergers & Acquisitions
10.3.4. Expansions
11. Company Profiles
11.1. Qingdao Conson Development Group Co Ltd
11.1.1. Business Overview
11.1.2. Company Snapshot
11.1.3. Company Market Share Analysis
11.1.4. Company Product Portfolio
11.1.5. Recent Developments
11.1.6. SWOT Analysis
11.2. SalMar ASA
11.2.1. Business Overview
11.2.2. Company Snapshot
11.2.3. Company Market Share Analysis
11.2.4. Company Product Portfolio
11.2.5. Recent Developments
11.2.6. SWOT Analysis
11.3. Lingalaks AS
11.3.1. Business Overview
11.3.2. Company Snapshot
11.3.3. Company Market Share Analysis
11.3.4. Company Product Portfolio
11.3.5. Recent Developments
11.3.6. SWOT Analysis
11.4. Saudi Basic Industries Corporation (SABIC)
11.4.1. Business Overview
11.4.2. Company Snapshot
11.4.3. Company Market Share Analysis
11.4.4. Company Product Portfolio
11.4.5. Recent Developments
11.4.6. SWOT Analysis
11.5. Ocean Arks Tech.
11.5.1. Business Overview
11.5.2. Company Snapshot
11.5.3. Company Market Share Analysis
11.5.4. Company Product Portfolio
11.5.5. Recent Developments
11.5.6. SWOT Analysis
11.6. Al Qamra holding
11.6.1. Business Overview
11.6.2. Company Snapshot
11.6.3. Company Market Share Analysis
11.6.4. Company Product Portfolio
11.6.5. Recent Developments
11.6.6. SWOT Analysis
11.7. Ocean Era, Inc.
11.7.1. Business Overview
11.7.2. Company Snapshot
11.7.3. Company Market Share Analysis
11.7.4. Company Product Portfolio
11.7.5. Recent Developments
11.7.6. SWOT Analysis
11.8. Cellucor
11.8.1. Business Overview
11.8.2. Company Snapshot
11.8.3. Company Market Share Analysis
11.8.4. Company Product Portfolio
11.8.5. Recent Developments
11.8.6. SWOT Analysis
11.9. Floating Farms
11.9.1. Business Overview
11.9.2. Company Snapshot
11.9.3. Company Market Share Analysis
11.9.4. Company Product Portfolio
11.9.5. Recent Developments
11.9.6. SWOT Analysis
11.10. AgriSea
11.10.1. Business Overview
11.10.2. Company Snapshot
11.10.3. Company Market Share Analysis
11.10.4. Company Product Portfolio
11.10.5. Recent Developments
11.10.6. SWOT Analysis
11.11. Singapore Aquaculture Technologies
11.11.1. Business Overview
11.11.2. Company Snapshot
11.11.3. Company Market Share Analysis
11.11.4. Company Product Portfolio
11.11.5. Recent Developments
11.11.6. SWOT Analysis
11.12. Bangladesh Agricultural Research Institute (BARI)
11.12.1. Business Overview
11.12.2. Company Snapshot
11.12.3. Company Market Share Analysis
11.12.4. Company Product Portfolio
11.12.5. Recent Developments
11.12.6. SWOT Analysis
List of Table
1. Global Floating Farms Market, By Livestock, 2020-2033 (USD Billion)
2. Global Cow Shelters Floating Farms Market, By Region, 2020-2033 (USD Billion)
3. Global Poultry Farms Floating Farms Market, By Region, 2020-2033 (USD Billion)
4. Global Fishing Floating Farms Market, By Region, 2020-2033 (USD Billion)
5. Global Others Floating Farms Market, By Region, 2020-2033 (USD Billion)
6. Global Floating Farms Market, By Consumable Product, 2020-2033 (USD Billion)
7. Global Dairy Products Floating Farms Market, By Region, 2020-2033 (USD Billion)
8. Global Vegetable Floating Farms Market, By Region, 2020-2033 (USD Billion)
9. Global Fruit Floating Farms Market, By Region, 2020-2033 (USD Billion)
10. Global Grain Floating Farms Market, By Region, 2020-2033 (USD Billion)
11. Global Others Floating Farms Market, By Region, 2020-2033 (USD Billion)
12. Global Floating Farms Market, By Building Structure, 2020-2033 (USD Billion)
13. Global Building Floating Farms Market, By Region, 2020-2033 (USD Billion)
14. Global Shipping Floating Farms Market, By Region, 2020-2033 (USD Billion)
15. Global Floating Farms Market, By Region, 2020-2033 (USD Billion)
16. North America Floating Farms Market, By Livestock, 2020-2033 (USD Billion)
17. North America Floating Farms Market, By Consumable Product, 2020-2033 (USD Billion)
18. North America Floating Farms Market, By Building Structure, 2020-2033 (USD Billion)
19. U.S. Floating Farms Market, By Livestock, 2020-2033 (USD Billion)
20. U.S. Floating Farms Market, By Consumable Product, 2020-2033 (USD Billion)
21. U.S. Floating Farms Market, By Building Structure, 2020-2033 (USD Billion)
22. Canada Floating Farms Market, By Livestock, 2020-2033 (USD Billion)
23. Canada Floating Farms Market, By Consumable Product, 2020-2033 (USD Billion)
24. Canada Floating Farms Market, By Building Structure, 2020-2033 (USD Billion)
25. Mexico Floating Farms Market, By Livestock, 2020-2033 (USD Billion)
26. Mexico Floating Farms Market, By Consumable Product, 2020-2033 (USD Billion)
27. Mexico Floating Farms Market, By Building Structure, 2020-2033 (USD Billion)
28. Europe Floating Farms Market, By Livestock, 2020-2033 (USD Billion)
29. Europe Floating Farms Market, By Consumable Product, 2020-2033 (USD Billion)
30. Europe Floating Farms Market, By Building Structure, 2020-2033 (USD Billion)
31. Germany Floating Farms Market, By Livestock, 2020-2033 (USD Billion)
32. Germany Floating Farms Market, By Consumable Product, 2020-2033 (USD Billion)
33. Germany Floating Farms Market, By Building Structure, 2020-2033 (USD Billion)
34. France Floating Farms Market, By Livestock, 2020-2033 (USD Billion)
35. France Floating Farms Market, By Consumable Product, 2020-2033 (USD Billion)
36. France Floating Farms Market, By Building Structure, 2020-2033 (USD Billion)
37. U.K. Floating Farms Market, By Livestock, 2020-2033 (USD Billion)
38. U.K. Floating Farms Market, By Consumable Product, 2020-2033 (USD Billion)
39. U.K. Floating Farms Market, By Building Structure, 2020-2033 (USD Billion)
40. Italy Floating Farms Market, By Livestock, 2020-2033 (USD Billion)
41. Italy Floating Farms Market, By Consumable Product, 2020-2033 (USD Billion)
42. Italy Floating Farms Market, By Building Structure, 2020-2033 (USD Billion)
43. Spain Floating Farms Market, By Livestock, 2020-2033 (USD Billion)
44. Spain Floating Farms Market, By Consumable Product, 2020-2033 (USD Billion)
45. Spain Floating Farms Market, By Building Structure, 2020-2033 (USD Billion)
46. Asia Pacific Floating Farms Market, By Livestock, 2020-2033 (USD Billion)
47. Asia Pacific Floating Farms Market, By Consumable Product, 2020-2033 (USD Billion)
48. Asia Pacific Floating Farms Market, By Building Structure, 2020-2033 (USD Billion)
49. Japan Floating Farms Market, By Livestock, 2020-2033 (USD Billion)
50. Japan Floating Farms Market, By Consumable Product, 2020-2033 (USD Billion)
51. Japan Floating Farms Market, By Building Structure, 2020-2033 (USD Billion)
52. China Floating Farms Market, By Livestock, 2020-2033 (USD Billion)
53. China Floating Farms Market, By Consumable Product, 2020-2033 (USD Billion)
54. China Floating Farms Market, By Building Structure, 2020-2033 (USD Billion)
55. India Floating Farms Market, By Livestock, 2020-2033 (USD Billion)
56. India Floating Farms Market, By Consumable Product, 2020-2033 (USD Billion)
57. India Floating Farms Market, By Building Structure, 2020-2033 (USD Billion)
58. South America Floating Farms Market, By Livestock, 2020-2033 (USD Billion)
59. South America Floating Farms Market, By Consumable Product, 2020-2033 (USD Billion)
60. South America Floating Farms Market, By Building Structure, 2020-2033 (USD Billion)
61. Brazil Floating Farms Market, By Livestock, 2020-2033 (USD Billion)
62. Brazil Floating Farms Market, By Consumable Product, 2020-2033 (USD Billion)
63. Brazil Floating Farms Market, By Building Structure, 2020-2033 (USD Billion)
64. Middle East and Africa Floating Farms Market, By Livestock, 2020-2033 (USD Billion)
65. Middle East and Africa Floating Farms Market, By Consumable Product, 2020-2033 (USD Billion)
66. Middle East and Africa Floating Farms Market, By Building Structure, 2020-2033 (USD Billion)
67. UAE Floating Farms Market, By Livestock, 2020-2033 (USD Billion)
68. UAE Floating Farms Market, By Consumable Product, 2020-2033 (USD Billion)
69. UAE Floating Farms Market, By Building Structure, 2020-2033 (USD Billion)
70. South Africa Floating Farms Market, By Livestock, 2020-2033 (USD Billion)
71. South Africa Floating Farms Market, By Consumable Product, 2020-2033 (USD Billion)
72. South Africa Floating Farms Market, By Building Structure, 2020-2033 (USD Billion)
List of Figures
1. Global Floating Farms Market Segmentation
2. Floating Farms Market: Research Methodology
3. Market Size Estimation Methodology: Bottom-Up Approach
4. Market Size Estimation Methodology: Top-Down Approach
5. Data Triangulation
6. Porter’s Five Forces Analysis
7. Value Chain Analysis
8. Global Floating Farms Market Attractiveness Analysis by Livestock
9. Global Floating Farms Market Attractiveness Analysis by Consumable Product
10. Global Floating Farms Market Attractiveness Analysis by Building Structure
11. Global Floating Farms Market Attractiveness Analysis by Region
12. Global Floating Farms Market: Dynamics
13. Global Floating Farms Market Share by Livestock (2023 & 2033)
14. Global Floating Farms Market Share by Consumable Product (2023 & 2033)
15. Global Floating Farms Market Share by Building Structure (2023 & 2033)
16. Global Floating Farms Market Share by Regions (2023 & 2033)
17. Global Floating Farms Market Share by Company (2023)
This study forecasts revenue at global, regional, and country levels from 2020 to 2033. The Brainy Insights has segmented the global floating farms market based on below-mentioned segments:
Global Floating Farms Market by Livestock:
Global Floating Farms Market by Consumable Product:
Global Floating Farms Market by Building Structure:
Global Floating Farms Market by Region:
Research has its special purpose to undertake marketing efficiently. In this competitive scenario, businesses need information across all industry verticals; the information about customer wants, market demand, competition, industry trends, distribution channels etc. This information needs to be updated regularly because businesses operate in a dynamic environment. Our organization, The Brainy Insights incorporates scientific and systematic research procedures in order to get proper market insights and industry analysis for overall business success. The analysis consists of studying the market from a miniscule level wherein we implement statistical tools which helps us in examining the data with accuracy and precision.
Our research reports feature both; quantitative and qualitative aspects for any market. Qualitative information for any market research process are fundamental because they reveal the customer needs and wants, usage and consumption for any product/service related to a specific industry. This in turn aids the marketers/investors in knowing certain perceptions of the customers. Qualitative research can enlighten about the different product concepts and designs along with unique service offering that in turn, helps define marketing problems and generate opportunities. On the other hand, quantitative research engages with the data collection process through interviews, e-mail interactions, surveys and pilot studies. Quantitative aspects for the market research are useful to validate the hypotheses generated during qualitative research method, explore empirical patterns in the data with the help of statistical tools, and finally make the market estimations.
The Brainy Insights offers comprehensive research and analysis, based on a wide assortment of factual insights gained through interviews with CXOs and global experts and secondary data from reliable sources. Our analysts and industry specialist assume vital roles in building up statistical tools and analysis models, which are used to analyse the data and arrive at accurate insights with exceedingly informative research discoveries. The data provided by our organization have proven precious to a diverse range of companies, facilitating them to address issues such as determining which products/services are the most appealing, whether or not customers use the product in the manner anticipated, the purchasing intentions of the market and many others.
Our research methodology encompasses an idyllic combination of primary and secondary initiatives. Key phases involved in this process are listed below:

The phase involves the gathering and collecting of market data and its related information with the help of different sources & research procedures.

The data procurement stage involves in data gathering and collecting through various data sources.
This stage involves in extensive research. These data sources includes:
Purchased Database: Purchased databases play a crucial role in estimating the market sizes irrespective of the domain. Our purchased database includes:
Primary Research: The Brainy Insights interacts with leading companies and experts of the concerned domain to develop the analyst team’s market understanding and expertise. It improves and substantiates every single data presented in the market reports. Primary research mainly involves in telephonic interviews, E-mail interactions and face-to-face interviews with the raw material providers, manufacturers/producers, distributors, & independent consultants. The interviews that we conduct provides valuable data on market size and industry growth trends prevailing in the market. Our organization also conducts surveys with the various industry experts in order to gain overall insights of the industry/market. For instance, in healthcare industry we conduct surveys with the pharmacists, doctors, surgeons and nurses in order to gain insights and key information of a medical product/device/equipment which the customers are going to usage. Surveys are conducted in the form of questionnaire designed by our own analyst team. Surveys plays an important role in primary research because surveys helps us to identify the key target audiences of the market. Additionally, surveys helps to identify the key target audience engaged with the market. Our survey team conducts the survey by targeting the key audience, thus gaining insights from them. Based on the perspectives of the customers, this information is utilized to formulate market strategies. Moreover, market surveys helps us to understand the current competitive situation of the industry. To be precise, our survey process typically involve with the 360 analysis of the market. This analytical process begins by identifying the prospective customers for a product or service related to the market/industry to obtain data on how a product/service could fit into customers’ lives.

Secondary Research: The secondary data sources includes information published by the on-profit organizations such as World bank, WHO, company fillings, investor presentations, annual reports, national government documents, statistical databases, blogs, articles, white papers and others. From the annual report, we analyse a company’s revenue to understand the key segment and market share of that organization in a particular region. We analyse the company websites and adopt the product mapping technique which is important for deriving the segment revenue. In the product mapping method, we select and categorize the products offered by the companies catering to domain specific market, deduce the product revenue for each of the companies so as to get overall estimation of the market size. We also source data and analyses trends based on information received from supply side and demand side intermediaries in the value chain. The supply side denotes the data gathered from supplier, distributor, wholesaler and the demand side illustrates the data gathered from the end customers for respective market domain.

The supply side for a domain specific market is analysed by:
The demand side for the market is estimated through:
In-house Library: Apart from these third-party sources, we have our in-house library of qualitative and quantitative information. Our in-house database includes market data for various industry and domains. These data are updated on regular basis as per the changing market scenario. Our library includes, historic databases, internal audit reports and archives.
Sometimes there are instances where there is no metadata or raw data available for any domain specific market. For those cases, we use our expertise to forecast and estimate the market size in order to generate comprehensive data sets. Our analyst team adopt a robust research technique in order to produce the estimates:
Data Synthesis: This stage involves the analysis & mapping of all the information obtained from the previous step. It also involves in scrutinizing the data for any discrepancy observed while data gathering related to the market. The data is collected with consideration to the heterogeneity of sources. Robust scientific techniques are in place for synthesizing disparate data sets and provide the essential contextual information that can orient market strategies. The Brainy Insights has extensive experience in data synthesis where the data passes through various stages:


Market Deduction & Formulation: The final stage comprises of assigning data points at appropriate market spaces so as to deduce feasible conclusions. Analyst perspective & subject matter expert based holistic form of market sizing coupled with industry analysis also plays a crucial role in this stage.
This stage involves in finalization of the market size and numbers that we have collected from data integration step. With data interpolation, it is made sure that there is no gap in the market data. Successful trend analysis is done by our analysts using extrapolation techniques, which provide the best possible forecasts for the market.
Data Validation & Market Feedback: Validation is the most important step in the process. Validation & re-validation via an intricately designed process helps us finalize data-points to be used for final calculations.

The Brainy Insights interacts with leading companies and experts of the concerned domain to develop the analyst team’s market understanding and expertise. It improves and substantiates every single data presented in the market reports. The data validation interview and discussion panels are typically composed of the most experienced industry members. The participants include, however, are not limited to:
Moreover, we always validate our data and findings through primary respondents from all the major regions we are working on.


Free Customization
Fortune 500 Clients
Free Yearly Update On Purchase Of Multi/Corporate License
Companies Served Till Date