- +1-315-215-1633
- sales@thebrainyinsights.com

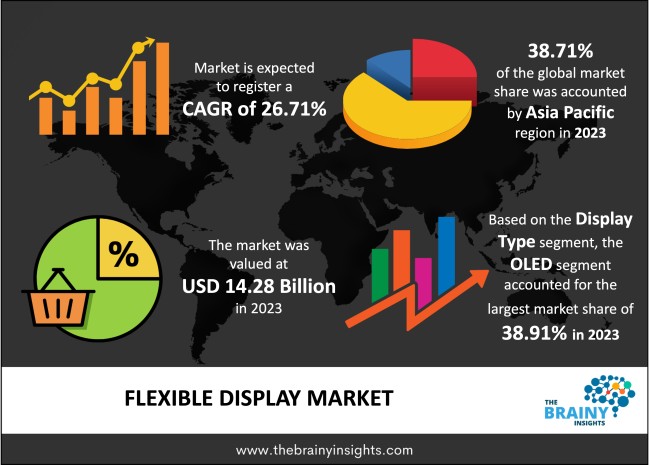
The global flexible display market was valued at USD 14.28 Billion in 2023 and grew at a CAGR of 26.71% from 2024 to 2033. The market is expected to reach USD 152.34 Billion by 2033. The growth of the flexible display market can be attributed to the rising investment in smartphone technology and the increasing usage of televisions, laptops, PCs, and tablets.
A flexible display is An electronic gadget with a rollable or foldable screen. Traditional flat panels are stiff; flexible display screens are not. Light-emitting diode technology allows the screens to be rolled up or folded up. The organic layers between the flexible display can emit light energy because of the electric impulses transferred from the cathode to the anode. In the present world, flexible displays are becoming increasingly popular due to their lighter, thinner, flexible, and durable qualities. Manufacturers can create electronics in various sizes and designs because of the flexible display. Since flexible display electronics use less energy, they are preferred among those who care about the environment. The development and enhancement of flexible display technology have made it possible to produce more wearable gadgets.
Get an overview of this study by requesting a free sample
Increasing application of flexible display: The main application is manufacturing cell phones. However, market participants are looking into its application in various electronic products, including smart glasses, watches, tablets, laptops, and television displays, to name a few, due to its lightweight, flexible and thin design and durable nature. Flexible display technology in the wearable devices segment will present numerous chances for market players to capitalize on the increasing demand for wearable smart devices to track an individual's health. Due to technological developments, businesses can now investigate new applications for flexible screens. Due to the flexible display technology's foldable and rollable nature, they have expanded their product portfolio by inventing new devices with a range of sizes and shapes. Expanding the product line will offer the worldwide flexible display market profitable prospects.
High cost: The main technology in flexible screens is light-emitting diode technology. For producers, the technology is an expensive venture because it is still in its early phases of application in the flexible display market. Additionally, organic substrate materials that are vulnerable to moisture, oxygen, and high temperatures are used in flexible displays. Due to these vulnerabilities, electrical products had a shorter lifespan and needed to be replaced more frequently, raising the product's cost. As a result, the growing flexible display market will be limited by its high cost.
Increasing investment in the development of smartphone display technologies: The competition has intensified in recent years due to the highly fragmented smartphone market, which has several medium, small and larger firms. Due to the entry of new competitors with better smartphones and more sophisticated features, each player's market share is decreasing. Due to the faster rate of innovation, the product life cycle for smartphones is also getting shorter, enabling market participants to release improved models of smartphones in a matter of months. The players in the smartphone market are spending resources on research and development of new technologies that can enhance their goods to hold onto and grow their current customer base. With inflexible flat screen technology, it took more work for market players to make as many electronic products as they could now due to the deployment of flexible displays. The worldwide market will be driven by flexible screens' increasing appeal in the smartphone industry.
The regions analyzed for the market include North America, Europe, South America, Asia Pacific, the Middle East, and Africa. Asia-Pacific emerged as the most significant flexible display market, with a 38.71% market revenue share in 2023.
Asia-Pacific region will account for the largest market share with revenue growth. The rising demand for flexible displays in applications such as smartphones, televisions, laptops, smartwatches, etc. promotes market revenue. The presence of medium-scale and large-scale players is the primary factor contributing to the market growth in the region. Furthermore, the rising deployment of flexible displays in hybrid and electric vehicles will provide lucrative opportunities to the market.
Asia-Pacific region Flexible display Market Share in 2023 - 38.71%
www.thebrainyinsights.com
Check the geographical analysis of this market by requesting a free sample
The display type segment is divided into LED, LCD, OLED, EPD and others. The OLED segment dominated the market, with a share of around 38.91% in 2023. The foundation of a flexible OLED is a flexible substrate, often polyimide. Numerous high-end smartphones have embraced these first-generation flexible OLEDs. Users can bend second-generation flexible OLED panels, which can be utilized to make foldable smartphones.
The substrate material segment is divided into plastic, glass, and others. The plastic segment dominated the market, with a share of around 46.20% in 2023. Glass is more costly than plastic, so manufacturers are moving towards plastic. Compared to glass, plastic is more flexible and durable. Additionally, it is lightweight, which enables producers to create superior goods. Finally, unlike glass-based displays, flexible displays are made on plastic substrates, which make them shatterproof.
The product type segment is divided into bendable and foldable, curved, and rollable. The curved segment dominated the market, with a share of around 42.49% in 2023. Curved displays have recently emerged as a new display style for many commercialized visual display technologies. Any concave or convex curvature can be formed in curved metal cabinets, and any bespoke pattern can be created by magnetically attaching flexible LED modules to the cabinets.
The end-user segment is divided into smart wearables, smartphones and tablets, digital signage systems & television, PCs & laptops, automotive, e-readers, smart home appliances and others. The smartphone and tablet segment dominated the market, with a share of around 31.25% in 2023. The growing number of market players selling smartphones at competitive costs, along with customers' growing disposable income, will play a major role in driving the expansion of the smartphone segment. As more people have access to the internet, smartphone use has also increased. This is because consumers are eager to use these devices' sophisticated capabilities and seamless data connectivity.
Report Description:
| Attribute | Description |
|---|---|
| Market Size | Revenue (USD Billion) |
| Market size value in 2023 | USD 14.28 Billion |
| Market size value in 2033 | USD 152.34 Billion |
| CAGR (2024 to 2033) | 26.71% |
| Historical data | 2020-2022 |
| Base Year | 2023 |
| Forecast | 2024-2033 |
| Region | The regions analyzed for the market are Asia Pacific, Europe, South America, North America, and Middle East & Africa. Furthermore, the regions are further analyzed at the country level. |
| Segments | Display Type, Substrate Material, Product Type, and End-use |
As per The Brainy Insights, the size of the flexible display market was valued at USD 14.28 Billion in 2023 to USD 152.34 Billion by 2033.
Global flexible display market is growing at a CAGR of 26.71% during the forecast period 2024-2033.
Asia-Pacific region emerged as the largest market for the flexible display.
The market's growth will be influenced by the rising installation of flexible display.
The high cost can hamper the market growth.
The increasing investment in technological advancement is providing huge opportunities to the market.
1. Introduction
1.1. Objectives of the Study
1.2. Market Definition
1.3. Research Scope
1.4. Currency
1.5. Key Target Audience
2. Research Methodology and Assumptions
3. Executive Summary
4. Premium Insights
4.1. Porter’s Five Forces Analysis
4.2. Value Chain Analysis
4.3. Top Investment Pockets
4.3.1. Market Attractiveness Analysis By Display Type
4.3.2. Market Attractiveness Analysis By Substrate Material
4.3.3. Market Attractiveness Analysis By Product Type
4.3.4. Market Attractiveness Analysis By End-use
4.3.5. Market Attractiveness Analysis By Region
4.4. Industry Trends
5. Market Dynamics
5.1. Market Evaluation
5.2. Drivers
5.2.1. Increasing demand for flexible display
5.3. Restraints
5.3.1. High cost
5.4. Opportunities
5.4.1. Rising investment in technological advancement
5.5. Challenges
5.5.1. Incompatibility
6. Global Flexible Display Market Analysis and Forecast, By Display Type
6.1. Segment Overview
6.2. LED
6.3. LCD
6.4. OLED
6.5. EPD
6.6. Others
7. Global Flexible Display Market Analysis and Forecast, By Substrate Material
7.1. Segment Overview
7.2. Plastic
7.3. Glass
7.4. Others
8. Global Flexible Display Market Analysis and Forecast, By Product Type
8.1. Segment Overview
8.2. Bendable & Foldable
8.3. Curved
8.4. Rollable
9. Global Flexible Display Market Analysis and Forecast, By End-use
9.1. Segment Overview
9.2. Smart Wearable
9.3. Smartphone and Tablets
9.4. Digital Signage System & Television
9.5. PCs & Laptops
9.6. Automotive
9.7. E-reader
9.8. Smart Home Appliances
9.9. Others
10. Global Flexible Display Market Analysis and Forecast, By Regional Analysis
10.1. Segment Overview
10.2. North America
10.2.1. U.S.
10.2.2. Canada
10.2.3. Mexico
10.3. Europe
10.3.1. Germany
10.3.2. France
10.3.3. U.K.
10.3.4. Italy
10.3.5. Spain
10.4. Asia-Pacific
10.4.1. Japan
10.4.2. China
10.4.3. India
10.5. South America
10.5.1. Brazil
10.6. Middle East and Africa
10.6.1. UAE
10.6.2. South Africa
11. Global Flexible Display Market-Competitive Landscape
11.1. Overview
11.2. Market Share of Key Players in the Flexible Display Market
11.2.1. Global Company Market Share
11.2.2. North America Company Market Share
11.2.3. Europe Company Market Share
11.2.4. APAC Company Market Share
11.3. Competitive Situations and Trends
11.3.1. Product Launches and Developments
11.3.2. Partnerships, Collaborations, and Agreements
11.3.3. Mergers & Acquisitions
11.3.4. Expansions
12. Company Profiles
12.1. Rockwell Automation Inc.
12.1.1. Business Overview
12.1.2. Company Snapshot
12.1.3. Company Market Share Analysis
12.1.4. Company Product Portfolio
12.1.5. Recent Developments
12.1.6. SWOT Analysis
12.2. Siemens AG
12.2.1. Business Overview
12.2.2. Company Snapshot
12.2.3. Company Market Share Analysis
12.2.4. Company Product Portfolio
12.2.5. Recent Developments
12.2.6. SWOT Analysis
12.3. BAE Systems
12.3.1. Business Overview
12.3.2. Company Snapshot
12.3.3. Company Market Share Analysis
12.3.4. Company Product Portfolio
12.3.5. Recent Developments
12.3.6. SWOT Analysis
12.4. Honeywell International Inc.
12.4.1. Business Overview
12.4.2. Company Snapshot
12.4.3. Company Market Share Analysis
12.4.4. Company Product Portfolio
12.4.5. Recent Developments
12.4.6. SWOT Analysis
12.5. Huawei Technologies Co. Ltd.
12.5.1. Business Overview
12.5.2. Company Snapshot
12.5.3. Company Market Share Analysis
12.5.4. Company Product Portfolio
12.5.5. Recent Developments
12.5.6. SWOT Analysis
12.6. TransCanada PipeLines Limited
12.6.1. Business Overview
12.6.2. Company Snapshot
12.6.3. Company Market Share Analysis
12.6.4. Company Product Portfolio
12.6.5. Recent Developments
12.6.6. SWOT Analysis
12.7. QinetiQ Group Plc
12.7.1. Business Overview
12.7.2. Company Snapshot
12.7.3. Company Market Share Analysis
12.7.4. Company Product Portfolio
12.7.5. Recent Developments
12.7.6. SWOT Analysis
12.8. ABB Ltd.
1.1.1. Business Overview
1.1.2. Company Snapshot
1.1.3. Company Market Share Analysis
1.1.4. Company Product Portfolio
1.1.5. Recent Developments
1.1.6. SWOT Analysis
12.9. Emerson Electric Co.
12.9.1. Business Overview
12.9.2. Company Snapshot
12.9.3. Company Market Share Analysis
12.9.4. Company Product Portfolio
12.9.5. Recent Developments
12.9.6. SWOT Analysis
12.10. Huawei Investment and Holding Co. Ltd.
12.10.1. Business Overview
12.10.2. Company Snapshot
12.10.3. Company Market Share Analysis
12.10.4. Company Product Portfolio
12.10.5. Recent Developments
12.10.6. SWOT Analysis
12.11. Generic Electric Co.
12.11.1. Business Overview
12.11.2. Company Snapshot
12.11.3. Company Market Share Analysis
12.11.4. Company Product Portfolio
12.11.5. Recent Developments
12.11.6. SWOT Analysis
12.12. ORBCOMM Inc.
12.12.1. Business Overview
12.12.2. Company Snapshot
12.12.3. Company Market Share Analysis
12.12.4. Company Product Portfolio
12.12.5. Recent Developments
12.12.6. SWOT Analysis
12.13. Schneider Electric SE
12.13.1. Business Overview
12.13.2. Company Snapshot
12.13.3. Company Market Share Analysis
12.13.4. Company Product Portfolio
12.13.5. Recent Developments
12.13.6. SWOT Analysis
List of Table
1. Global Flexible Display Market, By Display Type, 2020-2033 (USD Billion)
2. Global LED, Flexible Display Market, By Region, 2020-2033 (USD Billion)
3. Global LCD, Flexible Display Market, By Region, 2020-2033 (USD Billion)
4. Global OLED, Flexible Display Market, By Region, 2020-2033 (USD Billion)
5. Global EPD, Flexible Display Market, By Region, 2020-2033 (USD Billion)
6. Global Others, Flexible Display Market, By Region, 2020-2033 (USD Billion)
7. Global Flexible Display Market, By Substrate Material, 2020-2033 (USD Billion)
8. Global Plastic, Flexible Display Market, By Region, 2020-2033 (USD Billion)
9. Global Glass, Flexible Display Market, By Region, 2020-2033 (USD Billion)
10. Global Others, Flexible Display Market, By Region, 2020-2033 (USD Billion)
11. Global Flexible Display Market, By Product Type, 2020-2033 (USD Billion)
12. Global Bendable & Foldable, Flexible Display Market, By Region, 2020-2033 (USD Billion)
13. Global Curved, Flexible Display Market, By Region, 2020-2033 (USD Billion)
14. Global Rollable, Flexible Display Market, By Region, 2020-2033 (USD Billion)
15. Global Flexible Display Market, By End-use, 2020-2033 (USD Billion)
16. Global Smart Wearable, Flexible Display Market, By Region, 2020-2033 (USD Billion)
17. Global Smartphone and Tablets, Flexible Display Market, By Region, 2020-2033 (USD Billion)
18. Global Digital Signage System & Television, Flexible Display Market, By Region, 2020-2033 (USD Billion)g
19. Global PCs & Laptops, Flexible Display Market, By Region, 2020-2033 (USD Billion)
20. Global Automotive, Flexible Display Market, By Region, 2020-2033 (USD Billion)
21. Global E-reader, Flexible Display Market, By Region, 2020-2033 (USD Billion)
22. Global Smart Home Appliances, Flexible Display Market, By Region, 2020-2033 (USD Billion)
23. Global Others, Flexible Display Market, By Region, 2020-2033 (USD Billion)
24. Global Flexible Display Market, By Region, 2020-2033 (USD Billion)
25. North America Flexible Display Market, By Display Type, 2020-2033 (USD Billion)
26. North America Flexible Display Market, By Substrate Material, 2020-2033 (USD Billion)
27. North America Flexible Display Market, By Product Type, 2020-2033 (USD Billion)
28. North America Flexible Display Market, By End-use, 2020-2033 (USD Billion)
29. U.S. Flexible Display Market, By Display Type, 2020-2033 (USD Billion)
30. U.S. Flexible Display Market, By Substrate Material, 2020-2033 (USD Billion)
31. U.S. Flexible Display Market, By Product Type, 2020-2033 (USD Billion)
32. U.S. Flexible Display Market, By End-use, 2020-2033 (USD Billion)
33. Canada Flexible Display Market, By Display Type, 2020-2033 (USD Billion)
34. Canada Flexible Display Market, By Substrate Material, 2020-2033 (USD Billion)
35. Canada Flexible Display Market, By Product Type, 2020-2033 (USD Billion)
36. Canada Flexible Display Market, By End-use, 2020-2033 (USD Billion)
37. Mexico Flexible Display Market, By Display Type, 2020-2033 (USD Billion)
38. Mexico Flexible Display Market, By Substrate Material, 2020-2033 (USD Billion)
39. Mexico Flexible Display Market, By Product Type, 2020-2033 (USD Billion)
40. Mexico Flexible Display Market, By End-use, 2020-2033 (USD Billion)
41. Europe Flexible Display Market, By Display Type, 2020-2033 (USD Billion)
42. Europe Flexible Display Market, By Substrate Material, 2020-2033 (USD Billion)
43. Europe Flexible Display Market, By Product Type, 2020-2033 (USD Billion)
44. Europe Flexible Display Market, By End-use, 2020-2033 (USD Billion)
45. Germany Flexible Display Market, By Display Type, 2020-2033 (USD Billion)
46. Germany Flexible Display Market, By Substrate Material, 2020-2033 (USD Billion)
47. Germany Flexible Display Market, By Product Type, 2020-2033 (USD Billion)
48. Germany Flexible Display Market, By End-use, 2020-2033 (USD Billion)
49. France Flexible Display Market, By Display Type, 2020-2033 (USD Billion)
50. France Flexible Display Market, By Substrate Material, 2020-2033 (USD Billion)
51. France Flexible Display Market, By Product Type, 2020-2033 (USD Billion)
52. France Flexible Display Market, By End-use, 2020-2033 (USD Billion)
53. U.K. Flexible Display Market, By Display Type, 2020-2033 (USD Billion)
54. U.K. Flexible Display Market, By Substrate Material, 2020-2033 (USD Billion)
55. U.K. Flexible Display Market, By Product Type, 2020-2033 (USD Billion)
56. U.K. Flexible Display Market, By End-use, 2020-2033 (USD Billion)
57. Italy Flexible Display Market, By Display Type, 2020-2033 (USD Billion)
58. Italy Flexible Display Market, By Substrate Material, 2020-2033 (USD Billion)
59. Italy Flexible Display Market, By Product Type, 2020-2033 (USD Billion)
60. Italy Flexible Display Market, By End-use, 2020-2033 (USD Billion)
61. Spain Flexible Display Market, By Display Type, 2020-2033 (USD Billion)
62. Spain Flexible Display Market, By Substrate Material, 2020-2033 (USD Billion)
63. Spain Flexible Display Market, By Product Type, 2020-2033 (USD Billion)
64. Spain Flexible Display Market, By End-use, 2020-2033 (USD Billion)
65. Asia Pacific Flexible Display Market, By Display Type, 2020-2033 (USD Billion)
66. Asia Pacific Flexible Display Market, By Substrate Material, 2020-2033 (USD Billion)
67. Asia Pacific Flexible Display Market, By Product Type, 2020-2033 (USD Billion)
68. Asia Pacific Flexible Display Market, By End-use, 2020-2033 (USD Billion)
69. Japan Flexible Display Market, By Display Type, 2020-2033 (USD Billion)
70. Japan Flexible Display Market, By Substrate Material, 2020-2033 (USD Billion)
71. Japan Flexible Display Market, By Product Type, 2020-2033 (USD Billion)
72. Japan Flexible Display Market, By End-use, 2020-2033 (USD Billion)
73. China Flexible Display Market, By Display Type, 2020-2033 (USD Billion)
74. China Flexible Display Market, By Substrate Material, 2020-2033 (USD Billion)
75. China Flexible Display Market, By Product Type, 2020-2033 (USD Billion)
76. China Flexible Display Market, By End-use, 2020-2033 (USD Billion)
77. India Flexible Display Market, By Display Type, 2020-2033 (USD Billion)
78. India Flexible Display Market, By Substrate Material, 2020-2033 (USD Billion)
79. India Flexible Display Market, By Product Type, 2020-2033 (USD Billion)
80. India Flexible Display Market, By End-use, 2020-2033 (USD Billion)
81. South America Flexible Display Market, By Display Type, 2020-2033 (USD Billion)
82. South America Flexible Display Market, By Substrate Material, 2020-2033 (USD Billion)
83. South America Flexible Display Market, By Product Type, 2020-2033 (USD Billion)
84. South America Flexible Display Market, By End-use, 2020-2033 (USD Billion)
85. Brazil Flexible Display Market, By Display Type, 2020-2033 (USD Billion)
86. Brazil Flexible Display Market, By Substrate Material, 2020-2033 (USD Billion)
87. Brazil Flexible Display Market, By Product Type, 2020-2033 (USD Billion)
88. Brazil Flexible Display Market, By End-use, 2020-2033 (USD Billion)
89. Middle East and Africa Flexible Display Market, By Display Type, 2020-2033 (USD Billion)
90. Middle East and Africa Flexible Display Market, By Substrate Material, 2020-2033 (USD Billion)
91. Middle East and Africa Flexible Display Market, By Product Type, 2020-2033 (USD Billion)
92. Middle East and Africa Flexible Display Market, By End-use, 2020-2033 (USD Billion)
93. UAE Flexible Display Market, By Display Type, 2020-2033 (USD Billion)
94. UAE Flexible Display Market, By Substrate Material, 2020-2033 (USD Billion)
95. UAE Flexible Display Market, By Product Type, 2020-2033 (USD Billion)
96. UAE Flexible Display Market, By End-use, 2020-2033 (USD Billion)
97. South Africa Flexible Display Market, By Display Type, 2020-2033 (USD Billion)
98. South Africa Flexible Display Market, By Substrate Material, 2020-2033 (USD Billion)
99. South Africa Flexible Display Market, By Product Type, 2020-2033 (USD Billion)
100. South Africa Flexible Display Market, By End-use, 2020-2033 (USD Billion)
List of Figures
1. Global Flexible Display Market Segmentation
2. Flexible Display Market: Research Methodology
3. Market Size Estimation Methodology: Bottom-Up Approach
4. Market Size Estimation Methodology: Top-Down Approach
5. Data Triangulation
6. Porter’s Five Forces Analysis
7. Value Chain Analysis
8. Global Flexible Display Market Attractiveness Analysis By Display Type
9. Global Flexible Display Market Attractiveness Analysis By Substrate Material
10. Global Flexible Display Market Attractiveness Analysis By Product Type
11. Global Flexible Display Market Attractiveness Analysis By End-use
12. Global Flexible Display Market Attractiveness Analysis By Region
13. Global Flexible Display Market: Dynamics
14. Global Flexible Display Market Share by Display Type (2023 & 2032)
15. Global Flexible Display Market Share by Substrate Material (2023 & 2032)
16. Global Flexible Display Market Share by Product Type (2023 & 2032)
17. Global Flexible Display Market Share by End-use (2023 & 2032)
18. Global Flexible Display Market Share by Regions (2023 & 2032)
19. Global Flexible Display Market Share by Company (2023)
This study forecasts revenue at global, regional, and country levels from 2020 to 2033. The Brainy Insights has segmented the global flexible display market based on below mentioned segments:
Global Flexible Display Market by Display Type:
Global Flexible Display Market by Substrate Material:
Global Flexible Display Market by Product Type:
Global Flexible Display Market by End-use:
Global Flexible Display Market by Region:
Research has its special purpose to undertake marketing efficiently. In this competitive scenario, businesses need information across all industry verticals; the information about customer wants, market demand, competition, industry trends, distribution channels etc. This information needs to be updated regularly because businesses operate in a dynamic environment. Our organization, The Brainy Insights incorporates scientific and systematic research procedures in order to get proper market insights and industry analysis for overall business success. The analysis consists of studying the market from a miniscule level wherein we implement statistical tools which helps us in examining the data with accuracy and precision.
Our research reports feature both; quantitative and qualitative aspects for any market. Qualitative information for any market research process are fundamental because they reveal the customer needs and wants, usage and consumption for any product/service related to a specific industry. This in turn aids the marketers/investors in knowing certain perceptions of the customers. Qualitative research can enlighten about the different product concepts and designs along with unique service offering that in turn, helps define marketing problems and generate opportunities. On the other hand, quantitative research engages with the data collection process through interviews, e-mail interactions, surveys and pilot studies. Quantitative aspects for the market research are useful to validate the hypotheses generated during qualitative research method, explore empirical patterns in the data with the help of statistical tools, and finally make the market estimations.
The Brainy Insights offers comprehensive research and analysis, based on a wide assortment of factual insights gained through interviews with CXOs and global experts and secondary data from reliable sources. Our analysts and industry specialist assume vital roles in building up statistical tools and analysis models, which are used to analyse the data and arrive at accurate insights with exceedingly informative research discoveries. The data provided by our organization have proven precious to a diverse range of companies, facilitating them to address issues such as determining which products/services are the most appealing, whether or not customers use the product in the manner anticipated, the purchasing intentions of the market and many others.
Our research methodology encompasses an idyllic combination of primary and secondary initiatives. Key phases involved in this process are listed below:

The phase involves the gathering and collecting of market data and its related information with the help of different sources & research procedures.

The data procurement stage involves in data gathering and collecting through various data sources.
This stage involves in extensive research. These data sources includes:
Purchased Database: Purchased databases play a crucial role in estimating the market sizes irrespective of the domain. Our purchased database includes:
Primary Research: The Brainy Insights interacts with leading companies and experts of the concerned domain to develop the analyst team’s market understanding and expertise. It improves and substantiates every single data presented in the market reports. Primary research mainly involves in telephonic interviews, E-mail interactions and face-to-face interviews with the raw material providers, manufacturers/producers, distributors, & independent consultants. The interviews that we conduct provides valuable data on market size and industry growth trends prevailing in the market. Our organization also conducts surveys with the various industry experts in order to gain overall insights of the industry/market. For instance, in healthcare industry we conduct surveys with the pharmacists, doctors, surgeons and nurses in order to gain insights and key information of a medical product/device/equipment which the customers are going to usage. Surveys are conducted in the form of questionnaire designed by our own analyst team. Surveys plays an important role in primary research because surveys helps us to identify the key target audiences of the market. Additionally, surveys helps to identify the key target audience engaged with the market. Our survey team conducts the survey by targeting the key audience, thus gaining insights from them. Based on the perspectives of the customers, this information is utilized to formulate market strategies. Moreover, market surveys helps us to understand the current competitive situation of the industry. To be precise, our survey process typically involve with the 360 analysis of the market. This analytical process begins by identifying the prospective customers for a product or service related to the market/industry to obtain data on how a product/service could fit into customers’ lives.

Secondary Research: The secondary data sources includes information published by the on-profit organizations such as World bank, WHO, company fillings, investor presentations, annual reports, national government documents, statistical databases, blogs, articles, white papers and others. From the annual report, we analyse a company’s revenue to understand the key segment and market share of that organization in a particular region. We analyse the company websites and adopt the product mapping technique which is important for deriving the segment revenue. In the product mapping method, we select and categorize the products offered by the companies catering to domain specific market, deduce the product revenue for each of the companies so as to get overall estimation of the market size. We also source data and analyses trends based on information received from supply side and demand side intermediaries in the value chain. The supply side denotes the data gathered from supplier, distributor, wholesaler and the demand side illustrates the data gathered from the end customers for respective market domain.

The supply side for a domain specific market is analysed by:
The demand side for the market is estimated through:
In-house Library: Apart from these third-party sources, we have our in-house library of qualitative and quantitative information. Our in-house database includes market data for various industry and domains. These data are updated on regular basis as per the changing market scenario. Our library includes, historic databases, internal audit reports and archives.
Sometimes there are instances where there is no metadata or raw data available for any domain specific market. For those cases, we use our expertise to forecast and estimate the market size in order to generate comprehensive data sets. Our analyst team adopt a robust research technique in order to produce the estimates:
Data Synthesis: This stage involves the analysis & mapping of all the information obtained from the previous step. It also involves in scrutinizing the data for any discrepancy observed while data gathering related to the market. The data is collected with consideration to the heterogeneity of sources. Robust scientific techniques are in place for synthesizing disparate data sets and provide the essential contextual information that can orient market strategies. The Brainy Insights has extensive experience in data synthesis where the data passes through various stages:


Market Deduction & Formulation: The final stage comprises of assigning data points at appropriate market spaces so as to deduce feasible conclusions. Analyst perspective & subject matter expert based holistic form of market sizing coupled with industry analysis also plays a crucial role in this stage.
This stage involves in finalization of the market size and numbers that we have collected from data integration step. With data interpolation, it is made sure that there is no gap in the market data. Successful trend analysis is done by our analysts using extrapolation techniques, which provide the best possible forecasts for the market.
Data Validation & Market Feedback: Validation is the most important step in the process. Validation & re-validation via an intricately designed process helps us finalize data-points to be used for final calculations.

The Brainy Insights interacts with leading companies and experts of the concerned domain to develop the analyst team’s market understanding and expertise. It improves and substantiates every single data presented in the market reports. The data validation interview and discussion panels are typically composed of the most experienced industry members. The participants include, however, are not limited to:
Moreover, we always validate our data and findings through primary respondents from all the major regions we are working on.


Free Customization
Fortune 500 Clients
Free Yearly Update On Purchase Of Multi/Corporate License
Companies Served Till Date