- +1-315-215-1633
- sales@thebrainyinsights.com

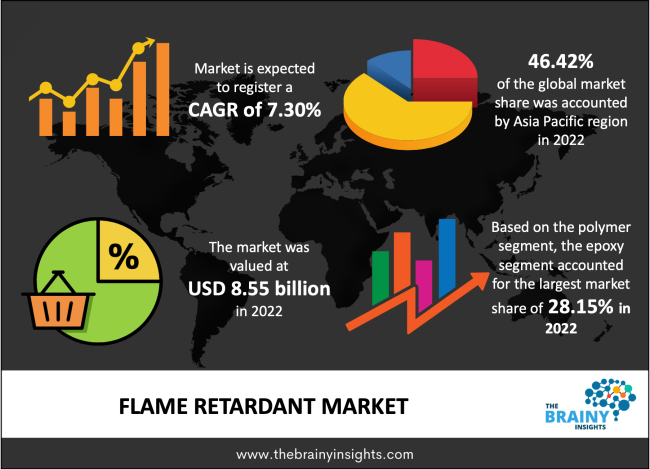
The global flame-retardant market was valued at USD 8.55 billion in 2022, increasing at a CAGR of 7.30% from 2022 to 2030 and anticipated to reach USD 15.03 billion by 2030. North America is expected to grow the fastest during the forecast period. Further, the growing utilization of fire retardants across different industries like construction, automotive, electronics, textile, and aviation are the driving factor of the market growth during the forecast period. Also, the various fire safety regulations & safety measures are helping boost the market growth during the forecast period.
Flame retardants are compounds utilized in plastic and cloth material to increase the ignition point of the material, thus making it resistant to fire. Flame retardants subsume mixed chemicals added to manufactured materials like textiles, plastics, surface finishes, and coatings. Flame retardants are generally grouped based on whether they include phosphorus, bromine, chlorine, nitrogen, metals, or boron. Polybrominated diphenyl ethers (PBDEs) do not chemically bind with the products that are added (electronics, furniture, etc.), so they easily release from these products & enter dust and air. Tetrabromobisphenol A (TBBPA) is widely utilized to make computer circuit boards & electronics. TBBPA is also used as a flame retardant in paper, plastics, and textiles and as a plasticizer in coatings and adhesives. Hexabromocyclododecane (HBCD) is an additive used primarily in polystyrene foam building materials. The preliminary risk to humans is leaching out of products & getting into indoor dust. Low levels of hexabromocyclododecane have also been found in some food products. Inorganic flame retardants are good thermal stability, non-volatile, decomposition does not produce corrosive gases, and low prices, polyurethane materials utilized in the more common flame-retardant additives, including phosphorus, metal hydroxides, silicon, nitrogen, boron and other flame retardants. Flame retardant PU metal hydroxide is used in the primary flame retardant aluminium hydroxide (ATH) and magnesium hydroxide (MH), using their complex with good synergy. The disadvantages of inorganic flame retardants are also more prominent, like the addition of extensive, poor compatibility with the matrix material, which often improves the flame-retardant performance while reducing the other properties of the material.
Get an overview of this study by requesting a free sample
The high sale of electronic appliances: The increasing demand for flame retardation chemicals in various finish-user industries is propelling market growth. Further, the increase in construction, automotive, and electronics industries & improved government regulations and safety standards for smoke & flammability across the globe are also helping to propel the market growth during the forecast period. Moreover, the increasing stringency of fire safety regulations in different countries, increased security measures & the new regulatory guidelines for reducing toxic chemicals are propelling the market growth. Additionally, the increasing popularity of electronic devices, transportation, textile, building & construction, as well as consumer goods, are helping to boost the market growth is also helping to boost the market growth during the forecast period.
A higher price of flame-retardant products: The health risks associated with flame retardants, like endocrine disruption, reproductive toxicity, cancer, etc., hinder the market growth. Further, the increasing prices of flame-retardant products & toxicity issues at the time of the flame retardant production process are also helping to hinder the market growth during the forecast period. The presence of substitute products for each application of non-halogenated flame retardants is also hampering the market growth.
The ongoing research and development activities: The increasing disposable income of customers, the introduction of more efficient synergist compounds, and the emerging economies are the opportunity factor for market growth. Also, providing awareness of environment-friendly flame retardants and fire safety norms among customers is an opportunity factor for market growth. Further, the technological advancement in automotive & consumer electronics and use in residential areas propel market growth. Additionally, the high utilization of the products in multiple applications, including building & construction, household appliances, household & several other appliances, are driving factors of the market growth. Apart from this, rising security measures & the new regulatory guidelines for reducing toxic chemicals are helping to propel the during the forecast period.
The regions analyzed for the market include Europe, South America, Asia Pacific, North America, the Middle East, and Africa. The Asia Pacific emerged as the largest market for the global flame-retardant market, with a 46.42% share of the market revenue in 2022. The Asia Pacific dominates the flame retardant market due to the growing demand for electronics and automotive applications. Further, the presence of major manufacturers in the automotive industry and regulations by countries that emphasize the use of fire in automotive elements are also propelling the market growth in this region. Also, the rate of product consumption and production and prominent manufacturers' presence is helping to drive market growth in this region. North America is expected to grow the fastest during the forecast period due to the increasing population, growing safety concerns among the authorities, and increasing disposable income. Further, rising demands from the urban, rural, and coastal people are also helping to boost the market growth in this region during the forthcoming year. Additionally, the raised construction activity worldwide and growth in the chemicals & automobile industries are also helping to drive market growth in this region.
Asia-Pacific Region Flame Retardant Market Share in 2022 - 46.42%
www.thebrainyinsights.com
Check the geographical analysis of this market by requesting a free sample
The polymer segment is divided into polyolefin, polyamide, epoxy, polyesters, polyurethanes, vinyl ester, and others. The epoxy segment dominated, with a market share of around 28.15% in 2022. This growth is attributed to the wide use of epoxy in the construction, marine, aerospace, and automotive sectors. Further, by 2030, the polyolefin segment will likely dominate the market due to high thermal & chemical resistance and insulating properties. Moreover, the polyolefin is a generally used polymer due to its characteristics like ease of processing & better mechanical properties. Also, polyolefin finds its primary application in wires and cables that are used in different industries like transport, electrical, and construction. Other polyolefin products that use flame retardant additives are PE, LDPE, PP, LDPE, EVA, and MDPE.
The type segment is divided into aluminium trihydroxide organophosphorus compounds, halogenated, non-halogenated, brominated & chlorinated, antimony oxides, and others. In 2022, the brominated & chlorinated segment dominated the market with the largest market share of 25.19% and market revenue of 2.15 billion. This growth is attributed to the continuous expansion of the leather, customer electronics, electrical systems, textile industries, and flame insulation coatings. Additionally, brominated flame retardants (BFRS) are mixes of synthetic chemicals that are added to a broad range of products, including those intended for industrial use, to make them less explosive. Further, by 2030, the non-halogenated segment will likely dominate the market due to the increasing demand for environmentally friendly and less toxic flame retardants. Also, non-halogenated flame retardants are made utilising Phosphorous, Metal Oxide, and Nitrogen. Apart from this, antimony oxides are an inorganic chemical compound primarily used as a flame retardant additive for different types of rubbers, plastics, fibres, etc. Antimony oxides are found in nature in the form of minerals valentinite & senarmontite. Moreover, it is used as an opacifying vendor for glass enamels & glasses. It also finds its application as a helpful catalyst in the production of polyethene terephthalate plastic & the vulcanization of rubber.
The application segment is divided into electrical & electronics, construction, textile, manufacturing, automotive, and others. In 2022, the electrical & electronics segment dominated the market, accounting for around 28.16% of global revenue. This growth is attributed to the escalating demand for computers, smartphones, tablets, and other latest electronic devices. The electronic components contain circuit boards, wires and cables, connectors and switches. These are considered to be potential sources of ignition. Further, by 2030, the construction segment will likely dominate the market due to rising construction activities and infrastructure development.
| Attribute | Description |
|---|---|
| Market Size | Revenue (USD Billion) |
| Market size value in 2022 | USD 8.55 Billion |
| Market size value in 2030 | USD 15.03 Billion |
| CAGR (2022 to 2030) | 7.30% |
| Historical data | 2019-2020 |
| Base Year | 2021 |
| Forecast | 2022-2030 |
| Segments | Key Segments are polymer, type, application, and regions |
| Regional Segments | The key regions are North America, South America, Europe, Asia Pacific, and Middle East & Africa. |
As per The Brainy Insights, the size of the flame-retardant market was valued at USD 8.55 Billion in 2022 to USD 15.03 Billion by 2030.
Global flame-retardant market is growing at a CAGR of 7.30% during the forecast period 2022-2030.
Asia Pacific region emerged as the largest market for the flame retardant.
The global flame-retardant market has been segmented based on polymer, type, application, and regions. The epoxy segment led polymer segment in 2021. The brominated & chlorinated segment led the type segment in 2021.
Key players are BASF SE, Lanxess AG, The Dow Chemical Company, Broadview Technologies Inc., Clariant Corporation, Nabaltec AG, ICL Industrial Products, Dover Chemical Corporation, DSM, Broadview Technologies Inc.
1. Introduction
1.1. Objectives of the Study
1.2. Market Definition
1.3. Research Scope
1.4. Currency
1.5. Key Target Audience
2. Research Methodology and Assumptions
3. Executive Summary
4. Premium Insights
4.1. Porter’s Five Forces Analysis
4.2. Value Chain Analysis
4.3. Top Investment Pockets
4.3.1. Market Attractiveness Analysis By Polymer
4.3.2. Market Attractiveness Analysis By Type
4.3.3. Market Attractiveness Analysis By Application
4.3.4. Market Attractiveness Analysis By Region
4.4. Industry Trends
5. Market Dynamics
5.1. Market Evaluation
5.2. Drivers
5.2.1. The rapid industrialization
5.2.2. The increasing demand for electronics and automotive applications
5.2.3. The increasing construction activities across the world
5.2.4. The growing economy
5.3. Restraints
5.3.1. A higher price of flame retardant products
5.3.2. The ineffective control and lack of compliance
5.4. Opportunities
5.4.1. The ongoing research and development activities
6. Global Flame Retardant Market Analysis and Forecast, By Polymer
6.1. Segment Overview
6.2. Polyolefin
6.3. Polyamide
6.4. Epoxy
6.5. Polyesters
6.6. Polyurethanes
6.7. Vinyl Ester
6.8. Others
7. Global Flame Retardant Market Analysis and Forecast, By Type
7.1. Segment Overview
7.2. Aluminium Trihydroxide Organophosphorus Compounds
7.3. Halogenated
7.4. Non-Halogenated
7.5. Brominated & Chlorinated
7.6. Antimony Oxides
7.7. Others
8. Global Flame Retardant Market Analysis and Forecast, By Application
8.1. Segment Overview
8.2. Electrical & Electronics
8.3. Construction
8.4. Textile
8.5. Manufacturing
8.6. Automotive
8.7. Others
9. Global Flame Retardant Market Analysis and Forecast, By Regional Analysis
9.1. Segment Overview
9.2. North America
9.2.1. U.S.
9.2.2. Canada
9.2.3. Mexico
9.3. Europe
9.3.1. Germany
9.3.2. France
9.3.3. U.K.
9.3.4. Italy
9.3.5. Spain
9.4. Asia-Pacific
9.4.1. Japan
9.4.2. China
9.4.3. India
9.5. South America
9.5.1. Brazil
9.6. Middle East and Africa
9.6.1. UAE
9.6.2. South Africa
10. Global Flame Retardant Market-Competitive Landscape
10.1. Overview
10.2. Market Share of Key Players in Global Flame Retardant Market
10.2.1. Global Company Market Share
10.2.2. North America Company Market Share
10.2.3. Europe Company Market Share
10.2.4. APAC Company Market Share
10.3. Competitive Situations and Trends
10.3.1. Product Launches and Developments
10.3.2. Partnerships, Collaborations, and Agreements
10.3.3. Mergers & Acquisitions
10.3.4. Expansions
11. Company Profiles
11.1. BASF SE
11.1.1. Business Overview
11.1.2. Company Snapshot
11.1.3. Company Market Share Analysis
11.1.4. Company Product Portfolio
11.1.5. Recent Developments
11.1.6. SWOT Analysis
11.2. Lanxess AG
11.2.1. Business Overview
11.2.2. Company Snapshot
11.2.3. Company Market Share Analysis
11.2.4. Company Product Portfolio
11.2.5. Recent Developments
11.2.6. SWOT Analysis
11.3. The Dow Chemical Company
11.3.1. Business Overview
11.3.2. Company Snapshot
11.3.3. Company Market Share Analysis
11.3.4. Company Product Portfolio
11.3.5. Recent Developments
11.3.6. SWOT Analysis
11.4. Broadview Technologies Inc.
11.4.1. Business Overview
11.4.2. Company Snapshot
11.4.3. Company Market Share Analysis
11.4.4. Company Product Portfolio
11.4.5. Recent Developments
11.4.6. SWOT Analysis
11.5. Clariant Corporation
11.5.1. Business Overview
11.5.2. Company Snapshot
11.5.3. Company Market Share Analysis
11.5.4. Company Product Portfolio
11.5.5. Recent Developments
11.5.6. SWOT Analysis
11.6. Nabaltec AG
11.6.1. Business Overview
11.6.2. Company Snapshot
11.6.3. Company Market Share Analysis
11.6.4. Company Product Portfolio
11.6.5. Recent Developments
11.6.6. SWOT Analysis
11.7. ICL Industrial Products
11.7.1. Business Overview
11.7.2. Company Snapshot
11.7.3. Company Market Share Analysis
11.7.4. Company Product Portfolio
11.7.5. Recent Developments
11.7.6. SWOT Analysis
11.8. Dover Chemical Corporation
11.8.1. Business Overview
11.8.2. Company Snapshot
11.8.3. Company Market Share Analysis
11.8.4. Company Product Portfolio
11.8.5. Recent Developments
11.8.6. SWOT Analysis
11.9. DSM
11.9.1. Business Overview
11.9.2. Company Snapshot
11.9.3. Company Market Share Analysis
11.9.4. Company Product Portfolio
11.9.5. Recent Developments
11.9.6. SWOT Analysis
11.10. Broadview Technologies Inc.
11.10.1. Business Overview
11.10.2. Company Snapshot
11.10.3. Company Market Share Analysis
11.10.4. Company Product Portfolio
11.10.5. Recent Developments
11.10.6. SWOT Analysis
11.11. Adeka Corporation
11.11.1. Business Overview
11.11.2. Company Snapshot
11.11.3. Company Market Share Analysis
11.11.4. Company Product Portfolio
11.11.5. Recent Developments
11.11.6. SWOT Analysis
11.12. Akzo Nobel N.V.
11.12.1. Business Overview
11.12.2. Company Snapshot
11.12.3. Company Market Share Analysis
11.12.4. Company Product Portfolio
11.12.5. Recent Developments
11.12.6. SWOT Analysis
11.13. LyondellBasell
11.13.1. Business Overview
11.13.2. Company Snapshot
11.13.3. Company Market Share Analysis
11.13.4. Company Product Portfolio
11.13.5. Recent Developments
11.13.6. SWOT Analysis
11.14. Asahi Kasei
11.14.1. Business Overview
11.14.2. Company Snapshot
11.14.3. Company Market Share Analysis
11.14.4. Company Product Portfolio
11.14.5. Recent Developments
11.14.6. SWOT Analysis
11.15. Budenheim
11.15.1. Business Overview
11.15.2. Company Snapshot
11.15.3. Company Market Share Analysis
11.15.4. Company Product Portfolio
11.15.5. Recent Developments
11.15.6. SWOT Analysis
List of Table
1. Global Flame Retardant Market, By Polymer, 2019-2030 (USD Billion) (Kilotons)
2. Global Polyolefin, Flame Retardant Market, By Region, 2019-2030 (USD Billion) (Kilotons)
3. Global Polyamide, Flame Retardant Market, By Region, 2019-2030 (USD Billion) (Kilotons)
4. Global Epoxy, Flame Retardant Market, By Region, 2019-2030 (USD Billion) (Kilotons)
5. Global Polyesters, Flame Retardant Market, By Region, 2019-2030 (USD Billion) (Kilotons)
6. Global Polyurethanes, Flame Retardant Market, By Region, 2019-2030 (USD Billion) (Kilotons)
7. Global Vinyl Ester, Flame Retardant Market, By Region, 2019-2030 (USD Billion) (Kilotons)
8. Global Others, Flame Retardant Market, By Region, 2019-2030 (USD Billion) (Kilotons)
9. Global Flame Retardant Market, By Type, 2019-2030 (USD Billion) (Kilotons)
10. Global Aluminium Trihydroxide Organophosphorus Compounds, Flame Retardant Market, By Region, 2019-2030 (USD Billion) (Kilotons)
11. Global Halogenated, Flame Retardant Market, By Region, 2019-2030 (USD Billion) (Kilotons)
12. Global Non-Halogenated, Flame Retardant Market, By Region, 2019-2030 (USD Billion) (Kilotons)
13. Global Brominated & Chlorinated, Flame Retardant Market, By Region, 2019-2030 (USD Billion) (Kilotons)
14. Global Antimony Oxides, Flame Retardant Market, By Region, 2019-2030 (USD Billion) (Kilotons)
15. Global Others, Flame Retardant Market, By Region, 2019-2030 (USD Billion) (Kilotons)
16. Global Flame Retardant Market, By Application, 2019-2030 (USD Billion) (Kilotons)
17. Global Electrical & Electronics, Flame Retardant Market, By Region, 2019-2030 (USD Billion) (Kilotons)
18. Global Construction, Flame Retardant Market, By Region, 2019-2030 (USD Billion) (Kilotons)
19. Global Textile, Flame Retardant Market, By Region, 2019-2030 (USD Billion) (Kilotons)
20. Global Automotive, Flame Retardant Market, By Region, 2019-2030 (USD Billion) (Kilotons)
21. Global Others, Flame Retardant Market, By Region, 2019-2030 (USD Billion) (Kilotons)
22. Global Others, Flame Retardant Market, By Region, 2019-2030 (USD Billion) (Kilotons)
23. North America Flame Retardant Market, By Polymer, 2019-2030 (USD Billion) (Kilotons)
24. North America Flame Retardant Market, By Type, 2019-2030 (USD Billion) (Kilotons)
25. North America Flame Retardant Market, By Application, 2019-2030 (USD Billion) (Kilotons)
26. U.S. Flame Retardant Market, By Polymer, 2019-2030 (USD Billion) (Kilotons)
27. U.S. Flame Retardant Market, By Type, 2019-2030 (USD Billion) (Kilotons)
28. U.S. Flame Retardant Market, By Application, 2019-2030 (USD Billion) (Kilotons)
29. Canada Flame Retardant Market, By Polymer, 2019-2030 (USD Billion) (Kilotons)
30. Canada Flame Retardant Market, By Type, 2019-2030 (USD Billion) (Kilotons)
31. Canada Flame Retardant Market, By Application, 2019-2030 (USD Billion) (Kilotons)
32. Mexico Flame Retardant Market, By Polymer, 2019-2030 (USD Billion) (Kilotons)
33. Mexico Flame Retardant Market, By Type, 2019-2030 (USD Billion) (Kilotons)
34. Mexico Flame Retardant Market, By Application, 2019-2030 (USD Billion) (Kilotons)
35. Europe Flame Retardant Market, By Polymer, 2019-2030 (USD Billion) (Kilotons)
36. Europe Flame Retardant Market, By Type, 2019-2030 (USD Billion) (Kilotons)
37. Europe Flame Retardant Market, By Application, 2019-2030 (USD Billion) (Kilotons)
38. Germany Flame Retardant Market, By Polymer, 2019-2030 (USD Billion) (Kilotons)
39. Germany Flame Retardant Market, By Type, 2019-2030 (USD Billion) (Kilotons)
40. Germany Flame Retardant Market, By Application, 2019-2030 (USD Billion) (Kilotons)
41. France Flame Retardant Market, By Polymer, 2019-2030 (USD Billion) (Kilotons)
42. France Flame Retardant Market, By Type, 2019-2030 (USD Billion) (Kilotons)
43. France Flame Retardant Market, By Application, 2019-2030 (USD Billion) (Kilotons)
44. U.K. Flame Retardant Market, By Polymer, 2019-2030 (USD Billion) (Kilotons)
45. U.K. Flame Retardant Market, By Type, 2019-2030 (USD Billion) (Kilotons)
46. U.K. Flame Retardant Market, By Application, 2019-2030 (USD Billion) (Kilotons)
47. Italy Flame Retardant Market, By Polymer, 2019-2030 (USD Billion) (Kilotons)
48. Italy Flame Retardant Market, By Type, 2019-2030 (USD Billion) (Kilotons)
49. Italy Flame Retardant Market, By Application, 2019-2030 (USD Billion) (Kilotons)
50. Spain Flame Retardant Market, By Polymer, 2019-2030 (USD Billion) (Kilotons)
51. Spain Flame Retardant Market, By Type, 2019-2030 (USD Billion) (Kilotons)
52. Spain Flame Retardant Market, By Application, 2019-2030 (USD Billion) (Kilotons)
53. Asia Pacific Flame Retardant Market, By Polymer, 2019-2030 (USD Billion) (Kilotons)
54. Asia Pacific Flame Retardant Market, By Type, 2019-2030 (USD Billion) (Kilotons)
55. Asia Pacific Flame Retardant Market, By Application, 2019-2030 (USD Billion) (Kilotons)
56. Japan Flame Retardant Market, By Polymer, 2019-2030 (USD Billion) (Kilotons)
57. Japan Flame Retardant Market, By Type, 2019-2030 (USD Billion) (Kilotons)
58. Japan Flame Retardant Market, By Application, 2019-2030 (USD Billion) (Kilotons)
59. China Flame Retardant Market, By Polymer, 2019-2030 (USD Billion) (Kilotons)
60. China Flame Retardant Market, By Type, 2019-2030 (USD Billion) (Kilotons)
61. China Flame Retardant Market, By Application, 2019-2030 (USD Billion) (Kilotons)
62. India Flame Retardant Market, By Polymer, 2019-2030 (USD Billion) (Kilotons)
63. India Flame Retardant Market, By Type, 2019-2030 (USD Billion) (Kilotons)
64. India Flame Retardant Market, By Application, 2019-2030 (USD Billion) (Kilotons)
65. South America Flame Retardant Market, By Polymer, 2019-2030 (USD Billion) (Kilotons)
66. South America Flame Retardant Market, By Type, 2019-2030 (USD Billion) (Kilotons)
67. South America Flame Retardant Market, By Application, 2019-2030 (USD Billion) (Kilotons)
68. Brazil Flame Retardant Market, By Polymer, 2019-2030 (USD Billion) (Kilotons)
69. Brazil Flame Retardant Market, By Type, 2019-2030 (USD Billion) (Kilotons)
70. Brazil Flame Retardant Market, By Application, 2019-2030 (USD Billion) (Kilotons)
71. Middle East and Africa Flame Retardant Market, By Polymer, 2019-2030 (USD Billion) (Kilotons)
72. Middle East and Africa Flame Retardant Market, By Type, 2019-2030 (USD Billion) (Kilotons)
73. Middle East and Africa Flame Retardant Market, By Application, 2019-2030 (USD Billion) (Kilotons)
74. UAE Flame Retardant Market, By Polymer, 2019-2030 (USD Billion) (Kilotons)
75. UAE Flame Retardant Market, By Type, 2019-2030 (USD Billion) (Kilotons)
76. UAE Flame Retardant Market, By Application, 2019-2030 (USD Billion) (Kilotons)
77. South Africa Flame Retardant Market, By Polymer, 2019-2030 (USD Billion) (Kilotons)
78. South Africa Flame Retardant Market, By Type, 2019-2030 (USD Billion) (Kilotons)
79. South Africa Flame Retardant Market, By Application, 2019-2030 (USD Billion) (Kilotons)
List of Figures
1. Global Flame Retardant Market Segmentation
2. Global Flame Retardant Market: Research Methodology
3. Market Size Estimation Methodology: Bottom-Up Approach
4. Market Size Estimation Methodology: Top- Approach
5. Data Triangulation
6. Porter’s Five Forces Analysis
7. Value Chain Analysis
8. Global Flame Retardant Market Attractiveness Analysis By Polymer
9. Global Flame Retardant Market Attractiveness Analysis By Type
10. Global Flame Retardant Market Attractiveness Analysis By Application
11. Global Flame Retardant Market Attractiveness Analysis By Region
12. Global Flame Retardant Market: Dynamics
13. Global Flame Retardant Market Share By Polymer (2022 & 2030)
14. Global Flame Retardant Market Share By Type (2022 & 2030)
15. Global Flame Retardant Market Share By Application (2022 & 2030)
16. Global Flame Retardant Market Share By Regions (2022 & 2030)
17. Global Flame Retardant Market Share By Company (2021)
This study forecasts revenue at global, regional, and country levels from 2019 to 2030. The Brainy Insights has segmented the global flame retardant based on below mentioned segments:
Global Flame Retardant Market by Polymer:
Global Flame Retardant Market by Type:
Global Flame Retardant Market by Application:
Global Flame Retardant by Region:
Research has its special purpose to undertake marketing efficiently. In this competitive scenario, businesses need information across all industry verticals; the information about customer wants, market demand, competition, industry trends, distribution channels etc. This information needs to be updated regularly because businesses operate in a dynamic environment. Our organization, The Brainy Insights incorporates scientific and systematic research procedures in order to get proper market insights and industry analysis for overall business success. The analysis consists of studying the market from a miniscule level wherein we implement statistical tools which helps us in examining the data with accuracy and precision.
Our research reports feature both; quantitative and qualitative aspects for any market. Qualitative information for any market research process are fundamental because they reveal the customer needs and wants, usage and consumption for any product/service related to a specific industry. This in turn aids the marketers/investors in knowing certain perceptions of the customers. Qualitative research can enlighten about the different product concepts and designs along with unique service offering that in turn, helps define marketing problems and generate opportunities. On the other hand, quantitative research engages with the data collection process through interviews, e-mail interactions, surveys and pilot studies. Quantitative aspects for the market research are useful to validate the hypotheses generated during qualitative research method, explore empirical patterns in the data with the help of statistical tools, and finally make the market estimations.
The Brainy Insights offers comprehensive research and analysis, based on a wide assortment of factual insights gained through interviews with CXOs and global experts and secondary data from reliable sources. Our analysts and industry specialist assume vital roles in building up statistical tools and analysis models, which are used to analyse the data and arrive at accurate insights with exceedingly informative research discoveries. The data provided by our organization have proven precious to a diverse range of companies, facilitating them to address issues such as determining which products/services are the most appealing, whether or not customers use the product in the manner anticipated, the purchasing intentions of the market and many others.
Our research methodology encompasses an idyllic combination of primary and secondary initiatives. Key phases involved in this process are listed below:

The phase involves the gathering and collecting of market data and its related information with the help of different sources & research procedures.

The data procurement stage involves in data gathering and collecting through various data sources.
This stage involves in extensive research. These data sources includes:
Purchased Database: Purchased databases play a crucial role in estimating the market sizes irrespective of the domain. Our purchased database includes:
Primary Research: The Brainy Insights interacts with leading companies and experts of the concerned domain to develop the analyst team’s market understanding and expertise. It improves and substantiates every single data presented in the market reports. Primary research mainly involves in telephonic interviews, E-mail interactions and face-to-face interviews with the raw material providers, manufacturers/producers, distributors, & independent consultants. The interviews that we conduct provides valuable data on market size and industry growth trends prevailing in the market. Our organization also conducts surveys with the various industry experts in order to gain overall insights of the industry/market. For instance, in healthcare industry we conduct surveys with the pharmacists, doctors, surgeons and nurses in order to gain insights and key information of a medical product/device/equipment which the customers are going to usage. Surveys are conducted in the form of questionnaire designed by our own analyst team. Surveys plays an important role in primary research because surveys helps us to identify the key target audiences of the market. Additionally, surveys helps to identify the key target audience engaged with the market. Our survey team conducts the survey by targeting the key audience, thus gaining insights from them. Based on the perspectives of the customers, this information is utilized to formulate market strategies. Moreover, market surveys helps us to understand the current competitive situation of the industry. To be precise, our survey process typically involve with the 360 analysis of the market. This analytical process begins by identifying the prospective customers for a product or service related to the market/industry to obtain data on how a product/service could fit into customers’ lives.

Secondary Research: The secondary data sources includes information published by the on-profit organizations such as World bank, WHO, company fillings, investor presentations, annual reports, national government documents, statistical databases, blogs, articles, white papers and others. From the annual report, we analyse a company’s revenue to understand the key segment and market share of that organization in a particular region. We analyse the company websites and adopt the product mapping technique which is important for deriving the segment revenue. In the product mapping method, we select and categorize the products offered by the companies catering to domain specific market, deduce the product revenue for each of the companies so as to get overall estimation of the market size. We also source data and analyses trends based on information received from supply side and demand side intermediaries in the value chain. The supply side denotes the data gathered from supplier, distributor, wholesaler and the demand side illustrates the data gathered from the end customers for respective market domain.

The supply side for a domain specific market is analysed by:
The demand side for the market is estimated through:
In-house Library: Apart from these third-party sources, we have our in-house library of qualitative and quantitative information. Our in-house database includes market data for various industry and domains. These data are updated on regular basis as per the changing market scenario. Our library includes, historic databases, internal audit reports and archives.
Sometimes there are instances where there is no metadata or raw data available for any domain specific market. For those cases, we use our expertise to forecast and estimate the market size in order to generate comprehensive data sets. Our analyst team adopt a robust research technique in order to produce the estimates:
Data Synthesis: This stage involves the analysis & mapping of all the information obtained from the previous step. It also involves in scrutinizing the data for any discrepancy observed while data gathering related to the market. The data is collected with consideration to the heterogeneity of sources. Robust scientific techniques are in place for synthesizing disparate data sets and provide the essential contextual information that can orient market strategies. The Brainy Insights has extensive experience in data synthesis where the data passes through various stages:


Market Deduction & Formulation: The final stage comprises of assigning data points at appropriate market spaces so as to deduce feasible conclusions. Analyst perspective & subject matter expert based holistic form of market sizing coupled with industry analysis also plays a crucial role in this stage.
This stage involves in finalization of the market size and numbers that we have collected from data integration step. With data interpolation, it is made sure that there is no gap in the market data. Successful trend analysis is done by our analysts using extrapolation techniques, which provide the best possible forecasts for the market.
Data Validation & Market Feedback: Validation is the most important step in the process. Validation & re-validation via an intricately designed process helps us finalize data-points to be used for final calculations.

The Brainy Insights interacts with leading companies and experts of the concerned domain to develop the analyst team’s market understanding and expertise. It improves and substantiates every single data presented in the market reports. The data validation interview and discussion panels are typically composed of the most experienced industry members. The participants include, however, are not limited to:
Moreover, we always validate our data and findings through primary respondents from all the major regions we are working on.


Free Customization
Fortune 500 Clients
Free Yearly Update On Purchase Of Multi/Corporate License
Companies Served Till Date