- +1-315-215-1633
- sales@thebrainyinsights.com

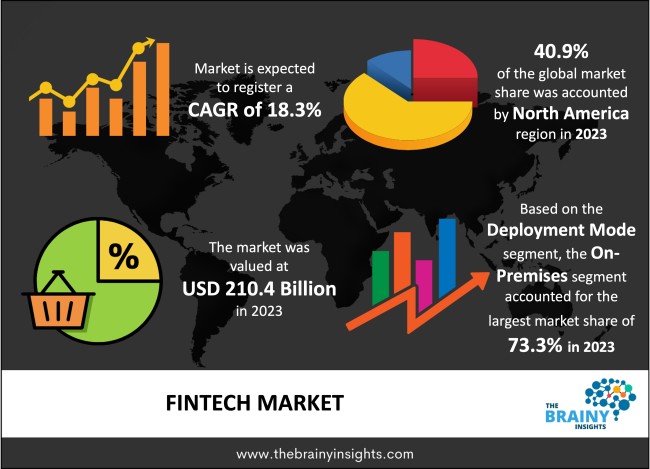
The global fintech market was valued at USD 248.21 Billion in 2022 and grew at a CAGR of 12.31% from 2023 to 2032. The market is expected to reach USD 792.50 Billion by 2032. The growth of the fintech market can be attributed to the continuous investment in developing innovative technology for the finance sector.
Financial technology, or fintech, refers to a broad category of software, mobile applications, and other technologies designed to enhance and automate conventional financial services for consumers and enterprises. FinTech provides many technologies, from mobile payment apps to blockchain networks storing encrypted transactions. FinTech makes financial transactions easier for organizations and customers to do, increasing accessibility and typically lowering costs. It can also apply to businesses and services that use big data, encrypted blockchain, and artificial intelligence to enable extremely safe internal network transactions. Fintech aims to simplify transactions by removing stages that might be excessive for all parties involved. Fintech has evolved and expanded over time due to advancements in the larger technology industry.
Get an overview of this study by requesting a free sample
Increasing demand for online financing: The usage of digital payments by U.S. customers is growing in several ways. Provider prospects are changing due to user expectations about payment functionality and integration. In addition to the fact that the percentage of respondents who report using two or more digital payment methods has increased even faster—from 51 per cent in 2021 to 62 per cent in 2022—digital payment penetration has also increased to 89 per cent in 2022. Within the next two years, almost two-thirds of Americans anticipate owning a digital wallet, and many will probably have multiple wallets. The percentage of consumers who want to use three or more digital wallets in the upcoming years increased significantly, from 18% in the study conducted in 2021 to 30% in 2022. This is a significant modification compared to the traditional approach of carrying cash.
High installation cost of devices: The price of developing a FinTech application ranges with the features. The criteria and goals of each organization are different, which influences how much it costs to design a FinTech application. Several variables affect an app's price, such as its functionality, features, app development agency location, and overall development time. The FinTech app's integration of upgraded solutions and contemporary technologies can range from $60,000 to $100,000.
Technological advancements of products and services: These are some of the technologies that will likely influence FinTech in the future. Users and businesses will benefit from integrating cutting-edge technologies with the financial sector. The global economy's digitization and the uptake of new technologies will determine the direction of the FinTech industry. Additionally, as FinTech spreads worldwide, several technologies have been used to meet the needs of the industry. With automated and embedded security controls, cloud computing integration improves security. The application of machine learning not only aids in data mining—making the process easier or predicting results—but also helps with risk management, strategy aggregation, strategy refinement, and trade idea generation.
The regions analyzed for the market include North America, Europe, South America, Asia Pacific, the Middle East, and Africa. North America emerged as the most significant fintech market, with a 40.08% market revenue share in 2022.
North American region will account for the largest market share with revenue growth. The consumers in the region are well aware of the usage of fintech products. The prominent global players have headquarters in the U.S., propelling the regional market's growth. Further, the regulators in the region provide incentives for the development of fintech apps and services, which can help enhance the traditional functions of finance institutions.
North America region Fintech Market Share in 2022 - 40.08%
www.thebrainyinsights.com
Check the geographical analysis of this market by requesting a free sample
The deployment mode segment is divided into on-premises and cloud. The on-premises segment dominated the market, with a share of around 73.18% in 2022. Resources are deployed internally and within an organization's I.T.I.T. infrastructure in an on-premises setting. An enterprise must maintain the solution and its associated processes. Businesses that use on-premise software deployment are responsible for the continuing expenses associated with server hardware.
The technology segment is divided into cyber security, artificial intelligence, blockchain, public cloud infrastructure, biometrics, identity management, and others. The artificial intelligence segment dominated the market, with a share of around 42.82% in 2022. Financial sector companies can use artificial intelligence to manage and analyze data from many sources to obtain insightful information. These creative outcomes assist banks in overcoming the obstacles they encounter daily when providing routine services like payment processing.
The application segment is divided into fund and payment transfer, wealth management, insurance, digital lending and lending marketplaces and others. The fund and payment transfer segment dominated the market, with a share of around 49.01% in 2022. All of the intermediaries—banks and agents—used in traditional transfer methods are eliminated by fintech apps. FinTechs can charge very little fees—often less than 1% of the transfer amount—because they do not have to pay these overhead expenses.
The providers segment is divided into banks, non-banking finance companies, investment firms, and payment processors. The banks segment dominated the market, with a share of around 39.55% in 2022. Open development and Software-as-a-Service solutions from FinTech start-ups are being used by banks more frequently in an attempt to simplify and readily integrate operational capabilities and transition to digital/mobile delivery.
Report Description:
| Attribute | Description |
|---|---|
| Market Size | Revenue (USD Billion) |
| Market size value in 2022 | USD 248.21 Billion |
| Market size value in 2032 | USD 792.50 Billion |
| CAGR (2023 to 2032) | 12.31% |
| Historical data | 2019-2021 |
| Base Year | 2022 |
| Forecast | 2023-2032 |
| Region | The regions analyzed for the market are Asia Pacific, Europe, South America, North America, and Middle East & Africa. Furthermore, the regions are further analyzed at the country level. |
| Segments | Deployment Mode, Technology, Application and Providers |
As per The Brainy Insights, the size of the fintech market was valued 248.21 billion in 2022 to USD 792.50 Billion by 2032.
Global fintech market is growing at a CAGR of 12.31% during the forecast period 2023-2032.
North America region emerged as the largest market for the fintech.
The market's growth will be influenced by the growing usage of online wallets.
The data privacy issues can hamper the market growth.
The increasing technological advancements are providing huge opportunities to the market.
1. Introduction
1.1. Objectives of the Study
1.2. Market Definition
1.3. Research Scope
1.4. Currency
1.5. Key Target Audience
2. Research Methodology and Assumptions
3. Executive Summary
4. Premium Insights
4.1. Porter’s Five Forces Analysis
4.2. Value Chain Analysis
4.3. Top Investment Pockets
4.3.1. Market Attractiveness Analysis by Deployment Mode
4.3.2. Market Attractiveness Analysis by Technology
4.3.3. Market Attractiveness Analysis by Application
4.3.4. Market Attractiveness Analysis by Providers
4.3.5. Market Attractiveness Analysis by Region
4.4. Industry Trends
5. Market Dynamics
5.1. Market Evaluation
5.2. Drivers
5.2.1. Increasing usage of online wallets
5.3. Restraints
5.3.1. High cost of product development
5.4. Opportunities
5.4.1. Increasing advancement in development of products and services
5.5. Challenges
5.5.1. Data privacy issues
6. Global Fintech Market Analysis and Forecast, By Deployment Mode
6.1. Segment Overview
6.2. On-Premises
6.3. Cloud
7. Global Fintech Market Analysis and Forecast, By Technology
7.1. Segment Overview
7.2. Cyber Security
7.3. Artificial Intelligence
7.4. Blockchain
7.5. Public Cloud Infrastructure
7.6. Biometrics and Indentify Management
7.7. Others
8. Global Fintech Market Analysis and Forecast, By Application
8.1. Segment Overview
8.2. Fund and Payment Transfer
8.3. Wealth Management
8.4. Insurance
8.5. Digital Lending and Lending Marketplaces
8.6. Others
9. Global Fintech Market Analysis and Forecast, By Providers
9.1. Segment Overview
9.2. Banks
9.3. Non-Banking Finance Companies
9.4. Investment Firms
9.5. Payment Processor
9.6. Others
10. Global Fintech Market Analysis and Forecast, By Regional Analysis
10.1. Segment Overview
10.2. North America
10.2.1. U.S.
10.2.2. Canada
10.2.3. Mexico
10.3. Europe
10.3.1. Germany
10.3.2. France
10.3.3. U.K.
10.3.4. Italy
10.3.5. Spain
10.4. Asia-Pacific
10.4.1. Japan
10.4.2. China
10.4.3. India
10.5. South America
10.5.1. Brazil
10.6. Middle East and Africa
10.6.1. UAE
10.6.2. South Africa
11. Global Fintech Market-Competitive Landscape
11.1. Overview
11.2. Market Share of Key Players in the Fintech Market
11.2.1. Global Company Market Share
11.2.2. North America Company Market Share
11.2.3. Europe Company Market Share
11.2.4. APAC Company Market Share
11.3. Competitive Situations and Trends
11.3.1. Product Launches and Developments
11.3.2. Partnerships, Collaborations, and Agreements
11.3.3. Mergers & Acquisitions
11.3.4. Expansions
12. Company Profiles
12.1. Bankable
12.1.1. Business Overview
12.1.2. Company Snapshot
12.1.3. Company Market Share Analysis
12.1.4. Company Product Portfolio
12.1.5. Recent Developments
12.1.6. SWOT Analysis
12.2. Circle Internet Financial Limited
12.2.1. Business Overview
12.2.2. Company Snapshot
12.2.3. Company Market Share Analysis
12.2.4. Company Product Portfolio
12.2.5. Recent Developments
12.2.6. SWOT Analysis
12.3. Blockstream Corporation Inc.
12.3.1. Business Overview
12.3.2. Company Snapshot
12.3.3. Company Market Share Analysis
12.3.4. Company Product Portfolio
12.3.5. Recent Developments
12.3.6. SWOT Analysis
12.4. Cisco Systems Inc.
12.4.1. Business Overview
12.4.2. Company Snapshot
12.4.3. Company Market Share Analysis
12.4.4. Company Product Portfolio
12.4.5. Recent Developments
12.4.6. SWOT Analysis
12.5. IBM Corporation
12.5.1. Business Overview
12.5.2. Company Snapshot
12.5.3. Company Market Share Analysis
12.5.4. Company Product Portfolio
12.5.5. Recent Developments
12.5.6. SWOT Analysis
12.6. Goldman Sachs
12.6.1. Business Overview
12.6.2. Company Snapshot
12.6.3. Company Market Share Analysis
12.6.4. Company Product Portfolio
12.6.5. Recent Developments
12.6.6. SWOT Analysis
12.7. Microsoft
12.7.1. Business Overview
12.7.2. Company Snapshot
12.7.3. Company Market Share Analysis
12.7.4. Company Product Portfolio
12.7.5. Recent Developments
12.7.6. SWOT Analysis
12.8. Oracle
12.8.1. Business Overview
12.8.2. Company Snapshot
12.8.3. Company Market Share Analysis
12.8.4. Company Product Portfolio
12.8.5. Recent Developments
12.8.6. SWOT Analysis
12.9. NVIDIA Corporation
12.9.1. Business Overview
12.9.2. Company Snapshot
12.9.3. Company Market Share Analysis
12.9.4. Company Product Portfolio
12.9.5. Recent Developments
12.9.6. SWOT Analysis
12.10. Tata Consultancy Services Limited
12.10.1. Business Overview
12.10.2. Company Snapshot
12.10.3. Company Market Share Analysis
12.10.4. Company Product Portfolio
12.10.5. Recent Developments
12.10.6. SWOT Analysis
12.11. Ant Financials
12.11.1. Business Overview
12.11.2. Company Snapshot
12.11.3. Company Market Share Analysis
12.11.4. Company Product Portfolio
12.11.5. Recent Developments
12.11.6. SWOT Analysis
12.12. Paypal
12.12.1. Business Overview
12.12.2. Company Snapshot
12.12.3. Company Market Share Analysis
12.12.4. Company Product Portfolio
12.12.5. Recent Developments
12.12.6. SWOT Analysis
12.13. SoFi
12.13.1. Business Overview
12.13.2. Company Snapshot
12.13.3. Company Market Share Analysis
12.13.4. Company Product Portfolio
12.13.5. Recent Developments
12.13.6. SWOT Analysis
12.14. Adyen
12.14.1. Business Overview
12.14.2. Company Snapshot
12.14.3. Company Market Share Analysis
12.14.4. Company Product Portfolio
12.14.5. Recent Developments
12.14.6. SWOT Analysis
12.15. Ally Financials
12.15.1. Business Overview
12.15.2. Company Snapshot
12.15.3. Company Market Share Analysis
12.15.4. Company Product Portfolio
12.15.5. Recent Developments
12.15.6. SWOT Analysis
12.16. Oscar Health
12.16.1. Business Overview
12.16.2. Company Snapshot
12.16.3. Company Market Share Analysis
12.16.4. Company Product Portfolio
12.16.5. Recent Developments
12.16.6. SWOT Analysis
List of Table
1. Global Fintech Market, By Deployment Mode, 2019-2032 (USD Billion)
2. Global On-Premises, Fintech Market, By Region, 2019-2032 (USD Billion)
3. Global Cloud, Fintech Market, By Region, 2019-2032 (USD Billion)
4. Global Fintech Market, By Technology, 2019-2032 (USD Billion)
5. Global Cyber Security, Fintech Market, By Region, 2019-2032 (USD Billion)
6. Global Artificial Intelligence, Fintech Market, By Region, 2019-2032 (USD Billion)
7. Global Blockchain, Fintech Market, By Region, 2019-2032 (USD Billion)
8. Global Public Cloud Infrastructure, Fintech Market, By Region, 2019-2032 (USD Billion)
9. Global Biometrics and Indentify Management, Fintech Market, By Region, 2019-2032 (USD Billion)
10. Global Others, Fintech Market, By Region, 2019-2032 (USD Billion)
11. Global Fintech Market, By Application, 2019-2032 (USD Billion)
12. Global Fund and Payment Transfer, Fintech Market, By Region, 2019-2032 (USD Billion)
13. Global Wealth Management, Fintech Market, By Region, 2019-2032 (USD Billion)
14. Global Insurance, Fintech Market, By Region, 2019-2032 (USD Billion)
15. Global Digital Lending and Lending Marketplaces, Fintech Market, By Region, 2019-2032 (USD Billion)
16. Global Others, Fintech Market, By Region, 2019-2032 (USD Billion)
17. Global Fintech Market, By Providers, 2019-2032 (USD Billion)
18. Global Banks, Fintech Market, By Region, 2019-2032 (USD Billion)
19. Global Non-Banking Finance Companies, Fintech Market, By Region, 2019-2032 (USD Billion)
20. Global Investment Firms, Fintech Market, By Region, 2019-2032 (USD Billion)
21. Global Payment Processor, Fintech Market, By Region, 2019-2032 (USD Billion)
22. Global Others, Fintech Market, By Region, 2019-2032 (USD Billion)
23. Global Fintech Market, By Region, 2019-2032 (USD Billion)
24. North America Fintech Market, By Deployment Mode, 2019-2032 (USD Billion)
25. North America Fintech Market, By Technology, 2019-2032 (USD Billion)
26. North America Fintech Market, By Application, 2019-2032 (USD Billion)
27. North America Fintech Market, By Providers, 2019-2032 (USD Billion)
28. U.S. Fintech Market, By Deployment Mode, 2019-2032 (USD Billion)
29. U.S. Fintech Market, By Technology, 2019-2032 (USD Billion)
30. U.S. Fintech Market, By Application, 2019-2032 (USD Billion)
31. U.S. Fintech Market, By Providers, 2019-2032 (USD Billion)
32. Canada Fintech Market, By Deployment Mode, 2019-2032 (USD Billion)
33. Canada Fintech Market, By Technology, 2019-2032 (USD Billion)
34. Canada Fintech Market, By Application, 2019-2032 (USD Billion)
35. Canada Fintech Market, By Providers, 2019-2032 (USD Billion)
36. Mexico Fintech Market, By Deployment Mode, 2019-2032 (USD Billion)
37. Mexico Fintech Market, By Technology, 2019-2032 (USD Billion)
38. Mexico Fintech Market, By Application, 2019-2032 (USD Billion)
39. Mexico Fintech Market, By Providers, 2019-2032 (USD Billion)
40. Europe Fintech Market, By Deployment Mode, 2019-2032 (USD Billion)
41. Europe Fintech Market, By Technology, 2019-2032 (USD Billion)
42. Europe Fintech Market, By Application, 2019-2032 (USD Billion)
43. Europe Fintech Market, By Providers, 2019-2032 (USD Billion)
44. Germany Fintech Market, By Deployment Mode, 2019-2032 (USD Billion)
45. Germany Fintech Market, By Technology, 2019-2032 (USD Billion)
46. Germany Fintech Market, By Application, 2019-2032 (USD Billion)
47. Germany Fintech Market, By Providers, 2019-2032 (USD Billion)
48. France Fintech Market, By Deployment Mode, 2019-2032 (USD Billion)
49. France Fintech Market, By Technology, 2019-2032 (USD Billion)
50. France Fintech Market, By Application, 2019-2032 (USD Billion)
51. France Fintech Market, By Providers, 2019-2032 (USD Billion)
52. U.K. Fintech Market, By Deployment Mode, 2019-2032 (USD Billion)
53. U.K. Fintech Market, By Technology, 2019-2032 (USD Billion)
54. U.K. Fintech Market, By Application, 2019-2032 (USD Billion)
55. U.K. Fintech Market, By Providers, 2019-2032 (USD Billion)
56. Italy Fintech Market, By Deployment Mode, 2019-2032 (USD Billion)
57. Italy Fintech Market, By Technology, 2019-2032 (USD Billion)
58. Italy Fintech Market, By Application, 2019-2032 (USD Billion)
59. Italy Fintech Market, By Providers, 2019-2032 (USD Billion)
60. Spain Fintech Market, By Deployment Mode, 2019-2032 (USD Billion)
61. Spain Fintech Market, By Technology, 2019-2032 (USD Billion)
62. Spain Fintech Market, By Application, 2019-2032 (USD Billion)
63. Spain Fintech Market, By Providers, 2019-2032 (USD Billion)
64. Asia Pacific Fintech Market, By Deployment Mode, 2019-2032 (USD Billion)
65. Asia Pacific Fintech Market, By Technology, 2019-2032 (USD Billion)
66. Asia Pacific Fintech Market, By Application, 2019-2032 (USD Billion)
67. Asia Pacific Fintech Market, By Providers, 2019-2032 (USD Billion)
68. Japan Fintech Market, By Deployment Mode, 2019-2032 (USD Billion)
69. Japan Fintech Market, By Technology, 2019-2032 (USD Billion)
70. Japan Fintech Market, By Application, 2019-2032 (USD Billion)
71. Japan Fintech Market, By Providers, 2019-2032 (USD Billion)
72. China Fintech Market, By Deployment Mode, 2019-2032 (USD Billion)
73. China Fintech Market, By Technology, 2019-2032 (USD Billion)
74. China Fintech Market, By Application, 2019-2032 (USD Billion)
75. China Fintech Market, By Providers, 2019-2032 (USD Billion)
76. India Fintech Market, By Deployment Mode, 2019-2032 (USD Billion)
77. India Fintech Market, By Technology, 2019-2032 (USD Billion)
78. India Fintech Market, By Application, 2019-2032 (USD Billion)
79. India Fintech Market, By Providers, 2019-2032 (USD Billion)
80. South America Fintech Market, By Deployment Mode, 2019-2032 (USD Billion)
81. South America Fintech Market, By Technology, 2019-2032 (USD Billion)
82. South America Fintech Market, By Application, 2019-2032 (USD Billion)
83. South America Fintech Market, By Providers, 2019-2032 (USD Billion)
84. Brazil Fintech Market, By Deployment Mode, 2019-2032 (USD Billion)
85. Brazil Fintech Market, By Technology, 2019-2032 (USD Billion)
86. Brazil Fintech Market, By Application, 2019-2032 (USD Billion)
87. BrazilFintech Market, By Providers, 2019-2032 (USD Billion)
88. Middle East and Africa Fintech Market, By Deployment Mode, 2019-2032 (USD Billion)
89. Middle East and Africa Fintech Market, By Technology, 2019-2032 (USD Billion)
90. Middle East and Africa Fintech Market, By Application, 2019-2032 (USD Billion)
91. Middle East and Africa Fintech Market, By Providers, 2019-2032 (USD Billion)
92. UAE Fintech Market, By Deployment Mode, 2019-2032 (USD Billion)
93. UAE Fintech Market, By Technology, 2019-2032 (USD Billion)
94. UAE Fintech Market, By Application, 2019-2032 (USD Billion)
95. UAE Fintech Market, By Providers, 2019-2032 (USD Billion)
96. South Africa Fintech Market, By Deployment Mode, 2019-2032 (USD Billion)
97. South Africa Fintech Market, By Technology, 2019-2032 (USD Billion)
98. South Africa Fintech Market, By Application, 2019-2032 (USD Billion)
99. South Africa Fintech Market, By Providers, 2019-2032 (USD Billion)
List of Figures
1. Global Fintech Market Segmentation
2. Fintech Market: Research Methodology
3. Market Size Estimation Methodology: Bottom-Up Approach
4. Market Size Estimation Methodology: Top-Down Approach
5. Data Triangulation
6. Porter’s Five Forces Analysis
7. Value Chain Analysis
8. Global Fintech Market Attractiveness Analysis by Deployment Mode
9. Global Fintech Market Attractiveness Analysis by Technology
10. Global Fintech Market Attractiveness Analysis by Application
11. Global Fintech Market Attractiveness Analysis by Providers
12. Global Fintech Market Attractiveness Analysis by Region
13. Global Fintech Market: Dynamics
14. Global Fintech Market Share by Deployment Mode (2022 & 2032)
15. Global Fintech Market Share by Technology (2022 & 2032)
16. Global Fintech Market Share by Application (2022 & 2032)
17. Global Fintech Market Share by Providers (2022 & 2032)
18. Global Fintech Market Share by Regions (2022 & 2032)
19. Global Fintech Market Share by Company (2022)
This study forecasts revenue at global, regional, and country levels from 2019 to 2032. The Brainy Insights has segmented the global fintech market based on below mentioned segments:
Global Fintech Market by Deployment Mode:
Global Fintech Market by Technology:
Global Fintech Market by Application:
Global Fintech Market by Providers:
Global Fintech Market by Region:
Research has its special purpose to undertake marketing efficiently. In this competitive scenario, businesses need information across all industry verticals; the information about customer wants, market demand, competition, industry trends, distribution channels etc. This information needs to be updated regularly because businesses operate in a dynamic environment. Our organization, The Brainy Insights incorporates scientific and systematic research procedures in order to get proper market insights and industry analysis for overall business success. The analysis consists of studying the market from a miniscule level wherein we implement statistical tools which helps us in examining the data with accuracy and precision.
Our research reports feature both; quantitative and qualitative aspects for any market. Qualitative information for any market research process are fundamental because they reveal the customer needs and wants, usage and consumption for any product/service related to a specific industry. This in turn aids the marketers/investors in knowing certain perceptions of the customers. Qualitative research can enlighten about the different product concepts and designs along with unique service offering that in turn, helps define marketing problems and generate opportunities. On the other hand, quantitative research engages with the data collection process through interviews, e-mail interactions, surveys and pilot studies. Quantitative aspects for the market research are useful to validate the hypotheses generated during qualitative research method, explore empirical patterns in the data with the help of statistical tools, and finally make the market estimations.
The Brainy Insights offers comprehensive research and analysis, based on a wide assortment of factual insights gained through interviews with CXOs and global experts and secondary data from reliable sources. Our analysts and industry specialist assume vital roles in building up statistical tools and analysis models, which are used to analyse the data and arrive at accurate insights with exceedingly informative research discoveries. The data provided by our organization have proven precious to a diverse range of companies, facilitating them to address issues such as determining which products/services are the most appealing, whether or not customers use the product in the manner anticipated, the purchasing intentions of the market and many others.
Our research methodology encompasses an idyllic combination of primary and secondary initiatives. Key phases involved in this process are listed below:

The phase involves the gathering and collecting of market data and its related information with the help of different sources & research procedures.

The data procurement stage involves in data gathering and collecting through various data sources.
This stage involves in extensive research. These data sources includes:
Purchased Database: Purchased databases play a crucial role in estimating the market sizes irrespective of the domain. Our purchased database includes:
Primary Research: The Brainy Insights interacts with leading companies and experts of the concerned domain to develop the analyst team’s market understanding and expertise. It improves and substantiates every single data presented in the market reports. Primary research mainly involves in telephonic interviews, E-mail interactions and face-to-face interviews with the raw material providers, manufacturers/producers, distributors, & independent consultants. The interviews that we conduct provides valuable data on market size and industry growth trends prevailing in the market. Our organization also conducts surveys with the various industry experts in order to gain overall insights of the industry/market. For instance, in healthcare industry we conduct surveys with the pharmacists, doctors, surgeons and nurses in order to gain insights and key information of a medical product/device/equipment which the customers are going to usage. Surveys are conducted in the form of questionnaire designed by our own analyst team. Surveys plays an important role in primary research because surveys helps us to identify the key target audiences of the market. Additionally, surveys helps to identify the key target audience engaged with the market. Our survey team conducts the survey by targeting the key audience, thus gaining insights from them. Based on the perspectives of the customers, this information is utilized to formulate market strategies. Moreover, market surveys helps us to understand the current competitive situation of the industry. To be precise, our survey process typically involve with the 360 analysis of the market. This analytical process begins by identifying the prospective customers for a product or service related to the market/industry to obtain data on how a product/service could fit into customers’ lives.

Secondary Research: The secondary data sources includes information published by the on-profit organizations such as World bank, WHO, company fillings, investor presentations, annual reports, national government documents, statistical databases, blogs, articles, white papers and others. From the annual report, we analyse a company’s revenue to understand the key segment and market share of that organization in a particular region. We analyse the company websites and adopt the product mapping technique which is important for deriving the segment revenue. In the product mapping method, we select and categorize the products offered by the companies catering to domain specific market, deduce the product revenue for each of the companies so as to get overall estimation of the market size. We also source data and analyses trends based on information received from supply side and demand side intermediaries in the value chain. The supply side denotes the data gathered from supplier, distributor, wholesaler and the demand side illustrates the data gathered from the end customers for respective market domain.

The supply side for a domain specific market is analysed by:
The demand side for the market is estimated through:
In-house Library: Apart from these third-party sources, we have our in-house library of qualitative and quantitative information. Our in-house database includes market data for various industry and domains. These data are updated on regular basis as per the changing market scenario. Our library includes, historic databases, internal audit reports and archives.
Sometimes there are instances where there is no metadata or raw data available for any domain specific market. For those cases, we use our expertise to forecast and estimate the market size in order to generate comprehensive data sets. Our analyst team adopt a robust research technique in order to produce the estimates:
Data Synthesis: This stage involves the analysis & mapping of all the information obtained from the previous step. It also involves in scrutinizing the data for any discrepancy observed while data gathering related to the market. The data is collected with consideration to the heterogeneity of sources. Robust scientific techniques are in place for synthesizing disparate data sets and provide the essential contextual information that can orient market strategies. The Brainy Insights has extensive experience in data synthesis where the data passes through various stages:


Market Deduction & Formulation: The final stage comprises of assigning data points at appropriate market spaces so as to deduce feasible conclusions. Analyst perspective & subject matter expert based holistic form of market sizing coupled with industry analysis also plays a crucial role in this stage.
This stage involves in finalization of the market size and numbers that we have collected from data integration step. With data interpolation, it is made sure that there is no gap in the market data. Successful trend analysis is done by our analysts using extrapolation techniques, which provide the best possible forecasts for the market.
Data Validation & Market Feedback: Validation is the most important step in the process. Validation & re-validation via an intricately designed process helps us finalize data-points to be used for final calculations.

The Brainy Insights interacts with leading companies and experts of the concerned domain to develop the analyst team’s market understanding and expertise. It improves and substantiates every single data presented in the market reports. The data validation interview and discussion panels are typically composed of the most experienced industry members. The participants include, however, are not limited to:
Moreover, we always validate our data and findings through primary respondents from all the major regions we are working on.


Free Customization
Fortune 500 Clients
Free Yearly Update On Purchase Of Multi/Corporate License
Companies Served Till Date