- +1-315-215-1633
- sales@thebrainyinsights.com

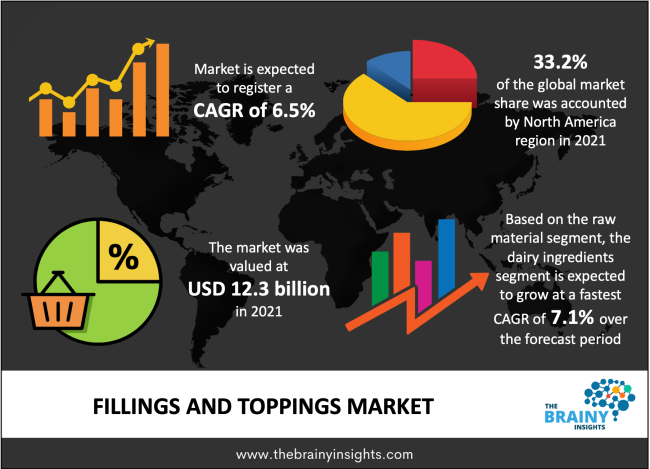
The global fillings and toppings market is expected to reach USD 21.6 billion by 2030, at a CAGR of 6.5% during the forecast period 2022 to 2030. To make the product more attractive, toppings and fillings draw the consumer's attention. In addition, the toppings and fillings give these products a mild and delectable flavour .
Between the layers of the cake, a thick material called fillings is employed. On the other hand, toppings have traditionally been a layer of food spread over a base of a different kind of cuisine. The fillings and toppings are important segments to get the right texture, flavour , and garnishes. It can enhance food items by using fillings and toppings to decorate dairy, dessert, and confectionery products. By improving the product's aesthetic look, it attracts customers. Stabilizer systems are processed in the factory and are adjusted based on the viscosity and texture of the fillings in food items like meat, fish, pasta, frozen food, and bakery. These toppings and fillings might extend the shelf life of the product. The manufacturer also emphasizes using low-calorie fillings or low-sugar toppings for health-conscious customers. The market for fillings and toppings is expanding primarily because of factors such as the customers' ongoing health concerns, rising disposable income, and shifting eating patterns. Other significant factors influencing the fillings and toppings market growth include changing eating patterns, which are anticipated to increase demand for toppings and fillings. However, the market for fillings and toppings will face significant obstacles due to rising health concerns, increased fitness enthusiasts, and compliance with international quality standards and regulations.
Get an overview of this study by requesting a free sample
The market for fillings and toppings is rapidly increasing. In addition, western dietary habits are rising. Furthermore, the global fillings and toppings market will be impacted by rising disposable income and new products on the market. Customers are drawn to those food products that are styled.
The market for fillings and toppings may be constrained by the rising cost of raw materials, which increases the overall cost of the final product. Furthermore, the increasing regulations from national and national and international organizations regarding the safety of food items hinder the market’s growth.
As they are widely used in confectionery & bakery items, dairy products, and drinks, the syrups, pastes & variegate sector contributed the largest share to the worldwide fillings and toppings market. These items are used to improve the food products' aesthetic attractiveness.
The market for fillings and toppings will face significant obstacles, from rising health awareness, increased fitness enthusiasts, and compliance with international quality standards and regulations.
The global fillings and toppings market has been segmented based on type, raw material, form, and region.
The regions analyzed for the fillings and toppings market include North America, Europe, South America, Asia Pacific, the Middle East, and Africa. North America emerged as the largest market for the global Fillings and toppings market, with a 33.2% share of the market revenue in 2021.
North America Region Fillings And Toppings Market Share in 2021 - 33.2%
www.thebrainyinsights.com
Check the geographical analysis of this market by requesting a free sample
The key players are now concentrating on implementing strategies such as adopting new applications, product innovations, mergers & acquisitions, joint ventures, alliances, and partnerships to improve their market position in the global fillings and toppings market industry.
As per The Brainy Insights, the size of the Fillings and Toppings market was valued at USD 12.3 billion in 2021 to USD 21.6 billion by 2030.
The global Fillings and Toppings market is growing at a CAGR of 6.5% during the forecast period 2022-2030.
The rapidly growing bakery industry will influence the market's growth.
An increase in the Syrup Pastes sector will provide huge opportunities to the market.
Key players include Cargill, Archer Daniels Midland Company, Barry Callebaut, Tate & Lyle PLC, AGRANA, Associated British Foods plc, Hanan Products, Bake'n Joy, PreGel, and AAK AB.
1. Introduction
1.1. Objectives of the Study
1.2. Market Definition
1.3. Research Scope
1.4. Currency
1.5. Key Target Audience
2. Research Methodology and Assumptions
3. Executive Summary
4. Premium Insights
4.1. Porter’s Five Forces Analysis
4.2. Value Chain Analysis
4.3. Top Investment Pockets
4.3.1. Market Attractiveness Analysis By Type
4.3.2. Market Attractiveness Analysis By Raw Material
4.3.3. Market Attractiveness Analysis By Form
4.3.4. Market Attractiveness Analysis By Region
4.4. Industry Trends
5. Market Dynamics
5.1. Market Evaluation
5.2. Drivers
5.2.1. Rapidly growing bakery industry
5.3. Restraints
5.3.1. High cost
5.4. Opportunities
5.4.1. Increase in the syrup pastes sector
5.5. Challenges
5.5.1. Growing healthcare concern
1. Global Fillings and Toppings Market Analysis and Forecast, By Type
1.1. Segment Overview
1.2. Fruits
1.3. Starch
1.4. Hydrocolloid
1.5. Sweeteners
1.6. Dairy Ingredients
1.7. Cocoa
1.8. Others
2. Global Fillings and Toppings Market Analysis and Forecast, By Raw Material
2.1. Segment Overview
2.2. Fruits
2.3. Starch
2.4. Hydrocolloid
2.5. Sweeteners
2.6. Dairy Ingredients
2.7. Cocoa
2.8. Others
3. Global Fillings and Toppings Market Analysis and Forecast, By Form
3.1. Segment Overview
3.2. Gel
3.3. Foam
3.4. Solid
3.5. Liquid
4. Global Fillings and Toppings Market Analysis and Forecast, By Regional Analysis
4.1. Segment Overview
4.2. North America
4.2.1. U.S.
4.2.2. Canada
4.2.3. Mexico
4.3. Europe
4.3.1. Germany
4.3.2. France
4.3.3. U.K.
4.3.4. Italy
4.3.5. Spain
4.4. Asia-Pacific
4.4.1. Japan
4.4.2. China
4.4.3. India
4.5. South America
4.5.1. Brazil
4.6. Middle East and Africa
4.6.1. UAE
4.6.2. South Africa
5. Global Fillings and Toppings Market-Competitive Landscape
5.1. Overview
5.2. Market Share of Key Players in Global Fillings and Toppings Market
5.2.1. Global Company Market Share
5.2.2. North America Company Market Share
5.2.3. Europe Company Market Share
5.2.4. APAC Company Market Share
5.3. Competitive Situations and Trends
5.3.1. Product Launches and Developments
5.3.2. Partnerships, Collaborations, and Agreements
5.3.3. Mergers & Acquisitions
5.3.4. Expansions
6. Company Profiles
6.1. Cargill
6.1.1. Business Overview
6.1.2. Company Snapshot
6.1.3. Company Market Share Analysis
6.1.4. Company Product Portfolio
6.1.5. Recent Developments
6.1.6. SWOT Analysis
6.2. Archer Daniels Midland Company
6.2.1. Business Overview
6.2.2. Company Snapshot
6.2.3. Company Market Share Analysis
6.2.4. Company Product Portfolio
6.2.5. Recent Developments
6.2.6. SWOT Analysis
6.3. Barry Callebaut
6.3.1. Business Overview
6.3.2. Company Snapshot
6.3.3. Company Market Share Analysis
6.3.4. Company Product Portfolio
6.3.5. Recent Developments
6.3.6. SWOT Analysis
6.4. Tate & Lyle PLC
6.4.1. Business Overview
6.4.2. Company Snapshot
6.4.3. Company Market Share Analysis
6.4.4. Company Product Portfolio
6.4.5. Recent Developments
6.4.6. SWOT Analysis
6.5. AGRANA
6.5.1. Business Overview
6.5.2. Company Snapshot
6.5.3. Company Market Share Analysis
6.5.4. Company Product Portfolio
6.5.5. Recent Developments
6.5.6. SWOT Analysis
6.6. Associated British Foods plc
6.6.1. Business Overview
6.6.2. Company Snapshot
6.6.3. Company Market Share Analysis
6.6.4. Company Product Portfolio
6.6.5. Recent Developments
6.6.6. SWOT Analysis
6.7. Hanan Products
6.7.1. Business Overview
6.7.2. Company Snapshot
6.7.3. Company Market Share Analysis
6.7.4. Company Product Portfolio
6.7.5. Recent Developments
6.7.6. SWOT Analysis
6.8. Bake'n Joy
6.8.1. Business Overview
6.8.2. Company Snapshot
6.8.3. Company Market Share Analysis
6.8.4. Company Product Portfolio
6.8.5. Recent Developments
6.8.6. SWOT Analysis
6.9. PreGel
6.9.1. Business Overview
6.9.2. Company Snapshot
6.9.3. Company Market Share Analysis
6.9.4. Company Product Portfolio
6.9.5. Recent Developments
6.9.6. SWOT Analysis
List of Table
1. Global Fillings and Toppings Market, By Type, 2019-2030 (USD Billion)
2. Global Fruits, Fillings and Toppings Market, By Region, 2019-2030 (USD Billion)
3. Global Starch, Fillings and Toppings Market, By Region, 2019-2030 (USD Billion)
4. Global Hydrocolloid, Fillings and Toppings Market, By Region, 2019-2030 (USD Billion)
5. Global Sweeteners, Fillings and Toppings Market, By Region, 2019-2030 (USD Billion)
6. Global Dairy Ingredients, Fillings and Toppings Market, By Region, 2019-2030 (USD Billion)
7. Global Cocoa, Fillings and Toppings Market, By Region, 2019-2030 (USD Billion)
8. Global Others, Fillings and Toppings Market, By Region, 2019-2030 (USD Billion)
9. Global Fillings and Toppings Market, By Raw Material, 2019-2030 (USD Billion)
10. Global Fruits, Fillings and Toppings Market, By Region, 2019-2030 (USD Billion)
11. Global Lipopolysaccharides, Fillings and Toppings Market, By Region, 2019-2030 (USD Billion)
12. Global Starch, Fillings and Toppings Market, By Region, 2019-2030 (USD Billion)
13. Global Hydrocolloid, Fillings and Toppings Market, By Region, 2019-2030 (USD Billion)
14. Global Sweeteners, Fillings and Toppings Market, By Region, 2019-2030 (USD Billion)
15. Global Dairy Ingredients, Fillings and Toppings Market, By Region, 2019-2030 (USD Billion)
16. Global Cocoa, Fillings and Toppings Market, By Region, 2019-2030 (USD Billion)
17. Global Others, Fillings and Toppings Market, By Region, 2019-2030 (USD Billion)
18. Global Fillings and Toppings Market, By Form, 2019-2030 (USD Billion)
19. Global Gel, Fillings and Toppings Market, By Region, 2019-2030 (USD Billion)
20. Global Foam, Fillings and Toppings Market, By Region, 2019-2030 (USD Billion)
21. Global Solid, Fillings and Toppings Market, By Region, 2019-2030 (USD Billion)
22. Global Liquid, Fillings and Toppings Market, By Region, 2019-2030 (USD Billion)
23. North America Fillings and Toppings Market, By Type, 2019-2030 (USD Billion)
24. North America Fillings and Toppings Market, By Raw Material, 2019-2030 (USD Billion)
25. North America Fillings and Toppings Market, By Form, 2019-2030 (USD Billion)
26. U.S. Fillings and Toppings Market, By Type, 2019-2030 (USD Billion)
27. U.S. Fillings and Toppings Market, By Raw Material, 2019-2030 (USD Billion)
28. U.S. Fillings and Toppings Market, By Form, 2019-2030 (USD Billion)
29. Canada Fillings and Toppings Market, By Type, 2019-2030 (USD Billion)
30. Canada Fillings and Toppings Market, By Raw Material, 2019-2030 (USD Billion)
31. Canada Fillings and Toppings Market, By Form, 2019-2030 (USD Billion)
32. Mexico Fillings and Toppings Market, By Type, 2019-2030 (USD Billion)
33. Mexico Fillings and Toppings Market, By Raw Material, 2019-2030 (USD Billion)
34. Mexico Fillings and Toppings Market, By Form, 2019-2030 (USD Billion)
35. Europe Fillings and Toppings Market, By Type, 2019-2030 (USD Billion)
36. Europe Fillings and Toppings Market, By Raw Material, 2019-2030 (USD Billion)
37. Europe Fillings and Toppings Market, By Form, 2019-2030 (USD Billion)
38. Germany Fillings and Toppings Market, By Type, 2019-2030 (USD Billion)
39. Germany Fillings and Toppings Market, By Raw Material, 2019-2030 (USD Billion)
40. Germany Fillings and Toppings Market, By Form, 2019-2030 (USD Billion)
41. France Fillings and Toppings Market, By Type, 2019-2030 (USD Billion)
42. France Fillings and Toppings Market, By Raw Material, 2019-2030 (USD Billion)
43. France Fillings and Toppings Market, By Form, 2019-2030 (USD Billion)
44. U.K. Fillings and Toppings Market, By Type, 2019-2030 (USD Billion)
45. U.K. Fillings and Toppings Market, By Raw Material, 2019-2030 (USD Billion)
46. U.K. Fillings and Toppings Market, By Form, 2019-2030 (USD Billion)
47. Italy Fillings and Toppings Market, By Type, 2019-2030 (USD Billion)
48. Italy Fillings and Toppings Market, By Raw Material, 2019-2030 (USD Billion)
49. Italy Fillings and Toppings Market, By Form, 2019-2030 (USD Billion)
50. Spain Fillings and Toppings Market, By Type, 2019-2030 (USD Billion)
51. Spain Fillings and Toppings Market, By Raw Material, 2019-2030 (USD Billion)
52. Spain Fillings and Toppings Market, By Form, 2019-2030 (USD Billion)
53. Asia Pacific Fillings and Toppings Market, By Type, 2019-2030 (USD Billion)
54. Asia Pacific Fillings and Toppings Market, By Raw Material, 2019-2030 (USD Billion)
55. Asia Pacific Fillings and Toppings Market, By Form, 2019-2030 (USD Billion)
56. Japan Fillings and Toppings Market, By Type, 2019-2030 (USD Billion)
57. Japan Fillings and Toppings Market, By Raw Material, 2019-2030 (USD Billion)
58. Japan Fillings and Toppings Market, By Form, 2019-2030 (USD Billion)
59. China Fillings and Toppings Market, By Type, 2019-2030 (USD Billion)
60. China Fillings and Toppings Market, By Raw Material, 2019-2030 (USD Billion)
61. China Fillings and Toppings Market, By Form, 2019-2030 (USD Billion)
62. India Fillings and Toppings Market, By Type, 2019-2030 (USD Billion)
63. India Fillings and Toppings Market, By Raw Material, 2019-2030 (USD Billion)
64. India Fillings and Toppings Market, By Form, 2019-2030 (USD Billion)
65. South America Fillings and Toppings Market, By Type, 2019-2030 (USD Billion)
66. South America Fillings and Toppings Market, By Raw Material, 2019-2030 (USD Billion)
67. South America Fillings and Toppings Market, By Form, 2019-2030 (USD Billion)
68. Brazil Fillings and Toppings Market, By Type, 2019-2030 (USD Billion)
69. Brazil Fillings and Toppings Market, By Raw Material, 2019-2030 (USD Billion)
70. Brazil Fillings and Toppings Market, By Form, 2019-2030 (USD Billion)
71. Middle East and Africa Fillings and Toppings Market, By Type, 2019-2030 (USD Billion)
72. Middle East and Africa Fillings and Toppings Market, By Raw Material, 2019-2030 (USD Billion)
73. Middle East and Africa Fillings and Toppings Market, By Form, 2019-2030 (USD Billion)
74. UAE Fillings and Toppings Market, By Type, 2019-2030 (USD Billion)
75. UAE Fillings and Toppings Market, By Raw Material, 2019-2030 (USD Billion)
76. UAE Fillings and Toppings Market, By Form, 2019-2030 (USD Billion)
77. South Africa Fillings and Toppings Market, By Type, 2019-2030 (USD Billion)
78. South Africa Fillings and Toppings Market, By Raw Material, 2019-2030 (USD Billion)
79. South Africa Fillings and Toppings Market, By Form, 2019-2030 (USD Billion)
List of Figures
1. Global Fillings and Toppings Market Segmentation
2. Global Fillings and Toppings Market: Research Methodology
3. Market Size Estimation Methodology: Bottom-Up Approach
4. Market Size Estimation Methodology: Top-Down Approach
5. Data Triangulation
6. Porter’s Five Forces Analysis
7. Value Chain Analysis
8. Global Fillings and Toppings Market Attractiveness Analysis By Type
9. Global Fillings and Toppings Market Attractiveness Analysis By Raw Material
10. Global Fillings and Toppings Market Attractiveness Analysis By Form
11. Global Fillings and Toppings Market Attractiveness Analysis By Region
12. Global Fillings and Toppings Market: Dynamics
13. Global Fillings and Toppings Market Share By Type (2022 & 2030)
14. Global Fillings and Toppings Market Share By Raw Material (2022 & 2030)
15. Global Fillings and Toppings Market Share By Form (2022 & 2030)
16. Global Fillings and Toppings Market Share By Regions (2022 & 2030)
17. Global Fillings and Toppings Market Share By Company (2021)
This study forecasts global, regional, and country revenue from 2019 to 2030. Brainy Insights has segmented the global fillings and toppings market based on the below-mentioned segments:
Global Fillings and Toppings Market by Type:
Global Fillings and Toppings Market by Raw Material:
Global Fillings and Toppings Market by Form:
Global Fillings and Toppings Market by Region:
Research has its special purpose to undertake marketing efficiently. In this competitive scenario, businesses need information across all industry verticals; the information about customer wants, market demand, competition, industry trends, distribution channels etc. This information needs to be updated regularly because businesses operate in a dynamic environment. Our organization, The Brainy Insights incorporates scientific and systematic research procedures in order to get proper market insights and industry analysis for overall business success. The analysis consists of studying the market from a miniscule level wherein we implement statistical tools which helps us in examining the data with accuracy and precision.
Our research reports feature both; quantitative and qualitative aspects for any market. Qualitative information for any market research process are fundamental because they reveal the customer needs and wants, usage and consumption for any product/service related to a specific industry. This in turn aids the marketers/investors in knowing certain perceptions of the customers. Qualitative research can enlighten about the different product concepts and designs along with unique service offering that in turn, helps define marketing problems and generate opportunities. On the other hand, quantitative research engages with the data collection process through interviews, e-mail interactions, surveys and pilot studies. Quantitative aspects for the market research are useful to validate the hypotheses generated during qualitative research method, explore empirical patterns in the data with the help of statistical tools, and finally make the market estimations.
The Brainy Insights offers comprehensive research and analysis, based on a wide assortment of factual insights gained through interviews with CXOs and global experts and secondary data from reliable sources. Our analysts and industry specialist assume vital roles in building up statistical tools and analysis models, which are used to analyse the data and arrive at accurate insights with exceedingly informative research discoveries. The data provided by our organization have proven precious to a diverse range of companies, facilitating them to address issues such as determining which products/services are the most appealing, whether or not customers use the product in the manner anticipated, the purchasing intentions of the market and many others.
Our research methodology encompasses an idyllic combination of primary and secondary initiatives. Key phases involved in this process are listed below:

The phase involves the gathering and collecting of market data and its related information with the help of different sources & research procedures.

The data procurement stage involves in data gathering and collecting through various data sources.
This stage involves in extensive research. These data sources includes:
Purchased Database: Purchased databases play a crucial role in estimating the market sizes irrespective of the domain. Our purchased database includes:
Primary Research: The Brainy Insights interacts with leading companies and experts of the concerned domain to develop the analyst team’s market understanding and expertise. It improves and substantiates every single data presented in the market reports. Primary research mainly involves in telephonic interviews, E-mail interactions and face-to-face interviews with the raw material providers, manufacturers/producers, distributors, & independent consultants. The interviews that we conduct provides valuable data on market size and industry growth trends prevailing in the market. Our organization also conducts surveys with the various industry experts in order to gain overall insights of the industry/market. For instance, in healthcare industry we conduct surveys with the pharmacists, doctors, surgeons and nurses in order to gain insights and key information of a medical product/device/equipment which the customers are going to usage. Surveys are conducted in the form of questionnaire designed by our own analyst team. Surveys plays an important role in primary research because surveys helps us to identify the key target audiences of the market. Additionally, surveys helps to identify the key target audience engaged with the market. Our survey team conducts the survey by targeting the key audience, thus gaining insights from them. Based on the perspectives of the customers, this information is utilized to formulate market strategies. Moreover, market surveys helps us to understand the current competitive situation of the industry. To be precise, our survey process typically involve with the 360 analysis of the market. This analytical process begins by identifying the prospective customers for a product or service related to the market/industry to obtain data on how a product/service could fit into customers’ lives.

Secondary Research: The secondary data sources includes information published by the on-profit organizations such as World bank, WHO, company fillings, investor presentations, annual reports, national government documents, statistical databases, blogs, articles, white papers and others. From the annual report, we analyse a company’s revenue to understand the key segment and market share of that organization in a particular region. We analyse the company websites and adopt the product mapping technique which is important for deriving the segment revenue. In the product mapping method, we select and categorize the products offered by the companies catering to domain specific market, deduce the product revenue for each of the companies so as to get overall estimation of the market size. We also source data and analyses trends based on information received from supply side and demand side intermediaries in the value chain. The supply side denotes the data gathered from supplier, distributor, wholesaler and the demand side illustrates the data gathered from the end customers for respective market domain.

The supply side for a domain specific market is analysed by:
The demand side for the market is estimated through:
In-house Library: Apart from these third-party sources, we have our in-house library of qualitative and quantitative information. Our in-house database includes market data for various industry and domains. These data are updated on regular basis as per the changing market scenario. Our library includes, historic databases, internal audit reports and archives.
Sometimes there are instances where there is no metadata or raw data available for any domain specific market. For those cases, we use our expertise to forecast and estimate the market size in order to generate comprehensive data sets. Our analyst team adopt a robust research technique in order to produce the estimates:
Data Synthesis: This stage involves the analysis & mapping of all the information obtained from the previous step. It also involves in scrutinizing the data for any discrepancy observed while data gathering related to the market. The data is collected with consideration to the heterogeneity of sources. Robust scientific techniques are in place for synthesizing disparate data sets and provide the essential contextual information that can orient market strategies. The Brainy Insights has extensive experience in data synthesis where the data passes through various stages:


Market Deduction & Formulation: The final stage comprises of assigning data points at appropriate market spaces so as to deduce feasible conclusions. Analyst perspective & subject matter expert based holistic form of market sizing coupled with industry analysis also plays a crucial role in this stage.
This stage involves in finalization of the market size and numbers that we have collected from data integration step. With data interpolation, it is made sure that there is no gap in the market data. Successful trend analysis is done by our analysts using extrapolation techniques, which provide the best possible forecasts for the market.
Data Validation & Market Feedback: Validation is the most important step in the process. Validation & re-validation via an intricately designed process helps us finalize data-points to be used for final calculations.

The Brainy Insights interacts with leading companies and experts of the concerned domain to develop the analyst team’s market understanding and expertise. It improves and substantiates every single data presented in the market reports. The data validation interview and discussion panels are typically composed of the most experienced industry members. The participants include, however, are not limited to:
Moreover, we always validate our data and findings through primary respondents from all the major regions we are working on.


Free Customization
Fortune 500 Clients
Free Yearly Update On Purchase Of Multi/Corporate License
Companies Served Till Date