- +1-315-215-1633
- sales@thebrainyinsights.com

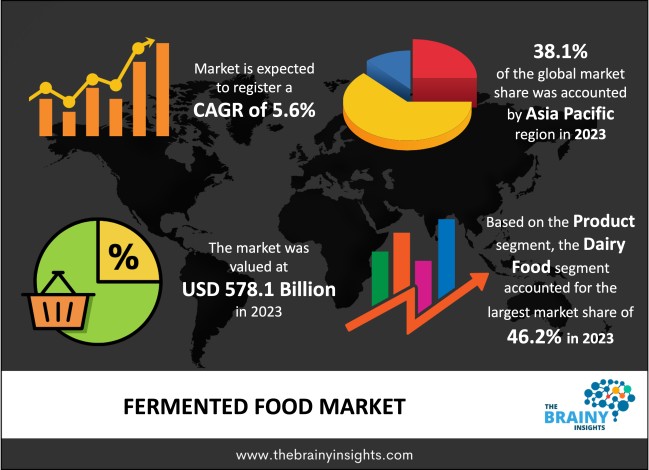
The Fermented Food Market was valued at USD 578.1 billion in 2023 and grew at a CAGR of 5.6% from 2024 to 2033. Foods that have undergone fermentation have been purposefully allowed to undergo a specific microbial development process, usually involving the growth of yeasts, bacteria, or molds. This process, known as fermentation, changes sucrose and other carbs into acids, carbon dioxide, alcohol, and other chemicals. Fermented foods have become more popular due to their specific health benefits. Consuming fermented foods lowers the chance of developing chronic illnesses such as type 2 diabetes, heart disease, and stroke. The reasons propelling the growth of the fermented food market are the exploration of cultural and gastronomic trends and the increasing concerns about the environment.
The market for fermented foods has grown significantly in recent years, drawing attention from consumers drawn to its distinctive flavors, health advantages, and sustainability. Microorganisms such as bacteria, yeast, and molds change food substrates during fermentation, an ancient food preservation method. This procedure improves the nutritional value, taste, and digestibility of food in addition to extending its shelf life. Fermented foods are becoming more and more popular as people place a higher priority on their health and wellness because they include probiotics, which are good for the gut and overall wellbeing.
Get an overview of this study by requesting a free sample
Foods that have undergone fermentation are abundant in probiotics and other good bacteria that promote gut health and general wellbeing. Foods high in probiotics are becoming more and more popular as people become more health conscious in an effort to preserve gut health and strengthen immunity. Additionally, a wide variety of goods are available in the fermented food industry, such as sourdough bread, yogurt, kefir, kimchi, sauerkraut, kombucha, tempeh, and miso. This range satisfies a range of dietary requirements and cultural preferences, stimulating consumer demand and market expansion.
There may not be as much demand for fermented foods because many customers may not completely comprehend their nutritional worth and health benefits. Overcoming this constraint requires educating customers about the benefits of fermentation and probiotics in fostering gut health. Furthermore, a lot of fermented meals have strong, acidic flavors that not everyone will enjoy, especially for people who are not familiar with fermented ingredients. Innovative product positioning and marketing are necessary to overcome shifting perceptions and taste preferences.
Look for ways to launch cutting-edge fermented food products that satisfy particular dietary requirements, such as low-sodium, gluten-free, and vegan options. Offering a wider range of products can appeal to more customers and promote market expansion. Additionally, create fermented foods that have functional ingredients added, such probiotics, prebiotics, antioxidants, and vitamins, to boost their nutritional content and attract consumers who are health-conscious and looking for benefits beyond just basic nourishment.
Asia Pacific led the market in 2023 with the largest market share of 38.1%. Foods that have undergone fermentation hold profound cultural importance in numerous nations located in the Asia-Pacific area. Local diets and culinary traditions depend heavily on traditional fermented foods like kimchi in Korea, miso and natto in Japan, tempeh and kecap manis in Indonesia, and kimchi in South Korea. Additionally, consumers are becoming more interested in fermented foods due to their probiotic content and related health advantages as wellness and health become more important. In order to maintain healthy digestion and general wellbeing, consumers in the Asia Pacific area are becoming more interested in consuming fermented foods as part of a balanced diet.
Asia Pacific Region Fermented Food Market Share in 2023 - 38.1%
www.thebrainyinsights.com
Check the geographical analysis of this market by requesting a free sample
The Dairy Food segment dominated the global market in 2023 with a market share of 46.2%. Lactic acid bacteria are used to ferment pasteurized milk to create cultured buttermilk, a dairy product. It is frequently used in baking, and cooking, and as a foundation for marinades and salad dressings because of its tart flavor. Additionally, lactic acid bacteria are used to ferment milk to create popular traditional beverages like ayran in the Middle East and lassi in South Asia. These pleasant beverages are frequently enjoyed as dinner accompaniments.
The offline segment dominated the global market in 2023 with a market share of 63.2%. Supermarkets and hypermarkets are important retail outlets for fermented food items, providing customers with an extensive range of brands and types. When buying fermented foods and other groceries, customers can shop conveniently and in one place at these large-format stores. Specialty food stores, such as gourmet shops, artisanal food stores, and ethnic grocery stores, serve customers looking for unique, hard-to-find fermented food products that are of superior quality. Food enthusiasts and connoisseurs of fine cuisine will find a carefully chosen assortment of artisanal and premium fermented foods in these outlets.
| Attribute | Description |
|---|---|
| Market Size | Revenue (USD Billion) |
| Market size value in 2023 | USD 578.1 Billion |
| Market size value in 2033 | USD 996.8 Billion |
| CAGR (2024 to 2033) | 5.6% |
| Historical data | 2020-2022 |
| Base Year | 2023 |
| Forecast | 2024-2033 |
| Region | The regions analyzed for the market are Asia Pacific, Europe, South America, North America, and Middle East & Africa. Furthermore, the regions are further analyzed at the country level. |
| Segments | Product, Distribution Channel |
As per The Brainy Insights, the size of the fermented food market was valued at USD 578.1 billion in 2023 to USD 996.8 billion by 2033.
The global fermented food market is growing at a CAGR of 5.6% during the forecast period 2024-2033.
The Asia Pacific region emerged as the largest market for the fermented food.
The growing awareness of health benefits will influence the market's growth.
1. Introduction
1.1. Objectives of the Study
1.2. Market Definition
1.3. Research Scope
1.4. Currency
1.5. Key Target Audience
2. Research Methodology and Assumptions
3. Executive Summary
4. Premium Insights
4.1. Porter’s Five Forces Analysis
4.2. Value Chain Analysis
4.3. Top Investment Pockets
4.3.1. Market Attractiveness Analysis by Product
4.3.2. Market Attractiveness Analysis by Distribution Channel
4.3.3. Market Attractiveness Analysis by Region
4.4. Industry Trends
5. Market Dynamics
5.1. Market Evaluation
5.2. Drivers
5.2.1. Growing Awareness of Health Benefits
5.3. Restraints
5.3.1. Limited Awareness and Education
5.4. Opportunities
5.4.1. The growth of e-commerce platforms
5.5. Challenges
5.5.1. Quality Control and Consistency
6. Global Fermented Food Market Analysis and Forecast, By Product
6.1. Segment Overview
6.2. Dairy Food
6.3. Beverages
6.4. Others
7. Global Fermented Food Market Analysis and Forecast, By Distribution Channel
7.1. Segment Overview
7.2. Offline
7.3. Online
8. Global Fermented Food Market Analysis and Forecast, By Regional Analysis
8.1. Segment Overview
8.2. North America
8.2.1. U.S.
8.2.2. Canada
8.2.3. Mexico
8.3. Europe
8.3.1. Germany
8.3.2. France
8.3.3. U.K.
8.3.4. Italy
8.3.5. Spain
8.4. Asia-Pacific
8.4.1. Japan
8.4.2. China
8.4.3. India
8.5. South America
8.5.1. Brazil
8.6. Middle East and Africa
8.6.1. UAE
8.6.2. South Africa
9. Global Fermented Food Market-Competitive Landscape
9.1. Overview
9.2. Market Share of Key Players in the Fermented Food Market
9.2.1. Global Company Market Share
9.2.2. North America Company Market Share
9.2.3. Europe Company Market Share
9.2.4. APAC Company Market Share
9.3. Competitive Situations and Trends
9.3.1. Product Launches and Developments
9.3.2. Partnerships, Collaborations, and Agreements
9.3.3. Mergers & Acquisitions
9.3.4. Expansions
10. Company Profiles
10.1. Nestlé
10.1.1. Business Overview
10.1.2. Company Snapshot
10.1.3. Company Market Share Analysis
10.1.4. Company Product Portfolio
10.1.5. Recent Developments
10.1.6. SWOT Analysis
10.2. Danone
10.2.1. Business Overview
10.2.2. Company Snapshot
10.2.3. Company Market Share Analysis
10.2.4. Company Product Portfolio
10.2.5. Recent Developments
10.2.6. SWOT Analysis
10.3. The Coca-Cola Company
10.3.1. Business Overview
10.3.2. Company Snapshot
10.3.3. Company Market Share Analysis
10.3.4. Company Product Portfolio
10.3.5. Recent Developments
10.3.6. SWOT Analysis
10.4. PepsiCo
10.4.1. Business Overview
10.4.2. Company Snapshot
10.4.3. Company Market Share Analysis
10.4.4. Company Product Portfolio
10.4.5. Recent Developments
10.4.6. SWOT Analysis
10.5. Anheuser-Busch InBev
10.5.1. Business Overview
10.5.2. Company Snapshot
10.5.3. Company Market Share Analysis
10.5.4. Company Product Portfolio
10.5.5. Recent Developments
10.5.6. SWOT Analysis
10.6. Heineken
10.6.1. Business Overview
10.6.2. Company Snapshot
10.6.3. Company Market Share Analysis
10.6.4. Company Product Portfolio
10.6.5. Recent Developments
10.6.6. SWOT Analysis
10.7. Mondelez International
10.7.1. Business Overview
10.7.2. Company Snapshot
10.7.3. Company Market Share Analysis
10.7.4. Company Product Portfolio
10.7.5. Recent Developments
10.7.6. SWOT Analysis
10.8. Kraft Heinz
10.8.1. Business Overview
10.8.2. Company Snapshot
10.8.3. Company Market Share Analysis
10.8.4. Company Product Portfolio
10.8.5. Recent Developments
10.8.6. SWOT Analysis
10.9. Unilever
10.9.1. Business Overview
10.9.2. Company Snapshot
10.9.3. Company Market Share Analysis
10.9.4. Company Product Portfolio
10.9.5. Recent Developments
10.9.6. SWOT Analysis
10.10. Fonterra Co-operative Group
10.10.1. Business Overview
10.10.2. Company Snapshot
10.10.3. Company Market Share Analysis
10.10.4. Company Product Portfolio
10.10.5. Recent Developments
10.10.6. SWOT Analysis
List of Table
1. Global Fermented Food Market, By Product, 2020-2033 (USD Billion)
2. Global Dairy Food Fermented Food Market, By Region, 2020-2033 (USD Billion)
3. Global Beverages Fermented Food Market, By Region, 2020-2033 (USD Billion)
4. Global Others Fermented Food Market, By Region, 2020-2033 (USD Billion)
5. Global Fermented Food Market, By Distribution Channel, 2020-2033 (USD Billion)
6. Global Offline Fermented Food Market, By Region, 2020-2033 (USD Billion)
7. Global Online Fermented Food Market, By Region, 2020-2033 (USD Billion)
8. Global Fermented Food Market, By Region, 2020-2033 (USD Billion)
9. North America Fermented Food Market, By Product, 2020-2033 (USD Billion)
10. North America Fermented Food Market, By Distribution Channel, 2020-2033 (USD Billion)
11. U.S. Fermented Food Market, By Product, 2020-2033 (USD Billion)
12. U.S. Fermented Food Market, By Distribution Channel, 2020-2033 (USD Billion)
13. Canada Fermented Food Market, By Product, 2020-2033 (USD Billion)
14. Canada Fermented Food Market, By Distribution Channel, 2020-2033 (USD Billion)
15. Mexico Fermented Food Market, By Product, 2020-2033 (USD Billion)
16. Mexico Fermented Food Market, By Distribution Channel, 2020-2033 (USD Billion)
17. Europe Fermented Food Market, By Product, 2020-2033 (USD Billion)
18. Europe Fermented Food Market, By Distribution Channel, 2020-2033 (USD Billion)
19. Germany Fermented Food Market, By Product, 2020-2033 (USD Billion)
20. Germany Fermented Food Market, By Distribution Channel, 2020-2033 (USD Billion)
21. France Fermented Food Market, By Product, 2020-2033 (USD Billion)
22. France Fermented Food Market, By Distribution Channel, 2020-2033 (USD Billion)
23. U.K. Fermented Food Market, By Product, 2020-2033 (USD Billion)
24. U.K. Fermented Food Market, By Distribution Channel, 2020-2033 (USD Billion)
25. Italy Fermented Food Market, By Product, 2020-2033 (USD Billion)
26. Italy Fermented Food Market, By Distribution Channel, 2020-2033 (USD Billion)
27. Spain Fermented Food Market, By Product, 2020-2033 (USD Billion)
28. Spain Fermented Food Market, By Distribution Channel, 2020-2033 (USD Billion)
29. Asia Pacific Fermented Food Market, By Product, 2020-2033 (USD Billion)
30. Asia Pacific Fermented Food Market, By Distribution Channel, 2020-2033 (USD Billion)
31. Japan Fermented Food Market, By Product, 2020-2033 (USD Billion)
32. Japan Fermented Food Market, By Distribution Channel, 2020-2033 (USD Billion)
33. China Fermented Food Market, By Product, 2020-2033 (USD Billion)
34. China Fermented Food Market, By Distribution Channel, 2020-2033 (USD Billion)
35. India Fermented Food Market, By Product, 2020-2033 (USD Billion)
36. India Fermented Food Market, By Distribution Channel, 2020-2033 (USD Billion)
37. South America Fermented Food Market, By Product, 2020-2033 (USD Billion)
38. South America Fermented Food Market, By Distribution Channel, 2020-2033 (USD Billion)
39. Brazil Fermented Food Market, By Product, 2020-2033 (USD Billion)
40. Brazil Fermented Food Market, By Distribution Channel, 2020-2033 (USD Billion)
41. Middle East and Africa Fermented Food Market, By Product, 2020-2033 (USD Billion)
42. Middle East and Africa Fermented Food Market, By Distribution Channel, 2020-2033 (USD Billion)
43. UAE Fermented Food Market, By Product, 2020-2033 (USD Billion)
44. UAE Fermented Food Market, By Distribution Channel, 2020-2033 (USD Billion)
45. South Africa Fermented Food Market, By Product, 2020-2033 (USD Billion)
46. South Africa Fermented Food Market, By Distribution Channel, 2020-2033 (USD Billion)
List of Figures
1. Global Fermented Food Market Segmentation
2. Fermented Food Market: Research Methodology
3. Market Size Estimation Methodology: Bottom-Up Approach
4. Market Size Estimation Methodology: Top-Down Approach
5. Data Triangulation
6. Porter’s Five Forces Analysis
7. Value Chain Analysis
8. Global Fermented Food Market Attractiveness Analysis by Product
9. Global Fermented Food Market Attractiveness Analysis by Distribution Channel
10. Global Fermented Food Market Attractiveness Analysis by Region
11. Global Fermented Food Market: Dynamics
12. Global Fermented Food Market Share by Product (2023 & 2033)
13. Global Fermented Food Market Share by Distribution Channel (2023 & 2033)
14. Global Fermented Food Market Share by Regions (2023 & 2033)
15. Global Fermented Food Market Share by Company (2023)
This study forecasts revenue at global, regional, and country levels from 2020 to 2033. The Brainy Insights has segmented the global fermented food market based on below-mentioned segments:
Global Fermented Food Market by Product:
Global Fermented Food Market by Distribution Channel:
Global Fermented Food Market by Region:
Research has its special purpose to undertake marketing efficiently. In this competitive scenario, businesses need information across all industry verticals; the information about customer wants, market demand, competition, industry trends, distribution channels etc. This information needs to be updated regularly because businesses operate in a dynamic environment. Our organization, The Brainy Insights incorporates scientific and systematic research procedures in order to get proper market insights and industry analysis for overall business success. The analysis consists of studying the market from a miniscule level wherein we implement statistical tools which helps us in examining the data with accuracy and precision.
Our research reports feature both; quantitative and qualitative aspects for any market. Qualitative information for any market research process are fundamental because they reveal the customer needs and wants, usage and consumption for any product/service related to a specific industry. This in turn aids the marketers/investors in knowing certain perceptions of the customers. Qualitative research can enlighten about the different product concepts and designs along with unique service offering that in turn, helps define marketing problems and generate opportunities. On the other hand, quantitative research engages with the data collection process through interviews, e-mail interactions, surveys and pilot studies. Quantitative aspects for the market research are useful to validate the hypotheses generated during qualitative research method, explore empirical patterns in the data with the help of statistical tools, and finally make the market estimations.
The Brainy Insights offers comprehensive research and analysis, based on a wide assortment of factual insights gained through interviews with CXOs and global experts and secondary data from reliable sources. Our analysts and industry specialist assume vital roles in building up statistical tools and analysis models, which are used to analyse the data and arrive at accurate insights with exceedingly informative research discoveries. The data provided by our organization have proven precious to a diverse range of companies, facilitating them to address issues such as determining which products/services are the most appealing, whether or not customers use the product in the manner anticipated, the purchasing intentions of the market and many others.
Our research methodology encompasses an idyllic combination of primary and secondary initiatives. Key phases involved in this process are listed below:

The phase involves the gathering and collecting of market data and its related information with the help of different sources & research procedures.

The data procurement stage involves in data gathering and collecting through various data sources.
This stage involves in extensive research. These data sources includes:
Purchased Database: Purchased databases play a crucial role in estimating the market sizes irrespective of the domain. Our purchased database includes:
Primary Research: The Brainy Insights interacts with leading companies and experts of the concerned domain to develop the analyst team’s market understanding and expertise. It improves and substantiates every single data presented in the market reports. Primary research mainly involves in telephonic interviews, E-mail interactions and face-to-face interviews with the raw material providers, manufacturers/producers, distributors, & independent consultants. The interviews that we conduct provides valuable data on market size and industry growth trends prevailing in the market. Our organization also conducts surveys with the various industry experts in order to gain overall insights of the industry/market. For instance, in healthcare industry we conduct surveys with the pharmacists, doctors, surgeons and nurses in order to gain insights and key information of a medical product/device/equipment which the customers are going to usage. Surveys are conducted in the form of questionnaire designed by our own analyst team. Surveys plays an important role in primary research because surveys helps us to identify the key target audiences of the market. Additionally, surveys helps to identify the key target audience engaged with the market. Our survey team conducts the survey by targeting the key audience, thus gaining insights from them. Based on the perspectives of the customers, this information is utilized to formulate market strategies. Moreover, market surveys helps us to understand the current competitive situation of the industry. To be precise, our survey process typically involve with the 360 analysis of the market. This analytical process begins by identifying the prospective customers for a product or service related to the market/industry to obtain data on how a product/service could fit into customers’ lives.

Secondary Research: The secondary data sources includes information published by the on-profit organizations such as World bank, WHO, company fillings, investor presentations, annual reports, national government documents, statistical databases, blogs, articles, white papers and others. From the annual report, we analyse a company’s revenue to understand the key segment and market share of that organization in a particular region. We analyse the company websites and adopt the product mapping technique which is important for deriving the segment revenue. In the product mapping method, we select and categorize the products offered by the companies catering to domain specific market, deduce the product revenue for each of the companies so as to get overall estimation of the market size. We also source data and analyses trends based on information received from supply side and demand side intermediaries in the value chain. The supply side denotes the data gathered from supplier, distributor, wholesaler and the demand side illustrates the data gathered from the end customers for respective market domain.

The supply side for a domain specific market is analysed by:
The demand side for the market is estimated through:
In-house Library: Apart from these third-party sources, we have our in-house library of qualitative and quantitative information. Our in-house database includes market data for various industry and domains. These data are updated on regular basis as per the changing market scenario. Our library includes, historic databases, internal audit reports and archives.
Sometimes there are instances where there is no metadata or raw data available for any domain specific market. For those cases, we use our expertise to forecast and estimate the market size in order to generate comprehensive data sets. Our analyst team adopt a robust research technique in order to produce the estimates:
Data Synthesis: This stage involves the analysis & mapping of all the information obtained from the previous step. It also involves in scrutinizing the data for any discrepancy observed while data gathering related to the market. The data is collected with consideration to the heterogeneity of sources. Robust scientific techniques are in place for synthesizing disparate data sets and provide the essential contextual information that can orient market strategies. The Brainy Insights has extensive experience in data synthesis where the data passes through various stages:


Market Deduction & Formulation: The final stage comprises of assigning data points at appropriate market spaces so as to deduce feasible conclusions. Analyst perspective & subject matter expert based holistic form of market sizing coupled with industry analysis also plays a crucial role in this stage.
This stage involves in finalization of the market size and numbers that we have collected from data integration step. With data interpolation, it is made sure that there is no gap in the market data. Successful trend analysis is done by our analysts using extrapolation techniques, which provide the best possible forecasts for the market.
Data Validation & Market Feedback: Validation is the most important step in the process. Validation & re-validation via an intricately designed process helps us finalize data-points to be used for final calculations.

The Brainy Insights interacts with leading companies and experts of the concerned domain to develop the analyst team’s market understanding and expertise. It improves and substantiates every single data presented in the market reports. The data validation interview and discussion panels are typically composed of the most experienced industry members. The participants include, however, are not limited to:
Moreover, we always validate our data and findings through primary respondents from all the major regions we are working on.


Free Customization
Fortune 500 Clients
Free Yearly Update On Purchase Of Multi/Corporate License
Companies Served Till Date