- +1-315-215-1633
- sales@thebrainyinsights.com

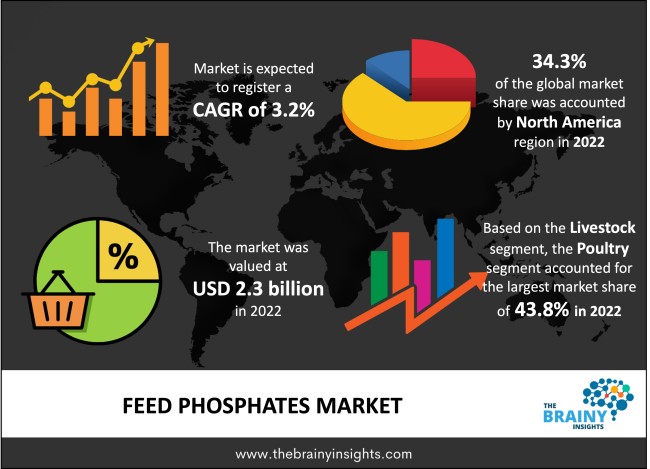
The global feed phosphates market was valued at USD 2.3 billion in 2022 and grew at a CAGR of 3.2% from 2023 to 2032. The market is expected to reach USD 3.2 billion by 2032. Aquatic life and animals, including chickens, pigs, and cows, all consume phosphate-rich feed. They support more rapid animal growth in terms of weight gain and other aspects. Feed phosphates increase the feed’s nutritional content, raising the standard of dairy and meat products. Increased meat softness, high selenium content in the eggs, and high calcium content in milk are a few examples of consumer-driven beneficial changes to animal products caused by the addition of feed phosphates. Dicalcium phosphate (DCP) and monocalcium phosphate (MCP) are the two feed phosphate types with the biggest market shares. Additional feed phosphate variations include mono-dicalcium phosphate, tricalcium phosphate, and defluorinated phosphate.
The industry that creates, distributes, and sells phosphate compounds used in animal feed is referred to as "feed phosphate." Phosphates are important minerals that are required for animal growth, development, and overall wellness. They are frequently included in animal feed to maintain sufficient phosphorus levels, which are important for bone development, energy metabolism, and several physiological activities. The market for feed phosphate is anticipated to keep expanding as consumer demand for animal protein and attention to animal nutrition and health increase.
Get an overview of this study by requesting a free sample
The market for feed phosphates is significantly influenced by the growth of the livestock sector, particularly in emerging nations. Increased consumption of meat and dairy products in these areas is a result of rising disposable incomes, urbanization, and shifting dietary habits, which increases the need for feed phosphates. Additionally, as the world's population expands, so does the need for animal proteins like meat, milk, and eggs. Due to this demand, more animals must be produced, which raises the need for feed phosphates to meet the dietary requirements of livestock, which will help the market grow.
Feed phosphates are produced from a variety of sources, such as rock phosphate and bone meal as well. The availability and pricing of certain raw resources might fluctuate because of variables such as mining limitations, geopolitical concerns, and shipping costs. Raw material scarcity or rising costs might influence the cost and availability of feed phosphates.
There is a potential for developing and commercializing specialty feed phosphate additions with a rising focus on animal health, efficiency, and specific nutritional requirements. These supplements can target certain animal species, production phases, or health issues, providing customized nutritional solutions to satisfy the livestock industry's changing demands.
The North American region led the feed phosphates market in 2022 with a market share of 34.3%. The enormous livestock sector and strong demand for meat, dairy, and poultry products make North America a significant market for feed phosphates. The market has been continuously increasing, and it is expected to keep growing as animal protein consumption rises and the requirement for optimal animal nutrition grows.
North America Region Feed Phosphates Market Share in 2022 - 34.3%
www.thebrainyinsights.com
Check the geographical analysis of this market by requesting a free sample
The dicalcium segment is likely to dominate the global market, with the highest CAGR of 5.1% over the forecast period. The feed phosphates market has a sizable portion dedicated to dicalcium phosphate. A form of feed phosphate called dicalcium phosphate is made from several materials, including phosphate from rocks and bone meal. The market for feed phosphates is dominated by the dicalcium phosphate sector. Its high phosphorus concentration and strong absorption make it a common ingredient in animal feed formulas. The requirement for phosphorus supplementation in animal diets and the rising demand for animal protein have both contributed to the dicalcium phosphate market's fast growth.
Throughout the projected period, the powder category is expected to grow at the highest CAGR of 4.8% over the forecast period. Due to the ease of handling and convenience of availability, the powder segment dominates the market. Animal food makes extensive use of feed phosphate in powder form because it enhances flowability and end product. Therefore, throughout the anticipated period, these factors are expected to promote growth in the market for feed phosphate.
The poultry segment dominated the global market in 2022 with a market share of 43.8%. The growing demand for meat that is processed and diets that contain protein is expected to lead to a rise in the demand for animal feed. As a result of this factor, many chicken farms will require more feed phosphates. Therefore, throughout the projected period, all of these factors are anticipated to boost the expansion of the feed phosphate market through the poultry segment.
| Attribute | Description |
|---|---|
| Market Size | Revenue (USD Billion) |
| Market size value in 2022 | USD 2.3 Billion |
| Market size value in 2032 | USD 3.2 Billion |
| CAGR (2023 to 2032) | 3.2% |
| Historical data | 2019-2021 |
| Base Year | 2022 |
| Forecast | 2023-2032 |
| Regional Segments | The regions analyzed for the market are Asia Pacific, Europe, South America, North America, and Middle East & Africa. Furthermore, the regions are further analyzed at the country level. |
| Segments | Type, Form, Livestock |
As per The Brainy Insights, the size of the feed phosphates market was valued at USD 2.3 billion in 2022 to USD 3.2 billion by 2032.
The global feed phosphates market is growing at a CAGR of 3.2% during the forecast period 2023-2032.
The North American region emerged as the largest market for the feed phosphates.
Rise in demand from livestock sector will influence the market's growth.
1. Introduction
1.1. Objectives of the Study
1.2. Market Definition
1.3. Research Scope
1.4. Currency
1.5. Key Target Audience
2. Research Methodology and Assumptions
3. Executive Summary
4. Premium Insights
4.1. Porter’s Five Forces Analysis
4.2. Value Chain Analysis
4.3. Top Investment Pockets
4.3.1. Market Attractiveness Analysis by Type
4.3.2. Market Attractiveness Analysis by Form
4.3.3. Market Attractiveness Analysis by Livestock
4.3.4. Market Attractiveness Analysis by Region
4.4. Industry Trends
5. Market Dynamics
5.1. Market Evaluation
5.2. Drivers
5.2.1. Rise in demand from livestock sector
5.3. Restraints
5.3.1. Fluctuations in raw material prices
5.4. Opportunities
5.4.1. Rise in demand from developing countries
6. Global Feed Phosphates Market Analysis and Forecast, By Type
6.1. Segment Overview
6.2. Tricalcium
6.3. Defluorinated
6.4. Mono-dicalcium
6.5. Monocalcium
6.6. Dicalcium
7. Global Feed Phosphates Market Analysis and Forecast, By Form
7.1. Segment Overview
7.2. Powder
7.3. Granule
8. Global Feed Phosphates Market Analysis and Forecast, By Livestock
8.1. Segment Overview
8.2. Aquaculture
8.3. Poultry
8.4. Swine
8.5. Ruminants
9. Global Feed Phosphates Market Analysis and Forecast, By Regional Analysis
9.1. Segment Overview
9.2. North America
9.2.1. U.S.
9.2.2. Canada
9.2.3. Mexico
9.3. Europe
9.3.1. Germany
9.3.2. France
9.3.3. U.K.
9.3.4. Italy
9.3.5. Spain
9.4. Asia-Pacific
9.4.1. Japan
9.4.2. China
9.4.3. India
9.5. South America
9.5.1. Brazil
9.6. Middle East and Africa
9.6.1. UAE
9.6.2. South Africa
10. Global Feed Phosphates Market-Competitive Landscape
10.1. Overview
10.2. Market Share of Key Players in the Feed Phosphates Market
10.2.1. Global Company Market Share
10.2.2. North America Company Market Share
10.2.3. Europe Company Market Share
10.2.4. APAC Company Market Share
10.3. Competitive Situations and Trends
10.3.1. Product Launches and Developments
10.3.2. Partnerships, Collaborations, and Agreements
10.3.3. Mergers & Acquisitions
10.3.4. Expansions
11. Company Profiles
11.1. The Mosiac Company
11.1.1. Business Overview
11.1.2. Company Snapshot
11.1.3. Company Market Share Analysis
11.1.4. Company Product Portfolio
11.1.5. Recent Developments
11.1.6. SWOT Analysis
11.2. PhosAgro
11.2.1. Business Overview
11.2.2. Company Snapshot
11.2.3. Company Market Share Analysis
11.2.4. Company Product Portfolio
11.2.5. Recent Developments
11.2.6. SWOT Analysis
11.3. EuroChem Group
11.3.1. Business Overview
11.3.2. Company Snapshot
11.3.3. Company Market Share Analysis
11.3.4. Company Product Portfolio
11.3.5. Recent Developments
11.3.6. SWOT Analysis
11.4. Nutrien Ltd
11.4.1. Business Overview
11.4.2. Company Snapshot
11.4.3. Company Market Share Analysis
11.4.4. Company Product Portfolio
11.4.5. Recent Developments
11.4.6. SWOT Analysis
11.5. Rotem
11.5.1. Business Overview
11.5.2. Company Snapshot
11.5.3. Company Market Share Analysis
11.5.4. Company Product Portfolio
11.5.5. Recent Developments
11.5.6. SWOT Analysis
11.6. AB LIFOSA
11.6.1. Business Overview
11.6.2. Company Snapshot
11.6.3. Company Market Share Analysis
11.6.4. Company Product Portfolio
11.6.5. Recent Developments
11.6.6. SWOT Analysis
11.7. Reanjoy Laboratories
11.7.1. Business Overview
11.7.2. Company Snapshot
11.7.3. Company Market Share Analysis
11.7.4. Company Product Portfolio
11.7.5. Recent Developments
11.7.6. SWOT Analysis
11.8. Yara International ASA
11.8.1. Business Overview
11.8.2. Company Snapshot
11.8.3. Company Market Share Analysis
11.8.4. Company Product Portfolio
11.8.5. Recent Developments
11.8.6. SWOT Analysis
11.9. Fosfitalia Group
11.9.1. Business Overview
11.9.2. Company Snapshot
11.9.3. Company Market Share Analysis
11.9.4. Company Product Portfolio
11.9.5. Recent Developments
11.9.6. SWOT Analysis
11.10. OCP Group
11.10.1. Business Overview
11.10.2. Company Snapshot
11.10.3. Company Market Share Analysis
11.10.4. Company Product Portfolio
11.10.5. Recent Developments
11.10.6. SWOT Analysis
List of Table
1. Global Feed Phosphates Market, By Type, 2019-2032 (USD Billion)
2. Global Tricalcium, Feed Phosphates Market, By Region, 2019-2032 (USD Billion)
3. Global Defluorinated, Feed Phosphates Market, By Region, 2019-2032 (USD Billion)
4. Global Mono-dicalcium, Feed Phosphates Market, By Region, 2019-2032 (USD Billion)
5. Global Monocalcium, Feed Phosphates Market, By Region, 2019-2032 (USD Billion)
6. Global Dicalcium, Feed Phosphates Market, By Region, 2019-2032 (USD Billion)
7. Global Feed Phosphates Market, By Form, 2019-2032 (USD Billion)
8. Global Powder, Feed Phosphates Market, By Region, 2019-2032 (USD Billion)
9. Global Granule, Feed Phosphates Market, By Region, 2019-2032 (USD Billion)
10. Global Feed Phosphates Market, By Livestock, 2019-2032 (USD Billion)
11. Global Aquaculture, Feed Phosphates Market, By Region, 2019-2032 (USD Billion)
12. Global Poultry, Feed Phosphates Market, By Region, 2019-2032 (USD Billion)
13. Global Swine, Feed Phosphates Market, By Region, 2019-2032 (USD Billion)
14. Global Ruminants, Feed Phosphates Market, By Region, 2019-2032 (USD Billion)
15. Global Feed Phosphates Market, By Region, 2019-2032 (USD Billion)
16. North America Feed Phosphates Market, By Type, 2019-2032 (USD Billion)
17. North America Feed Phosphates Market, By Form, 2019-2032 (USD Billion)
18. North America Feed Phosphates Market, By Livestock, 2019-2032 (USD Billion)
19. U.S. Feed Phosphates Market, By Type, 2019-2032 (USD Billion)
20. U.S. Feed Phosphates Market, By Form, 2019-2032 (USD Billion)
21. U.S. Feed Phosphates Market, By Livestock, 2019-2032 (USD Billion)
22. Canada Feed Phosphates Market, By Type, 2019-2032 (USD Billion)
23. Canada Feed Phosphates Market, By Form, 2019-2032 (USD Billion)
24. Canada Feed Phosphates Market, By Livestock, 2019-2032 (USD Billion)
25. Mexico Feed Phosphates Market, By Type, 2019-2032 (USD Billion)
26. Mexico Feed Phosphates Market, By Form, 2019-2032 (USD Billion)
27. Mexico Feed Phosphates Market, By Livestock, 2019-2032 (USD Billion)
28. Europe Feed Phosphates Market, By Type, 2019-2032 (USD Billion)
29. Europe Feed Phosphates Market, By Form, 2019-2032 (USD Billion)
30. Europe Feed Phosphates Market, By Livestock, 2019-2032 (USD Billion)
31. Germany Feed Phosphates Market, By Type, 2019-2032 (USD Billion)
32. Germany Feed Phosphates Market, By Form, 2019-2032 (USD Billion)
33. Germany Feed Phosphates Market, By Livestock, 2019-2032 (USD Billion)
34. France Feed Phosphates Market, By Type, 2019-2032 (USD Billion)
35. France Feed Phosphates Market, By Form, 2019-2032 (USD Billion)
36. France Feed Phosphates Market, By Livestock, 2019-2032 (USD Billion)
37. U.K. Feed Phosphates Market, By Type, 2019-2032 (USD Billion)
38. U.K. Feed Phosphates Market, By Form, 2019-2032 (USD Billion)
39. U.K. Feed Phosphates Market, By Livestock, 2019-2032 (USD Billion)
40. Italy Feed Phosphates Market, By Type, 2019-2032 (USD Billion)
41. Italy Feed Phosphates Market, By Form, 2019-2032 (USD Billion)
42. Italy Feed Phosphates Market, By Livestock, 2019-2032 (USD Billion)
43. Spain Feed Phosphates Market, By Type, 2019-2032 (USD Billion)
44. Spain Feed Phosphates Market, By Form, 2019-2032 (USD Billion)
45. Spain Feed Phosphates Market, By Livestock, 2019-2032 (USD Billion)
46. Asia Pacific Feed Phosphates Market, By Type, 2019-2032 (USD Billion)
47. Asia Pacific Feed Phosphates Market, By Form, 2019-2032 (USD Billion)
48. Asia Pacific Feed Phosphates Market, By Livestock, 2019-2032 (USD Billion)
49. Japan Feed Phosphates Market, By Type, 2019-2032 (USD Billion)
50. Japan Feed Phosphates Market, By Form, 2019-2032 (USD Billion)
51. Japan Feed Phosphates Market, By Livestock, 2019-2032 (USD Billion)
52. China Feed Phosphates Market, By Type, 2019-2032 (USD Billion)
53. China Feed Phosphates Market, By Form, 2019-2032 (USD Billion)
54. China Feed Phosphates Market, By Livestock, 2019-2032 (USD Billion)
55. India Feed Phosphates Market, By Type, 2019-2032 (USD Billion)
56. India Feed Phosphates Market, By Form, 2019-2032 (USD Billion)
57. India Feed Phosphates Market, By Livestock, 2019-2032 (USD Billion)
58. South America Feed Phosphates Market, By Type, 2019-2032 (USD Billion)
59. South America Feed Phosphates Market, By Form, 2019-2032 (USD Billion)
60. South America Feed Phosphates Market, By Livestock, 2019-2032 (USD Billion)
61. Brazil Feed Phosphates Market, By Type, 2019-2032 (USD Billion)
62. Brazil Feed Phosphates Market, By Form, 2019-2032 (USD Billion)
63. Brazil Feed Phosphates Market, By Livestock, 2019-2032 (USD Billion)
64. Middle East and Africa Feed Phosphates Market, By Type, 2019-2032 (USD Billion)
65. Middle East and Africa Feed Phosphates Market, By Form, 2019-2032 (USD Billion)
66. Middle East and Africa Feed Phosphates Market, By Livestock, 2019-2032 (USD Billion)
67. UAE Feed Phosphates Market, By Type, 2019-2032 (USD Billion)
68. UAE Feed Phosphates Market, By Form, 2019-2032 (USD Billion)
69. UAE Feed Phosphates Market, By Livestock, 2019-2032 (USD Billion)
70. South Africa Feed Phosphates Market, By Type, 2019-2032 (USD Billion)
71. South Africa Feed Phosphates Market, By Form, 2019-2032 (USD Billion)
72. South Africa Feed Phosphates Market, By Livestock, 2019-2032 (USD Billion)
List of Figures
1. Global Feed Phosphates Market Segmentation
2. Feed Phosphates Market: Research Methodology
3. Market Size Estimation Methodology: Bottom-Up Approach
4. Market Size Estimation Methodology: Top-Down Approach
5. Data Triangulation
6. Porter’s Five Forces Analysis
7. Value Chain Analysis
8. Global Feed Phosphates Market Attractiveness Analysis by Type
9. Global Feed Phosphates Market Attractiveness Analysis by Form
10. Global Feed Phosphates Market Attractiveness Analysis by Livestock
11. Global Feed Phosphates Market Attractiveness Analysis by Region
12. Global Feed Phosphates Market: Dynamics
13. Global Feed Phosphates Market Share by Type (2022 & 2032)
14. Global Feed Phosphates Market Share by Form (2022 & 2032)
15. Global Feed Phosphates Market Share by Livestock (2022 & 2032)
16. Global Feed Phosphates Market Share by Regions (2022 & 2032)
17. Global Feed Phosphates Market Share by Company (2022)
This study forecasts revenue at global, regional, and country levels from 2019 to 2032. The Brainy Insights has segmented the global feed phosphates market based on below-mentioned segments:
Global Feed Phosphates Market by Type:
Global Feed Phosphates Market by Form:
Global Feed Phosphates Market by Livestock:
Global Feed Phosphates Market by Region:
Research has its special purpose to undertake marketing efficiently. In this competitive scenario, businesses need information across all industry verticals; the information about customer wants, market demand, competition, industry trends, distribution channels etc. This information needs to be updated regularly because businesses operate in a dynamic environment. Our organization, The Brainy Insights incorporates scientific and systematic research procedures in order to get proper market insights and industry analysis for overall business success. The analysis consists of studying the market from a miniscule level wherein we implement statistical tools which helps us in examining the data with accuracy and precision.
Our research reports feature both; quantitative and qualitative aspects for any market. Qualitative information for any market research process are fundamental because they reveal the customer needs and wants, usage and consumption for any product/service related to a specific industry. This in turn aids the marketers/investors in knowing certain perceptions of the customers. Qualitative research can enlighten about the different product concepts and designs along with unique service offering that in turn, helps define marketing problems and generate opportunities. On the other hand, quantitative research engages with the data collection process through interviews, e-mail interactions, surveys and pilot studies. Quantitative aspects for the market research are useful to validate the hypotheses generated during qualitative research method, explore empirical patterns in the data with the help of statistical tools, and finally make the market estimations.
The Brainy Insights offers comprehensive research and analysis, based on a wide assortment of factual insights gained through interviews with CXOs and global experts and secondary data from reliable sources. Our analysts and industry specialist assume vital roles in building up statistical tools and analysis models, which are used to analyse the data and arrive at accurate insights with exceedingly informative research discoveries. The data provided by our organization have proven precious to a diverse range of companies, facilitating them to address issues such as determining which products/services are the most appealing, whether or not customers use the product in the manner anticipated, the purchasing intentions of the market and many others.
Our research methodology encompasses an idyllic combination of primary and secondary initiatives. Key phases involved in this process are listed below:

The phase involves the gathering and collecting of market data and its related information with the help of different sources & research procedures.

The data procurement stage involves in data gathering and collecting through various data sources.
This stage involves in extensive research. These data sources includes:
Purchased Database: Purchased databases play a crucial role in estimating the market sizes irrespective of the domain. Our purchased database includes:
Primary Research: The Brainy Insights interacts with leading companies and experts of the concerned domain to develop the analyst team’s market understanding and expertise. It improves and substantiates every single data presented in the market reports. Primary research mainly involves in telephonic interviews, E-mail interactions and face-to-face interviews with the raw material providers, manufacturers/producers, distributors, & independent consultants. The interviews that we conduct provides valuable data on market size and industry growth trends prevailing in the market. Our organization also conducts surveys with the various industry experts in order to gain overall insights of the industry/market. For instance, in healthcare industry we conduct surveys with the pharmacists, doctors, surgeons and nurses in order to gain insights and key information of a medical product/device/equipment which the customers are going to usage. Surveys are conducted in the form of questionnaire designed by our own analyst team. Surveys plays an important role in primary research because surveys helps us to identify the key target audiences of the market. Additionally, surveys helps to identify the key target audience engaged with the market. Our survey team conducts the survey by targeting the key audience, thus gaining insights from them. Based on the perspectives of the customers, this information is utilized to formulate market strategies. Moreover, market surveys helps us to understand the current competitive situation of the industry. To be precise, our survey process typically involve with the 360 analysis of the market. This analytical process begins by identifying the prospective customers for a product or service related to the market/industry to obtain data on how a product/service could fit into customers’ lives.

Secondary Research: The secondary data sources includes information published by the on-profit organizations such as World bank, WHO, company fillings, investor presentations, annual reports, national government documents, statistical databases, blogs, articles, white papers and others. From the annual report, we analyse a company’s revenue to understand the key segment and market share of that organization in a particular region. We analyse the company websites and adopt the product mapping technique which is important for deriving the segment revenue. In the product mapping method, we select and categorize the products offered by the companies catering to domain specific market, deduce the product revenue for each of the companies so as to get overall estimation of the market size. We also source data and analyses trends based on information received from supply side and demand side intermediaries in the value chain. The supply side denotes the data gathered from supplier, distributor, wholesaler and the demand side illustrates the data gathered from the end customers for respective market domain.

The supply side for a domain specific market is analysed by:
The demand side for the market is estimated through:
In-house Library: Apart from these third-party sources, we have our in-house library of qualitative and quantitative information. Our in-house database includes market data for various industry and domains. These data are updated on regular basis as per the changing market scenario. Our library includes, historic databases, internal audit reports and archives.
Sometimes there are instances where there is no metadata or raw data available for any domain specific market. For those cases, we use our expertise to forecast and estimate the market size in order to generate comprehensive data sets. Our analyst team adopt a robust research technique in order to produce the estimates:
Data Synthesis: This stage involves the analysis & mapping of all the information obtained from the previous step. It also involves in scrutinizing the data for any discrepancy observed while data gathering related to the market. The data is collected with consideration to the heterogeneity of sources. Robust scientific techniques are in place for synthesizing disparate data sets and provide the essential contextual information that can orient market strategies. The Brainy Insights has extensive experience in data synthesis where the data passes through various stages:


Market Deduction & Formulation: The final stage comprises of assigning data points at appropriate market spaces so as to deduce feasible conclusions. Analyst perspective & subject matter expert based holistic form of market sizing coupled with industry analysis also plays a crucial role in this stage.
This stage involves in finalization of the market size and numbers that we have collected from data integration step. With data interpolation, it is made sure that there is no gap in the market data. Successful trend analysis is done by our analysts using extrapolation techniques, which provide the best possible forecasts for the market.
Data Validation & Market Feedback: Validation is the most important step in the process. Validation & re-validation via an intricately designed process helps us finalize data-points to be used for final calculations.

The Brainy Insights interacts with leading companies and experts of the concerned domain to develop the analyst team’s market understanding and expertise. It improves and substantiates every single data presented in the market reports. The data validation interview and discussion panels are typically composed of the most experienced industry members. The participants include, however, are not limited to:
Moreover, we always validate our data and findings through primary respondents from all the major regions we are working on.


Free Customization
Fortune 500 Clients
Free Yearly Update On Purchase Of Multi/Corporate License
Companies Served Till Date