- +1-315-215-1633
- sales@thebrainyinsights.com

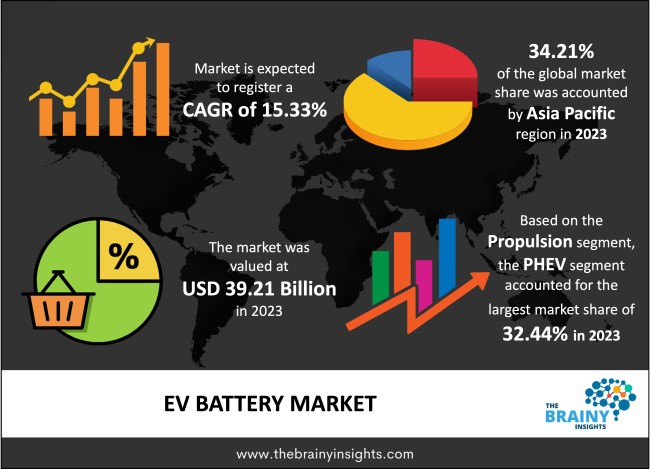
The global EV battery market was valued at USD 39.21 billion in 2023 and is anticipated to grow at a CAGR of 15.33% from 2024 to 2033. The global EV battery market is expected to reach USD 163.31 billion by 2033. The Asia Pacific is expected to grow the fastest during the forecast period.
Rechargeable batteries are used to power the electric motors of battery-operated vehicles (BEVs) or hybrid EVs (HEVs). These batteries are referred to as EV batteries (EVs) or traction batteries (HEV). Lithium-ion batteries are frequently made with high electric charge (or energy) capacity. Deep-cycle batteries differ from starting, lights, and ignition (SLI) batteries because they supply power for prolonged periods. Smaller batteries are favored because they increase performance while reducing vehicle weight. Electric car batteries are distinguished by their relatively high power-to-weight ratio, specific energy, and energy density. The majority of today's battery technologies have substantially lower specific energies than liquid fuels, which frequently affects the cars' maximum all-electric range.
Get an overview of this study by requesting a free sample
Rising demand for Evs- Demand for EVs is growing as environmental concerns about conventional cars continue to increase. As a result, governments all over the world are supporting the use of alternative fuel vehicles. EVs, are zero-emission vehicles gaining worldwide popularity for environmentally beneficial public transit. Several national governments offer financial incentives, such as tax exemptions and subsidies, refunds, reduced parking/toll charges for EVs, and free charging, to encourage the usage of EVS.
Safety concerns with batteries and raw materials procurement- Most cobalt extraction plants are in China and the Congo. Together, the two nations extract between 70 and 80 percent of the world's cobalt mine. This raises the possibility of a cobalt supply disruption in the event of any unpredictability in these nations. Of all the battery raw materials, cobalt now poses the most procurement risks. This is because of the anticipated dynamic increase in demand and any ensuing supply limitations.
Introducing the battery-as-a-service (BaaS) business concept- Several organizations are developing business models that enable consumers to change or exchange EV batteries once they have been depleted, such as battery swapping and battery-as-a-service (BaaS). This reduces user time spent on battery recharging, increasing customer happiness and removing one of the critical barriers preventing consumers from choosing EVs. Battery swapping at EV charging stations has become more popular as it saves EV customers time from having to charge their batteries. This is expected to provide growth opportunities for the market over the forecast period.
High cost of EVs- EV production has been a significant barrier to their broad acceptance. The cost of buying electric hatchbacks, crossovers, or SUVs is likely to decrease to reach the levels of ICE vehicles due to the anticipated decline in battery prices and decreased R&D expenses, which will increase demand for EVs. Due to the high cost of the rechargeable lithium-ion batteries needed for these vehicles, the cost of EVs is much higher than that of ICE vehicles. Due to the high cost of raw materials, including cobalt, nickel, lithium, and magnesium, the cathode price significantly impacts battery prices.
The regions analyzed for the market include North America, Europe, South America, Asia Pacific, the Middle East, and Africa. The Asia Pacific emerged as the largest market for the global EV battery market, with a 34.21% share of the market revenue in 2023.
The Asia Pacific currently dominates the EV battery market due to the existence of top regional manufacturers. Due to its ability to provide firms with significant labor and raw material cost savings, the Asia-Pacific area is growing. In addition, countries like China and India, among others, are where most cars are made. The EV market has also been expanding in Japan and South Korea. Their governments have helped the market flourish by installing EV charging stations, creating emission standards, setting deadlines for switching from ICE vehicles to full or hybrid EVs, and other measures.
Asia Pacific Region EV Battery Market Share in 2023 - 34.21%
www.thebrainyinsights.com
Check the geographical analysis of this market by requesting a free sample
The vehicle type segment is divided into passenger cars, light trucks/vans, medium and heavy trucks, off-highway vehicles, and buses. The passenger cars segment dominated the market, with a market share of around 22.55% in 2023. The increasing demand for comfortable travel experiences propels the growth of the passenger cars segment.
The battery capacity segment is divided into <50 kWh, 50-110 kWh, 111-200 kWh, 201-300 kWh, and >300 kWh. Over the forecast period, the 50-110 kWh segment is expected to grow at the fastest CAGR of 17.32%. The amount of battery capacity used typically relies on how the EV fleet develops and the required battery capacity per car, typically above 50 kWh for BEVs and 12 kWh for PHEVs, respectively. Therefore, major EV market companies have installed 50–110 kWh of battery capacity to remain competitive. For instance, the battery capacities of the Tesla Model S, Model X, Model 3, and Chevrolet Bolt EV all range from 50 to 110 kWh.
The propulsion segment is divided into BEV, HEV, PHEV, and FCEV. In 2023, the PHEV segment dominated the market, accounting for around 32.44% of global revenue. An electric car's battery accounts for most of its initial cost. PHEVs often have cheaper initial expenses than BEVs since they have smaller batteries which propel the segment's growth. Additionally, there are more PHEVs than BEVs available right now, which adds impetus to the market's growth.
The battery type segment is divided into lead-acid, lithium-ion, nickel-metal hydride, sodium-ion, and solid-state. The solid-state segment dominated the market, accounting for around 22.37% of global revenue. A Li-ion battery with a liquid electrolyte solution has a lower energy density than a solid-state battery. Due to the shallow fire risk, this battery may be manufactured very small to conserve space. Compared to lithium-ion batteries, a solid-state battery can significantly increase the energy density per unit area.
The bonding segment is divided into laser and wire. The laser segment dominated the market, with a market share of around 62.89% in 2023. Since laser-welded bonds can withstand higher currents and have advantages like narrow welds, quick welding, and low heat, which are crucial for battery tab welding because the chemicals inside batteries are heat sensitive, this market segment is predicted to increase during the forecast period.
The form segment is divided into the pouch, prismatic, and cylindrical. The pouch segment dominated the market, with a market share of around 38.67% in 2023. This segment's rapid rise is explained by its higher energy density compared to prismatic cells of equivalent weight, higher safety performance, and reduced internal resistance. Top automotive and battery OEMs are investing in pouch cell forms to power the forthcoming EVs.
| Attribute | Description |
|---|---|
| Market Size | Revenue (USD Billion) |
| Market size value in 2023 | USD 39.21 Billion |
| Market size value in 2033 | USD 163.31 Billion |
| CAGR (2024 to 2033) | 15.33% |
| Historical data | 2020-2022 |
| Base Year | 2023 |
| Forecast | 2024-2033 |
| Regional Segments | North America, Asia Pacific, Europe, Latin America, Middle East and Africa |
| Segments | Battery Capacity, Propulsion, Battery Type, Bonding, Form, Vehicle Type |
As per The Brainy Insights, the size of the EV battery market was valued at USD 39.21 billion in 2023 to USD 163.31 billion by 2033.
The global EV battery market is growing at a CAGR of 15.33% during the forecast period 2024-2033.
Asia Pacific emerged as the largest market for EV battery.
1. Introduction
1.1. Objectives of the Study
1.2. Market Definition
1.3. Research Scope
1.4. Currency
1.5. Key Target Audience
2. Research Methodology and Assumptions
3. Executive Summary
4. Premium Insights
4.1. Porter’s Five Forces Analysis
4.2. Value Chain Analysis
4.3. Top Investment Pockets
4.3.1. Market Attractiveness Analysis By Vehicle Type
4.3.2. Market Attractiveness Analysis By Battery Capacity
4.3.3. Market Attractiveness Analysis By Propulsion
4.3.4. Market Attractiveness Analysis By Battery Type
4.3.5. Market Attractiveness Analysis By Bonding
4.3.6. Market Attractiveness Analysis By Form
4.3.7. Market Attractiveness Analysis By Region
4.4. Industry Trends
5. Market Dynamics
5.1. Market Evaluation
5.2. Drivers
5.2.1. Rising demand for Evs
5.3. Restraints
5.3.1. Safety concerns with batteries concerns about raw materials procurement
5.4. Opportunities
5.4.1. Introducing the battery-as-a-service (BaaS) business concept
5.5. Challenges
5.5.1. High cost of EVs
1. Global EV Battery Market Analysis and Forecast, By Vehicle Type
1.1. Segment Overview
1.2. Passenger Cars
1.3. Vans/Light Trucks
1.4. Vans/Light Trucks
1.5. Buses
1.6. Off-highway Vehicles
1.7. Stem Cells
1.8. Others
2. Global EV Battery Market Analysis and Forecast, By Battery Capacity
2.1. Segment Overview
2.2. <50 kWh
2.3. 50-110 kWh
2.4. 111-200 kWh
2.5. 201-300 kWh
2.6. >300 kWh
3. Global EV Battery Market Analysis and Forecast, By Propulsion
3.1. Segment Overview
3.2. BEV
3.3. HEV
3.4. PHEV
3.5. FCEV
4. Global EV Battery Market Analysis and Forecast, By Battery Type
4.1. Segment Overview
4.2. Lead-acid
4.3. Lithium-ion
4.4. Nickel-metal Hydride
4.5. Sodium-ion
4.6. Solid-state
5. Global EV Battery Market Analysis and Forecast, By Bonding
1.1. Segment Overview
1.2. Wire Bonding
1.3. Laser Bonding
1.4. Academic & Research Institutes
6. Global EV Battery Market Analysis and Forecast, By Form
1.5. Segment Overview
1.6. Prismatic
1.7. Cylindrical
1.8. Pouch
7. Global EV Battery Market Analysis and Forecast, By Regional Analysis
7.1. Segment Overview
7.2. North America
7.2.1. U.S.
7.2.2. Canada
7.2.3. Mexico
7.3. Europe
7.3.1. Germany
7.3.2. France
7.3.3. U.K.
7.3.4. Italy
7.3.5. Spain
7.4. Asia-Pacific
7.4.1. Japan
7.4.2. China
7.4.3. India
7.5. South America
7.5.1. Brazil
7.6. Middle East and Africa
7.6.1. UAE
7.6.2. South Africa
8. Global EV Battery Market-Competitive Landscape
8.1. Overview
8.2. Market Share of Key Players in Global EV Battery Market
8.2.1. Global Company Market Share
8.2.2. North America Company Market Share
8.2.3. Europe Company Market Share
8.2.4. APAC Company Market Share
8.3. Competitive Situations and Trends
8.3.1. Product Launches and Developments
8.3.2. Partnerships, Collaborations, and Agreements
8.3.3. Mergers & Acquisitions
8.3.4. Expansions
9. Company Profiles
9.1. Hitachi
9.1.1. Business Overview
9.1.2. Company Snapshot
9.1.3. Company Market Share Analysis
9.1.4. Company Product Portfolio
9.1.5. Recent Developments
9.1.6. SWOT Analysis
9.2. North Star
9.2.1. Business Overview
9.2.2. Company Snapshot
9.2.3. Company Market Share Analysis
9.2.4. Company Product Portfolio
9.2.5. Recent Developments
9.2.6. SWOT Analysis
9.3. GS Yuasa Corp.
9.3.1. Business Overview
9.3.2. Company Snapshot
9.3.3. Company Market Share Analysis
9.3.4. Company Product Portfolio
9.3.5. Recent Developments
9.3.6. SWOT Analysis
9.4. Sony
9.4.1. Business Overview
9.4.2. Company Snapshot
9.4.3. Company Market Share Analysis
9.4.4. Company Product Portfolio
9.4.5. Recent Developments
9.4.6. SWOT Analysis
9.5. ATLASBX Co. Ltd.
9.5.1. Business Overview
9.5.2. Company Snapshot
9.5.3. Company Market Share Analysis
9.5.4. Company Product Portfolio
9.5.5. Recent Developments
9.5.6. SWOT Analysis
9.6. Narada Power Source Co., Ltd.
9.6.1. Business Overview
9.6.2. Company Snapshot
9.6.3. Company Market Share Analysis
9.6.4. Company Product Portfolio
9.6.5. Recent Developments
9.6.6. SWOT Analysis
9.7. TCL Corporation
9.7.1. Business Overview
9.7.2. Company Snapshot
9.7.3. Company Market Share Analysis
9.7.4. Company Product Portfolio
9.7.5. Recent Developments
9.7.6. SWOT Analysis
9.8. Duracell
9.8.1. Business Overview
9.8.2. Company Snapshot
9.8.3. Company Market Share Analysis
9.8.4. Company Product Portfolio
9.8.5. Recent Developments
9.8.6. SWOT Analysis
9.9. Crown Battery Manufacturing
9.9.1. Business Overview
9.9.2. Company Snapshot
9.9.3. Company Market Share Analysis
9.9.4. Company Product Portfolio
9.9.5. Recent Developments
9.9.6. SWOT Analysis
9.10. EnerSys, Inc.
9.10.1. Business Overview
9.10.2. Company Snapshot
9.10.3. Company Market Share Analysis
9.10.4. Company Product Portfolio
9.10.5. Recent Developments
9.10.6. SWOT Analysis
9.11. Huanyu New Energy Technology
9.11.1. Business Overview
9.11.2. Company Snapshot
9.11.3. Company Market Share Analysis
9.11.4. Company Product Portfolio
9.11.5. Recent Developments
9.11.6. SWOT Analysis
9.12. C&D Technologies, Inc.
9.12.1. Business Overview
9.12.2. Company Snapshot
9.12.3. Company Market Share Analysis
9.12.4. Company Product Portfolio
9.12.5. Recent Developments
9.12.6. SWOT Analysis
List of Table
1. Global EV Battery Market, By Vehicle Type, 2020 to 2033 (USD Billion)
2. Global Passenger Cars, EV Battery Market, By Region, 2020 to 2033 (USD Billion)
3. Global Vans/Light Trucks, EV Battery Market, By Region, 2020 to 2033 (USD Billion)
4. Global Buses, EV Battery Market, By Region, 2020 to 2033 (USD Billion)
5. Global Off-highway Vehicles, EV Battery Market, By Region, 2020 to 2033 (USD Billion)
6. Global EV Battery Market, By Battery Capacity, 2020 to 2033 (USD Billion)
7. Global <50 kWh, EV Battery Market, By Region, 2020 to 2033 (USD Billion)
8. Global 50-110 kWh, EV Battery Market, By Region, 2020 to 2033 (USD Billion)
9. Global 111-200 kWh, EV Battery Market, By Region, 2020 to 2033 (USD Billion)
10. Global 201-300 kWh, EV Battery Market, By Region, 2020 to 2033 (USD Billion)
11. Global >300 kWh, EV Battery Market, By Region, 2020 to 2033 (USD Billion)
12. Global EV Battery Market, By Propulsion, 2020 to 2033 (USD Billion)
13. Global BEV, EV Battery Market, By Region, 2020 to 2033 (USD Billion)
14. Global HEV, EV Battery Market, By Region, 2020 to 2033 (USD Billion)
15. Global PHEV, EV Battery Market, By Region, 2020 to 2033 (USD Billion)
16. Global FCEV, EV Battery Market, By Region, 2020 to 2033 (USD Billion)
17. Global EV Battery Market, By Battery Type, 2020 to 2033 (USD Billion)
18. Global Lead-acid, EV Battery Market, By Region, 2020 to 2033 (USD Billion)
19. Global Lithium-ion, EV Battery Market, By Region, 2020 to 2033 (USD Billion)
20. Global Nickel-metal Hydride, EV Battery Market, By Region, 2020 to 2033 (USD Billion)
21. Global Sodium-ion, EV Battery Market, By Region, 2020 to 2033 (USD Billion)
22. Global Solid-state, EV Battery Market, By Region, 2020 to 2033 (USD Billion)
23. Global EV Battery Market, By Bonding, 2020 to 2033 (USD Billion)
24. Global Wire Bonding, EV Battery Market, By Region, 2020 to 2033 (USD Billion)
25. Global Laser Bonding, EV Battery Market, By Region, 2020 to 2033 (USD Billion)
26. Global EV Battery Market, By Form, 2020 to 2033 (USD Billion)
27. Global Prismatic, EV Battery Market, By Region, 2020 to 2033 (USD Billion)
28. Global Cylindrical, EV Battery Market, By Region, 2020 to 2033 (USD Billion)
29. Global Pouch, EV Battery Market, By Region, 2020 to 2033 (USD Billion)
30. North America EV Battery Market, By Vehicle Type, 2020 to 2033 (USD Billion)
31. North America EV Battery Market, By Battery Capacity, 2020 to 2033 (USD Billion)
32. North America EV Battery Market, By Propulsion, 2020 to 2033 (USD Billion)
33. North America EV Battery Market, By Battery Type, 2020 to 2033 (USD Billion)
34. North America EV Battery Market, By Bonding, 2020 to 2033 (USD Billion)
35. North America EV Battery Market, By Form, 2020 to 2033 (USD Billion)
36. U.S. EV Battery Market, By Vehicle Type, 2020 to 2033 (USD Billion)
37. U.S. EV Battery Market, By Battery Capacity, 2020 to 2033 (USD Billion)
38. U.S. EV Battery Market, By Propulsion, 2020 to 2033 (USD Billion)
39. U.S. EV Battery Market, By Battery Type, 2020 to 2033 (USD Billion)
40. U.S. EV Battery Market, By Bonding, 2020 to 2033 (USD Billion)
41. U.S. EV Battery Market, By Form, 2020 to 2033 (USD Billion)
42. Canada EV Battery Market, By Vehicle Type, 2020 to 2033 (USD Billion)
43. Canada EV Battery Market, By Battery Capacity, 2020 to 2033 (USD Billion)
44. Canada EV Battery Market, By Propulsion, 2020 to 2033 (USD Billion)
45. Canada EV Battery Market, By Battery Type, 2020 to 2033 (USD Billion)
46. Canada EV Battery Market, By Bonding, 2020 to 2033 (USD Billion)
47. Canada EV Battery Market, By Form, 2020 to 2033 (USD Billion)
48. Mexico EV Battery Market, By Vehicle Type, 2020 to 2033 (USD Billion)
49. Mexico EV Battery Market, By Battery Capacity, 2020 to 2033 (USD Billion)
50. Mexico EV Battery Market, By Propulsion, 2020 to 2033 (USD Billion)
51. Mexico EV Battery Market, By Battery Type, 2020 to 2033 (USD Billion)
52. Mexico EV Battery Market, By Bonding, 2020 to 2033 (USD Billion)
53. Mexico EV Battery Market, By Form, 2020 to 2033 (USD Billion)
54. Europe EV Battery Market, By Vehicle Type, 2020 to 2033 (USD Billion)
55. Europe EV Battery Market, By Battery Capacity, 2020 to 2033 (USD Billion)
56. Europe EV Battery Market, By Propulsion, 2020 to 2033 (USD Billion)
57. Europe EV Battery Market, By Battery Type, 2020 to 2033 (USD Billion)
58. Europe EV Battery Market, By Bonding, 2020 to 2033 (USD Billion)
59. Mexico EV Battery Market, By Form, 2020 to 2033 (USD Billion)
60. Germany EV Battery Market, By Vehicle Type, 2020 to 2033 (USD Billion)
61. Germany EV Battery Market, By Battery Capacity, 2020 to 2033 (USD Billion)
62. Germany EV Battery Market, By Propulsion, 2020 to 2033 (USD Billion)
63. Germany EV Battery Market, By Battery Type, 2020 to 2033 (USD Billion)
64. Germany EV Battery Market, By Bonding, 2020 to 2033 (USD Billion)
65. Germany EV Battery Market, By Form, 2020 to 2033 (USD Billion)
66. France EV Battery Market, By Vehicle Type, 2020 to 2033 (USD Billion)
67. France EV Battery Market, By Battery Capacity, 2020 to 2033 (USD Billion)
68. France EV Battery Market, By Propulsion, 2020 to 2033 (USD Billion)
69. France EV Battery Market, By Battery Type, 2020 to 2033 (USD Billion)
70. France EV Battery Market, By Bonding, 2020 to 2033 (USD Billion)
71. France EV Battery Market, By Form, 2020 to 2033 (USD Billion)
72. U.K. EV Battery Market, By Vehicle Type, 2020 to 2033 (USD Billion)
73. U.K. EV Battery Market, By Battery Capacity, 2020 to 2033 (USD Billion)
74. U.K. EV Battery Market, By Propulsion, 2020 to 2033 (USD Billion)
75. U.K. EV Battery Market, By Battery Type, 2020 to 2033 (USD Billion)
76. U.K. EV Battery Market, By Bonding, 2020 to 2033 (USD Billion)
77. U.K. EV Battery Market, By Form, 2020 to 2033 (USD Billion)
78. Italy EV Battery Market, By Vehicle Type, 2020 to 2033 (USD Billion)
79. Italy EV Battery Market, By Battery Capacity, 2020 to 2033 (USD Billion)
80. Italy EV Battery Market, By Propulsion, 2020 to 2033 (USD Billion)
81. Italy EV Battery Market, By Battery Type, 2020 to 2033 (USD Billion)
82. Italy EV Battery Market, By Bonding, 2020 to 2033 (USD Billion)
83. Italy EV Battery Market, By Form, 2020 to 2033 (USD Billion)
84. Spain EV Battery Market, By Vehicle Type, 2020 to 2033 (USD Billion)
85. Spain EV Battery Market, By Battery Capacity, 2020 to 2033 (USD Billion)
86. Spain EV Battery Market, By Propulsion, 2020 to 2033 (USD Billion)
87. Spain EV Battery Market, By Battery Type, 2020 to 2033 (USD Billion)
88. Spain EV Battery Market, By Bonding, 2020 to 2033 (USD Billion)
89. Spain EV Battery Market, By Form, 2020 to 2033 (USD Billion)
90. Asia Pacific EV Battery Market, By Vehicle Type, 2020 to 2033 (USD Billion)
91. Asia Pacific EV Battery Market, By Battery Capacity, 2020 to 2033 (USD Billion)
92. Asia Pacific EV Battery Market, By Propulsion, 2020 to 2033 (USD Billion)
93. Asia Pacific EV Battery Market, By Battery Type, 2020 to 2033 (USD Billion)
94. Asia Pacific EV Battery Market, By Bonding, 2020 to 2033 (USD Billion)
95. Asia Pacific EV Battery Market, By Form, 2020 to 2033 (USD Billion)
96. Japan EV Battery Market, By Vehicle Type, 2020 to 2033 (USD Billion)
97. Japan EV Battery Market, By Battery Capacity, 2020 to 2033 (USD Billion)
98. Japan EV Battery Market, By Propulsion, 2020 to 2033 (USD Billion)
99. Japan EV Battery Market, By Battery Type, 2020 to 2033 (USD Billion)
100. Japan EV Battery Market, By Bonding, 2020 to 2033 (USD Billion)
101. Japan EV Battery Market, By Form, 2020 to 2033 (USD Billion)
102. China EV Battery Market, By Vehicle Type, 2020 to 2033 (USD Billion)
103. China EV Battery Market, By Battery Capacity, 2020 to 2033 (USD Billion)
104. China EV Battery Market, By Propulsion, 2020 to 2033 (USD Billion)
105. China EV Battery Market, By Battery Type, 2020 to 2033 (USD Billion)
106. China EV Battery Market, By Bonding, 2020 to 2033 (USD Billion)
107. China EV Battery Market, By Form, 2020 to 2033 (USD Billion)
108. India EV Battery Market, By Vehicle Type, 2020 to 2033 (USD Billion)
109. India EV Battery Market, By Battery Capacity, 2020 to 2033 (USD Billion)
110. India EV Battery Market, By Propulsion, 2020 to 2033 (USD Billion)
111. India EV Battery Market, By Battery Type, 2020 to 2033 (USD Billion)
112. India EV Battery Market, By Bonding, 2020 to 2033 (USD Billion)
113. India EV Battery Market, By Form, 2020 to 2033 (USD Billion)
114. South America EV Battery Market, By Vehicle Type, 2020 to 2033 (USD Billion)
115. South America EV Battery Market, By Battery Capacity, 2020 to 2033 (USD Billion)
116. South America EV Battery Market, By Propulsion, 2020 to 2033 (USD Billion)
117. South America EV Battery Market, By Battery Type, 2020 to 2033 (USD Billion)
118. South America EV Battery Market, By Bonding, 2020 to 2033 (USD Billion)
119. South America EV Battery Market, By Form, 2020 to 2033 (USD Billion)
120. Brazil EV Battery Market, By Vehicle Type, 2020 to 2033 (USD Billion)
121. Brazil EV Battery Market, By Battery Capacity, 2020 to 2033 (USD Billion)
122. Brazil EV Battery Market, By Propulsion, 2020 to 2033 (USD Billion)
123. Brazil EV Battery Market, By Battery Type, 2020 to 2033 (USD Billion)
124. Brazil EV Battery Market, By Bonding, 2020 to 2033 (USD Billion)
125. Brazil EV Battery Market, By Form, 2020 to 2033 (USD Billion)
126. Middle East and Africa EV Battery Market, By Vehicle Type, 2020 to 2033 (USD Billion)
127. Middle East and Africa EV Battery Market, By Battery Capacity, 2020 to 2033 (USD Billion)
128. Middle East and Africa EV Battery Market, By Propulsion, 2020 to 2033 (USD Billion)
129. Middle East and Africa EV Battery Market, By Battery Type, 2020 to 2033 (USD Billion)
130. Middle East and Africa EV Battery Market, By Bonding, 2020 to 2033 (USD Billion)
131. Middle East and Africa EV Battery Market, By Form, 2020 to 2033 (USD Billion)
132. UAE EV Battery Market, By Vehicle Type, 2020 to 2033 (USD Billion)
133. UAE EV Battery Market, By Battery Capacity, 2020 to 2033 (USD Billion)
134. UAE EV Battery Market, By Propulsion, 2020 to 2033 (USD Billion)
135. UAE EV Battery Market, By Battery Type, 2020 to 2033 (USD Billion)
136. UAE EV Battery Market, By Bonding, 2020 to 2033 (USD Billion)
137. UAE EV Battery Market, By Form, 2020 to 2033 (USD Billion)
138. South Africa EV Battery Market, By Vehicle Type, 2020 to 2033 (USD Billion)
139. South Africa EV Battery Market, By Battery Capacity, 2020 to 2033 (USD Billion)
140. South Africa EV Battery Market, By Propulsion, 2020 to 2033 (USD Billion)
141. South Africa EV Battery Market, By Battery Type, 2020 to 2033 (USD Billion)
142. South Africa EV Battery Market, By Bonding, 2020 to 2033 (USD Billion)
143. South Africa EV Battery Market, By Form, 2020 to 2033 (USD Billion)
List of Figures
1. Global EV Battery Market Segmentation
2. Global EV Battery Market: Research Methodology
3. Market Size Estimation Methodology: Bottom-Up Approach
4. Market Size Estimation Methodology: Top-Down Approach
5. Data Triangulation
6. Porter’s Five Forces Analysis
7. Value Chain Analysis
8. Global EV Battery Market Attractiveness Analysis By Vehicle Type
9. Global EV Battery Market Attractiveness Analysis By Battery Capacity
10. Global EV Battery Market Attractiveness Analysis By Propulsion
11. Global EV Battery Market Attractiveness Analysis By Battery Type
12. Global EV Battery Market Attractiveness Analysis By Bonding
13. Global EV Battery Market Attractiveness Analysis By Form
14. Global EV Battery Market Attractiveness Analysis By Region
15. Global EV Battery Market: Dynamics
16. Global EV Battery Market Share By Vehicle Type (2023 to 2033)
17. Global EV Battery Market Share By Battery Capacity (2023 to 2033)
18. Global EV Battery Market Share By Propulsion (2023 to 2033)
19. Global EV Battery Market Share By Battery Type (2023 to 2033)
20. Global EV Battery Market Share By Bonding (2023 to 2033)
21. Global EV Battery Market Share By Form (2023 to 2033)
22. Global EV Battery Market Share By Regions (2023 to 2033)
23. Global EV Battery Market Share By Company (2023)
This study forecasts global, regional, and country revenue from 2020 to 2033. Brainy Insights has segmented the global EV battery market based on the below-mentioned segments:
Global EV Battery Market by Vehicle Type:
Global EV Battery Market by Battery Capacity:
Global EV Battery Market by Propulsion:
Global EV Battery Market by Battery Type:
Global EV Battery Market by Bonding:
Global EV Battery Market by Form:
Global EV Battery Market by Region:
Research has its special purpose to undertake marketing efficiently. In this competitive scenario, businesses need information across all industry verticals; the information about customer wants, market demand, competition, industry trends, distribution channels etc. This information needs to be updated regularly because businesses operate in a dynamic environment. Our organization, The Brainy Insights incorporates scientific and systematic research procedures in order to get proper market insights and industry analysis for overall business success. The analysis consists of studying the market from a miniscule level wherein we implement statistical tools which helps us in examining the data with accuracy and precision.
Our research reports feature both; quantitative and qualitative aspects for any market. Qualitative information for any market research process are fundamental because they reveal the customer needs and wants, usage and consumption for any product/service related to a specific industry. This in turn aids the marketers/investors in knowing certain perceptions of the customers. Qualitative research can enlighten about the different product concepts and designs along with unique service offering that in turn, helps define marketing problems and generate opportunities. On the other hand, quantitative research engages with the data collection process through interviews, e-mail interactions, surveys and pilot studies. Quantitative aspects for the market research are useful to validate the hypotheses generated during qualitative research method, explore empirical patterns in the data with the help of statistical tools, and finally make the market estimations.
The Brainy Insights offers comprehensive research and analysis, based on a wide assortment of factual insights gained through interviews with CXOs and global experts and secondary data from reliable sources. Our analysts and industry specialist assume vital roles in building up statistical tools and analysis models, which are used to analyse the data and arrive at accurate insights with exceedingly informative research discoveries. The data provided by our organization have proven precious to a diverse range of companies, facilitating them to address issues such as determining which products/services are the most appealing, whether or not customers use the product in the manner anticipated, the purchasing intentions of the market and many others.
Our research methodology encompasses an idyllic combination of primary and secondary initiatives. Key phases involved in this process are listed below:

The phase involves the gathering and collecting of market data and its related information with the help of different sources & research procedures.

The data procurement stage involves in data gathering and collecting through various data sources.
This stage involves in extensive research. These data sources includes:
Purchased Database: Purchased databases play a crucial role in estimating the market sizes irrespective of the domain. Our purchased database includes:
Primary Research: The Brainy Insights interacts with leading companies and experts of the concerned domain to develop the analyst team’s market understanding and expertise. It improves and substantiates every single data presented in the market reports. Primary research mainly involves in telephonic interviews, E-mail interactions and face-to-face interviews with the raw material providers, manufacturers/producers, distributors, & independent consultants. The interviews that we conduct provides valuable data on market size and industry growth trends prevailing in the market. Our organization also conducts surveys with the various industry experts in order to gain overall insights of the industry/market. For instance, in healthcare industry we conduct surveys with the pharmacists, doctors, surgeons and nurses in order to gain insights and key information of a medical product/device/equipment which the customers are going to usage. Surveys are conducted in the form of questionnaire designed by our own analyst team. Surveys plays an important role in primary research because surveys helps us to identify the key target audiences of the market. Additionally, surveys helps to identify the key target audience engaged with the market. Our survey team conducts the survey by targeting the key audience, thus gaining insights from them. Based on the perspectives of the customers, this information is utilized to formulate market strategies. Moreover, market surveys helps us to understand the current competitive situation of the industry. To be precise, our survey process typically involve with the 360 analysis of the market. This analytical process begins by identifying the prospective customers for a product or service related to the market/industry to obtain data on how a product/service could fit into customers’ lives.

Secondary Research: The secondary data sources includes information published by the on-profit organizations such as World bank, WHO, company fillings, investor presentations, annual reports, national government documents, statistical databases, blogs, articles, white papers and others. From the annual report, we analyse a company’s revenue to understand the key segment and market share of that organization in a particular region. We analyse the company websites and adopt the product mapping technique which is important for deriving the segment revenue. In the product mapping method, we select and categorize the products offered by the companies catering to domain specific market, deduce the product revenue for each of the companies so as to get overall estimation of the market size. We also source data and analyses trends based on information received from supply side and demand side intermediaries in the value chain. The supply side denotes the data gathered from supplier, distributor, wholesaler and the demand side illustrates the data gathered from the end customers for respective market domain.

The supply side for a domain specific market is analysed by:
The demand side for the market is estimated through:
In-house Library: Apart from these third-party sources, we have our in-house library of qualitative and quantitative information. Our in-house database includes market data for various industry and domains. These data are updated on regular basis as per the changing market scenario. Our library includes, historic databases, internal audit reports and archives.
Sometimes there are instances where there is no metadata or raw data available for any domain specific market. For those cases, we use our expertise to forecast and estimate the market size in order to generate comprehensive data sets. Our analyst team adopt a robust research technique in order to produce the estimates:
Data Synthesis: This stage involves the analysis & mapping of all the information obtained from the previous step. It also involves in scrutinizing the data for any discrepancy observed while data gathering related to the market. The data is collected with consideration to the heterogeneity of sources. Robust scientific techniques are in place for synthesizing disparate data sets and provide the essential contextual information that can orient market strategies. The Brainy Insights has extensive experience in data synthesis where the data passes through various stages:


Market Deduction & Formulation: The final stage comprises of assigning data points at appropriate market spaces so as to deduce feasible conclusions. Analyst perspective & subject matter expert based holistic form of market sizing coupled with industry analysis also plays a crucial role in this stage.
This stage involves in finalization of the market size and numbers that we have collected from data integration step. With data interpolation, it is made sure that there is no gap in the market data. Successful trend analysis is done by our analysts using extrapolation techniques, which provide the best possible forecasts for the market.
Data Validation & Market Feedback: Validation is the most important step in the process. Validation & re-validation via an intricately designed process helps us finalize data-points to be used for final calculations.

The Brainy Insights interacts with leading companies and experts of the concerned domain to develop the analyst team’s market understanding and expertise. It improves and substantiates every single data presented in the market reports. The data validation interview and discussion panels are typically composed of the most experienced industry members. The participants include, however, are not limited to:
Moreover, we always validate our data and findings through primary respondents from all the major regions we are working on.


Free Customization
Fortune 500 Clients
Free Yearly Update On Purchase Of Multi/Corporate License
Companies Served Till Date