- +1-315-215-1633
- sales@thebrainyinsights.com

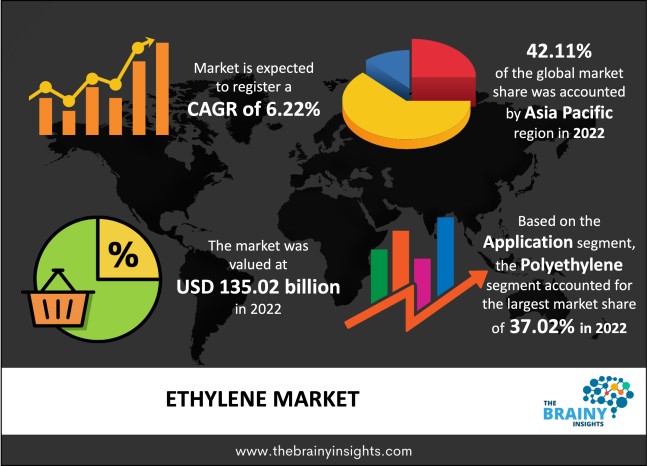
The global ethylene market was valued at USD 135.02 Billion in 2022 and grew at a CAGR of 6.22% from 2023 to 2032. The market is expected to reach USD 246.86 Billion by 2032. The demand for ethylene is increasing among end-user industries, such as agrochemicals, textile, automotive and packaging.
The most basic of the organic molecules is ethylene, which contains carbon-carbon double bonds. It is a combustible gas with an aroma and sweet flavour and is colourless. Ethylene is found naturally in petroleum and natural gas; it is also a hormone that naturally exists in plants, which restricts growth and encourages leaf fall, and in fruits, it encourages ripening. It is created by heating petroleum or natural gas to 800 and 900 degrees Celsius. This mixture of gases is then used to extract the ethylene. In the chemical industry, ethylene is widely used and is particularly useful in the production of polyethene; with its ability to control and stimulate flower opening, fruit ripening, and leaf shedding, ethylene functions as a trace level of the entire plant life. Ethylene is utilized to produce ethylene oxide, which produces ethylene glycol.
Get an overview of this study by requesting a free sample
Increasing use of ethylene in different applications: A comparatively minor quantity of commercially produced ethylene is utilized for the controlled ripening of tomatoes, citrus fruits, bananas, and many other vegetables, fruits, and flowers. However, most ethylene is used as a feedstock in producing polymers and industrial chemicals. During ripening, endogenous ethylene production in plant tissue often increases quickly. Before this natural increase occurs, applying ethylene to plants starts the ripening process and promotes endogenous ethylene production. Since the beginning of this century, ethylene has been employed frequently in this manner. The main derivative utilized in packaging is polyethylene, which comes in low-density, linear, low-density, and high-density forms.
Fluctuating cost of raw materials: Ethylene is manufactured using raw materials such as natural gas and carbon. Conventionally, petrochemical feedstocks like natural gas and coal manufacture ethylene. The cost of ethylene produced conventionally fluctuates due in part to the instability of petrochemical feedstock pricing, which hampers the demand for the final product.
Expansion of the chemical industry: One of the key forces behind the growth of many economic businesses is the chemical industry. The various end-user industries utilize ethylene for different applications such as packaging, construction, agrochemical, textile, etc. Over the past few decades, there has been a tremendous transition in the global chemical business. Several factors have contributed to the recent expansion of the chemical industry, including the use of better raw materials, notable advancements in chemical processes, and technical innovations. Economic causes will continue to play a significant role in the global rise of ethylene. Still, there will also be a surge in demand for agricultural produce, automobiles, packaging products, and textiles due to the world's constantly growing population.
The regions analyzed for the market include North America, Europe, South America, Asia Pacific, the Middle East, and Africa. Asia-Pacific emerged as the most significant ethylene market, with a 42.11% market revenue share in 2022.
Asia-Pacific region will account for the largest market share with revenue growth. Nations such as India, China and Japan have a tremendous demand for ethylene due to its primary usage in the packaging and agrochemical industry. Further, abundant raw materials have led to a high regional ethylene production. The rapid industrialization and urbanization in these countries have led to the growth of several end-user industries. In addition, the region is home to numerous agricultural nations, which provide lucrative opportunities to the market.
Asia-Pacific region Ethylene Market Share in 2022 - 42.11%
www.thebrainyinsights.com
Check the geographical analysis of this market by requesting a free sample
The application segment is divided into ethylene oxide, ethylene dichloride, polyethylene, ethyl benzene, vinyl acetate, and others. The polyethylene segment dominated the market, with a share of around 37.02% in 2022. One of the most widely used polymers in the world is polyethene, sometimes referred to as polyethene or polythene. Polyethylenes are known to be addition polymers and typically have a linear structure. Polyethylene is majorly used in packaging and textile applications.
The feedstock segment is divided into ethane, naphtha, propane, butane and others. The naphtha segment dominated the market, with a share of around 38.11% in 2022. It is a highly volatile and flammable liquid hydrocarbon combination. It is a component of kerosene and petrol and a raw ingredient for the chemical industry. Moreover, naphtha is employed as a diluent and solvent.
The distribution channel segment is divided into direct and indirect. The indirect segment dominated the market, with a share of around 74.11% in 2022. The chemical sector mainly operates through indirect distribution channels such as wholesalers, traders, distributors, etc. It is easier for buyers to purchase such chemicals from indirect sales channels.
Report Description:
| Attribute | Description |
|---|---|
| Market Size | Revenue (USD Billion) |
| Market size value in 2022 | USD 135.02 Billion |
| Market size value in 2032 | USD 246.86 Billion |
| CAGR (2023 to 2032) | 6.22% |
| Historical data | 2019-2021 |
| Base Year | 2022 |
| Forecast | 2023-2032 |
| Region | The regions analyzed for the market are Asia Pacific, Europe, South America, North America, and Middle East & Africa. Furthermore, the regions are further analyzed at the country level. |
| Segments | Application, Feedstock and Distribution Channel |
As per The Brainy Insights, the size of the ethylene market was valued USD 135.02 billion in 2022 to USD 246.86 billion by 2032.
Global ethylene market is growing at a CAGR of 6.22% during the forecast period 2023-2032.
Asia-Pacific region emerged as the largest market for the ethylene.
The market's growth will be influenced by the rising usage of ethylene in different applications.
The fluctuating cost of raw materials can hamper the market growth.
The rising investment in packaging industry is providing lucrative opportunities to the market.
1. Introduction
1.1. Objectives of the Study
1.2. Market Definition
1.3. Research Scope
1.4. Currency
1.5. Key Target Audience
2. Research Methodology and Assumptions
3. Executive Summary
4. Premium Insights
4.1. Porter’s Five Forces Analysis
4.2. Value Chain Analysis
4.3. Top Investment Pockets
4.3.1. Market Attractiveness Analysis by Application
4.3.2. Market Attractiveness Analysis by Feedstock
4.3.3. Market Attractiveness Analysis by Distribution Channel
4.3.4. Market Attractiveness Analysis by Region
4.4. Industry Trends
5. Market Dynamics
5.1. Market Evaluation
5.2. Drivers
5.2.1. Increasing use of ethylene in different applications
5.3. Restraints
5.3.1. Fluctuating cost of raw materials
5.4. Opportunities
5.4.1. Increasing investment in packaging industry
5.5. Challenges
5.5.1. Stringent regulations
6. Global Ethylene Market Analysis and Forecast, By Application
6.1. Segment Overview
6.2. Ethylene Oxide
6.3. Ethylene Dichloride
6.4. Polyethylene
6.5. Ethyl Benzene
6.6. Vinyl Acetate
6.7. Others
7. Global Ethylene Market Analysis and Forecast, By Feedstock
7.1. Segment Overview
7.2. Ethane
7.3. Naphtha
7.4. Propane
7.5. Butane
7.6. Others
8. Global Ethylene Market Analysis and Forecast, By Distribution Channel
8.1. Segment Overview
8.2. Direct
8.3. Indirect
9. Global Ethylene Market Analysis and Forecast, By Regional Analysis
9.1. Segment Overview
9.2. North America
9.2.1. U.S.
9.2.2. Canada
9.2.3. Mexico
9.3. Europe
9.3.1. Germany
9.3.2. France
9.3.3. U.K.
9.3.4. Italy
9.3.5. Spain
9.4. Asia-Pacific
9.4.1. Japan
9.4.2. China
9.4.3. India
9.5. South America
9.5.1. Brazil
9.6. Middle East and Africa
9.6.1. UAE
9.6.2. South Africa
10. Global Ethylene Market-Competitive Landscape
10.1. Overview
10.2. Market Share of Key Players in the Ethylene Market
10.2.1. Global Company Market Share
10.2.2. North America Company Market Share
10.2.3. Europe Company Market Share
10.2.4. APAC Company Market Share
10.3. Competitive Situations and Trends
10.3.1. Product Launches and Developments
10.3.2. Partnerships, Collaborations, and Agreements
10.3.3. Mergers & Acquisitions
10.3.4. Expansions
11. Company Profiles
11.1. Exxon Mobil Corporation
11.1.1. Business Overview
11.1.2. Company Snapshot
11.1.3. Company Market Share Analysis
11.1.4. Company Product Portfolio
11.1.5. Recent Developments
11.1.6. SWOT Analysis
11.2. Lonza Group
11.2.1. Business Overview
11.2.2. Company Snapshot
11.2.3. Company Market Share Analysis
11.2.4. Company Product Portfolio
11.2.5. Recent Developments
11.2.6. SWOT Analysis
11.3. Saudi Basic Industries Corp
11.3.1. Business Overview
11.3.2. Company Snapshot
11.3.3. Company Market Share Analysis
11.3.4. Company Product Portfolio
11.3.5. Recent Developments
11.3.6. SWOT Analysis
11.4. DuPont Inc.
11.4.1. Business Overview
11.4.2. Company Snapshot
11.4.3. Company Market Share Analysis
11.4.4. Company Product Portfolio
11.4.5. Recent Developments
11.4.6. SWOT Analysis
11.5. China Petroleum & Chemical Corporation
11.5.1. Business Overview
11.5.2. Company Snapshot
11.5.3. Company Market Share Analysis
11.5.4. Company Product Portfolio
11.5.5. Recent Developments
11.5.6. SWOT Analysis
11.6. Royal Dutch Shell plc
11.6.1. Business Overview
11.6.2. Company Snapshot
11.6.3. Company Market Share Analysis
11.6.4. Company Product Portfolio
11.6.5. Recent Developments
11.6.6. SWOT Analysis
11.7. Chevron Phillips Chemical Company LLC
11.7.1. Business Overview
11.7.2. Company Snapshot
11.7.3. Company Market Share Analysis
11.7.4. Company Product Portfolio
11.7.5. Recent Developments
11.7.6. SWOT Analysis
11.8. The National Petrochemical Company
11.8.1. Business Overview
11.8.2. Company Snapshot
11.8.3. Company Market Share Analysis
11.8.4. Company Product Portfolio
11.8.5. Recent Developments
11.8.6. SWOT Analysis
11.9. Lyondell Basell Industries N.V.
11.9.1. Business Overview
11.9.2. Company Snapshot
11.9.3. Company Market Share Analysis
11.9.4. Company Product Portfolio
11.9.5. Recent Developments
11.9.6. SWOT Analysis
11.10. BASF SE
11.10.1. Business Overview
11.10.2. Company Snapshot
11.10.3. Company Market Share Analysis
11.10.4. Company Product Portfolio
11.10.5. Recent Developments
11.10.6. SWOT Analysis
List of Table
1. Global Ethylene Market, By Application, 2019-2032 (USD Billion)
2. Global Ethylene Oxide, Ethylene Market, By Region, 2019-2032 (USD Billion)
3. Global Ethylene Dichloride, Ethylene Market, By Region, 2019-2032 (USD Billion)
4. Global Polyethylene, Ethylene Market, By Region, 2019-2032 (USD Billion)
5. Global Ethyl Benzene, Ethylene Market, By Region, 2019-2032 (USD Billion)
6. Global Vinyl Acetate, Ethylene Market, By Region, 2019-2032 (USD Billion)
7. Global Others, Ethylene Market, By Region, 2019-2032 (USD Billion)
8. Global Ethylene Market, By Feedstock , 2019-2032 (USD Billion)
9. Global Ethane, Ethylene Market, By Region, 2019-2032 (USD Billion)
10. Global Naphtha, Ethylene Market, By Region, 2019-2032 (USD Billion)
11. Global Propane, Ethylene Market, By Region, 2019-2032 (USD Billion)
12. Global Butane, Ethylene Market, By Region, 2019-2032 (USD Billion)
13. Global Others, Ethylene Market, By Region, 2019-2032 (USD Billion)
14. Global Ethylene Market, By Distribution Channel, 2019-2032 (USD Billion)
15. Global Direct, Ethylene Market, By Region, 2019-2032 (USD Billion)
16. Global Indirect, Ethylene Market, By Region, 2019-2032 (USD Billion)
17. Global Ethylene Market, By Region, 2019-2032 (USD Billion)
18. North America Ethylene Market, By Application, 2019-2032 (USD Billion)
19. North America Ethylene Market, By Feedstock , 2019-2032 (USD Billion)
20. North America Ethylene Market, By Distribution Channel, 2019-2032 (USD Billion)
21. U.S. Ethylene Market, By Application, 2019-2032 (USD Billion)
22. U.S. Ethylene Market, By Feedstock , 2019-2032 (USD Billion)
23. U.S. Ethylene Market, By Distribution Channel, 2019-2032 (USD Billion)
24. Canada Ethylene Market, By Application, 2019-2032 (USD Billion)
25. Canada Ethylene Market, By Feedstock , 2019-2032 (USD Billion)
26. Canada Ethylene Market, By Distribution Channel, 2019-2032 (USD Billion)
27. Mexico Ethylene Market, By Application, 2019-2032 (USD Billion)
28. Mexico Ethylene Market, By Feedstock , 2019-2032 (USD Billion)
29. Mexico Ethylene Market, By Distribution Channel, 2019-2032 (USD Billion)
30. Europe Ethylene Market, By Application, 2019-2032 (USD Billion)
31. Europe Ethylene Market, By Feedstock , 2019-2032 (USD Billion)
32. Europe Ethylene Market, By Distribution Channel, 2019-2032 (USD Billion)
33. Germany Ethylene Market, By Application, 2019-2032 (USD Billion)
34. Germany Ethylene Market, By Feedstock , 2019-2032 (USD Billion)
35. Germany Ethylene Market, By Distribution Channel, 2019-2032 (USD Billion)
36. France Ethylene Market, By Application, 2019-2032 (USD Billion)
37. France Ethylene Market, By Feedstock , 2019-2032 (USD Billion)
38. France Ethylene Market, By Distribution Channel, 2019-2032 (USD Billion)
39. U.K. Ethylene Market, By Application, 2019-2032 (USD Billion)
40. U.K. Ethylene Market, By Feedstock , 2019-2032 (USD Billion)
41. U.K. Ethylene Market, By Distribution Channel, 2019-2032 (USD Billion)
42. Italy Ethylene Market, By Application, 2019-2032 (USD Billion)
43. Italy Ethylene Market, By Feedstock , 2019-2032 (USD Billion)
44. Italy Ethylene Market, By Distribution Channel, 2019-2032 (USD Billion)
45. Spain Ethylene Market, By Application, 2019-2032 (USD Billion)
46. Spain Ethylene Market, By Feedstock , 2019-2032 (USD Billion)
47. Spain Ethylene Market, By Distribution Channel, 2019-2032 (USD Billion)
48. Asia Pacific Ethylene Market, By Application, 2019-2032 (USD Billion)
49. Asia Pacific Ethylene Market, By Feedstock , 2019-2032 (USD Billion)
50. Asia Pacific Ethylene Market, By Distribution Channel, 2019-2032 (USD Billion)
51. Japan Ethylene Market, By Application, 2019-2032 (USD Billion)
52. Japan Ethylene Market, By Feedstock , 2019-2032 (USD Billion)
53. Japan Ethylene Market, By Distribution Channel, 2019-2032 (USD Billion)
54. China Ethylene Market, By Application, 2019-2032 (USD Billion)
55. China Ethylene Market, By Feedstock , 2019-2032 (USD Billion)
56. China Ethylene Market, By Distribution Channel, 2019-2032 (USD Billion)
57. India Ethylene Market, By Application, 2019-2032 (USD Billion)
58. India Ethylene Market, By Feedstock , 2019-2032 (USD Billion)
59. India Ethylene Market, By Distribution Channel, 2019-2032 (USD Billion)
60. South America Ethylene Market, By Application, 2019-2032 (USD Billion)
61. South America Ethylene Market, By Feedstock , 2019-2032 (USD Billion)
62. South America Ethylene Market, By Distribution Channel, 2019-2032 (USD Billion)
63. Brazil Ethylene Market, By Application, 2019-2032 (USD Billion)
64. Brazil Ethylene Market, By Feedstock , 2019-2032 (USD Billion)
65. Brazil Ethylene Market, By Distribution Channel, 2019-2032 (USD Billion)
66. Middle East and Africa Ethylene Market, By Application, 2019-2032 (USD Billion)
67. Middle East and Africa Ethylene Market, By Feedstock , 2019-2032 (USD Billion)
68. Middle East and Africa Ethylene Market, By Distribution Channel, 2019-2032 (USD Billion)
69. UAE Ethylene Market, By Application, 2019-2032 (USD Billion)
70. UAE Ethylene Market, By Feedstock , 2019-2032 (USD Billion)
71. UAE Ethylene Market, By Distribution Channel, 2019-2032 (USD Billion)
72. South Africa Ethylene Market, By Application, 2019-2032 (USD Billion)
73. South Africa Ethylene Market, By Feedstock , 2019-2032 (USD Billion)
74. South Africa Ethylene Market, By Distribution Channel, 2019-2032 (USD Billion)
List of Figures
1. Global Ethylene Market Segmentation
2. Ethylene Market: Research Methodology
3. Market Size Estimation Methodology: Bottom-Up Approach
4. Market Size Estimation Methodology: Top-Down Approach
5. Data Triangulation
6. Porter’s Five Forces Analysis
7. Value Chain Analysis
8. Global Ethylene Market Attractiveness Analysis by Application
9. Global Ethylene Market Attractiveness Analysis by Feedstock
10. Global Ethylene Market Attractiveness Analysis by Distribution Channel
11. Global Ethylene Market Attractiveness Analysis by Region
12. Global Ethylene Market: Dynamics
13. Global Ethylene Market Share by Application (2022 & 2032)
14. Global Ethylene Market Share by Feedstock (2022 & 2032)
15. Global Ethylene Market Share by Distribution Channel (2022 & 2032)
16. Global Ethylene Market Share by Regions (2022 & 2032)
17. Global Ethylene Market Share by Company (2022)
This study forecasts revenue at global, regional, and country levels from 2019 to 2032. The Brainy Insights has segmented the global ethylene market based on below mentioned segments:
Global Ethylene Market by Application:
Global Ethylene Market by Feedstock:
Global Ethylene Market by Distribution Channel:
Global Ethylene Market by Region:
Research has its special purpose to undertake marketing efficiently. In this competitive scenario, businesses need information across all industry verticals; the information about customer wants, market demand, competition, industry trends, distribution channels etc. This information needs to be updated regularly because businesses operate in a dynamic environment. Our organization, The Brainy Insights incorporates scientific and systematic research procedures in order to get proper market insights and industry analysis for overall business success. The analysis consists of studying the market from a miniscule level wherein we implement statistical tools which helps us in examining the data with accuracy and precision.
Our research reports feature both; quantitative and qualitative aspects for any market. Qualitative information for any market research process are fundamental because they reveal the customer needs and wants, usage and consumption for any product/service related to a specific industry. This in turn aids the marketers/investors in knowing certain perceptions of the customers. Qualitative research can enlighten about the different product concepts and designs along with unique service offering that in turn, helps define marketing problems and generate opportunities. On the other hand, quantitative research engages with the data collection process through interviews, e-mail interactions, surveys and pilot studies. Quantitative aspects for the market research are useful to validate the hypotheses generated during qualitative research method, explore empirical patterns in the data with the help of statistical tools, and finally make the market estimations.
The Brainy Insights offers comprehensive research and analysis, based on a wide assortment of factual insights gained through interviews with CXOs and global experts and secondary data from reliable sources. Our analysts and industry specialist assume vital roles in building up statistical tools and analysis models, which are used to analyse the data and arrive at accurate insights with exceedingly informative research discoveries. The data provided by our organization have proven precious to a diverse range of companies, facilitating them to address issues such as determining which products/services are the most appealing, whether or not customers use the product in the manner anticipated, the purchasing intentions of the market and many others.
Our research methodology encompasses an idyllic combination of primary and secondary initiatives. Key phases involved in this process are listed below:

The phase involves the gathering and collecting of market data and its related information with the help of different sources & research procedures.

The data procurement stage involves in data gathering and collecting through various data sources.
This stage involves in extensive research. These data sources includes:
Purchased Database: Purchased databases play a crucial role in estimating the market sizes irrespective of the domain. Our purchased database includes:
Primary Research: The Brainy Insights interacts with leading companies and experts of the concerned domain to develop the analyst team’s market understanding and expertise. It improves and substantiates every single data presented in the market reports. Primary research mainly involves in telephonic interviews, E-mail interactions and face-to-face interviews with the raw material providers, manufacturers/producers, distributors, & independent consultants. The interviews that we conduct provides valuable data on market size and industry growth trends prevailing in the market. Our organization also conducts surveys with the various industry experts in order to gain overall insights of the industry/market. For instance, in healthcare industry we conduct surveys with the pharmacists, doctors, surgeons and nurses in order to gain insights and key information of a medical product/device/equipment which the customers are going to usage. Surveys are conducted in the form of questionnaire designed by our own analyst team. Surveys plays an important role in primary research because surveys helps us to identify the key target audiences of the market. Additionally, surveys helps to identify the key target audience engaged with the market. Our survey team conducts the survey by targeting the key audience, thus gaining insights from them. Based on the perspectives of the customers, this information is utilized to formulate market strategies. Moreover, market surveys helps us to understand the current competitive situation of the industry. To be precise, our survey process typically involve with the 360 analysis of the market. This analytical process begins by identifying the prospective customers for a product or service related to the market/industry to obtain data on how a product/service could fit into customers’ lives.

Secondary Research: The secondary data sources includes information published by the on-profit organizations such as World bank, WHO, company fillings, investor presentations, annual reports, national government documents, statistical databases, blogs, articles, white papers and others. From the annual report, we analyse a company’s revenue to understand the key segment and market share of that organization in a particular region. We analyse the company websites and adopt the product mapping technique which is important for deriving the segment revenue. In the product mapping method, we select and categorize the products offered by the companies catering to domain specific market, deduce the product revenue for each of the companies so as to get overall estimation of the market size. We also source data and analyses trends based on information received from supply side and demand side intermediaries in the value chain. The supply side denotes the data gathered from supplier, distributor, wholesaler and the demand side illustrates the data gathered from the end customers for respective market domain.

The supply side for a domain specific market is analysed by:
The demand side for the market is estimated through:
In-house Library: Apart from these third-party sources, we have our in-house library of qualitative and quantitative information. Our in-house database includes market data for various industry and domains. These data are updated on regular basis as per the changing market scenario. Our library includes, historic databases, internal audit reports and archives.
Sometimes there are instances where there is no metadata or raw data available for any domain specific market. For those cases, we use our expertise to forecast and estimate the market size in order to generate comprehensive data sets. Our analyst team adopt a robust research technique in order to produce the estimates:
Data Synthesis: This stage involves the analysis & mapping of all the information obtained from the previous step. It also involves in scrutinizing the data for any discrepancy observed while data gathering related to the market. The data is collected with consideration to the heterogeneity of sources. Robust scientific techniques are in place for synthesizing disparate data sets and provide the essential contextual information that can orient market strategies. The Brainy Insights has extensive experience in data synthesis where the data passes through various stages:


Market Deduction & Formulation: The final stage comprises of assigning data points at appropriate market spaces so as to deduce feasible conclusions. Analyst perspective & subject matter expert based holistic form of market sizing coupled with industry analysis also plays a crucial role in this stage.
This stage involves in finalization of the market size and numbers that we have collected from data integration step. With data interpolation, it is made sure that there is no gap in the market data. Successful trend analysis is done by our analysts using extrapolation techniques, which provide the best possible forecasts for the market.
Data Validation & Market Feedback: Validation is the most important step in the process. Validation & re-validation via an intricately designed process helps us finalize data-points to be used for final calculations.

The Brainy Insights interacts with leading companies and experts of the concerned domain to develop the analyst team’s market understanding and expertise. It improves and substantiates every single data presented in the market reports. The data validation interview and discussion panels are typically composed of the most experienced industry members. The participants include, however, are not limited to:
Moreover, we always validate our data and findings through primary respondents from all the major regions we are working on.


Free Customization
Fortune 500 Clients
Free Yearly Update On Purchase Of Multi/Corporate License
Companies Served Till Date