- +1-315-215-1633
- sales@thebrainyinsights.com

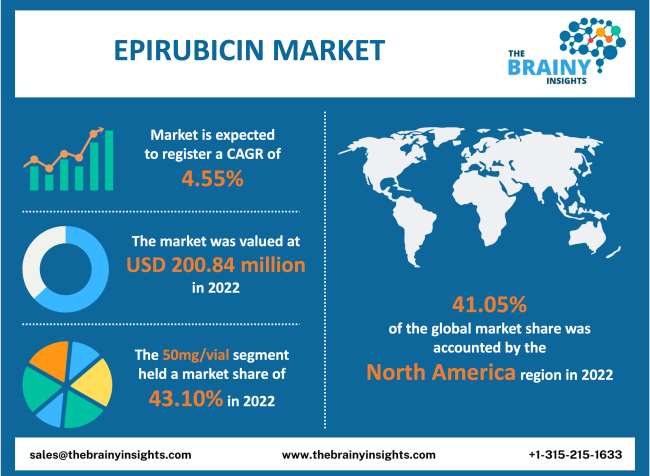
The global epirubicin market is expected to grow from USD 200.84 million in 2022 to USD 286.71 million by 2030, at a CAGR of 4.55% during the forecast period 2022-2030. The North American region is expected to dominate the market in 2022.
Epirubicin is a chemotherapeutic medication used in the treatment of cancer. This medicine is categorized as an antitumor anthracyline antibiotic. Epirubicin is administered intravenously. The medicine is administered over a period using a syringe needle that is directly inserted into the tubing of an IV solution that is freely flowing into a vein or central line. A well-trained nurse or doctor must administer epirubicin medication. The height, general health, weight, any underlying medical conditions, the kind of cancer being treated, and other factors will all affect how much epirubicin they will receive. Epirubicin causes DNA damage in the cells affected by cancer. This prevents the cancer cells from proliferating or multiplying. Anthracycline topoisomerase II inhibitor epirubicin is used as an adjuvant to treat axillary node metastases in patients who have had their original breast cancer surgically removed. Drugs in this class generally interact with DNA by several distinct mechanisms, such as intercalation, DNA strand breaking, and inhibition of topoisomerase II.
Get an overview of this study by requesting a free sample
Increasing breast cancer cases: The surge in breast cancer cases has increased the demand for epirubicin. Additionally, the market in developed regions has grown due to customers' growing awareness, particularly among the high-income category. Breast cancer is the most prevalent cancer among the women population in the U.S. 30% of all new cases are among females each year. Women in their middle years and older tend to develop breast cancer. The second most common malignancy among women is breast cancer. A woman has a 2.5% probability of dying from breast cancer. Since 1989, there has been a steady fall in breast cancer deaths, with a projected 45% decrease by 2022. Epirubicin has undergone thorough testing in breast cancer patients. It works well as adjuvant therapy in patients with early breast cancer and the management of metastatic illness.
Potential side-effects– Epirubicin may have harmful consequences on the patient’s heart, and the condition may not always be treatable and may take months or years to recover. Some of the common side effects are swelling, rapid weight gain, nausea, loss of hair, ulcers and blisters in the mouth, dizziness, or shortness of breath.
Increasing research and development in the pharmaceutical industry- Numerous industry participants reported record sales, primarily due to solid growth in developing nations like China and India, rising government spending on pharmaceutical R&D in those nations, increasing life science R&D expenditure, developing drug discovery and clinical diagnostics field, technological advancements, emerging applications, growing ageing populations, rising cancer prevalence, and changing demographics. Research breakthroughs in the biological sciences and technological improvements like the mapping of the human genome and the emergence of proteomics have contributed to the expansion of the biotechnology sector. Due to the need for high-throughput pharmaceuticals in high-end research initiatives, the market for epirubicin is further fueled.
Stringent regulations for product approval - The concerned regional agencies must approve the epirubicin so it can be used for commercial purposes. Epirubicin is used in critical treatment procedures for cancer. Thus, manufacturers must receive product approvals from different agencies to sell their products in each region.
The regions analyzed for the market include North America, Europe, South America, Asia Pacific, the Middle East, and Africa. The North American region emerged as the most significant global epirubicin market, with a market revenue share of 41.05% in 2022. The region has a high epirubicin market growth rate due to the presence of significant market players. The North American market will be driven by the presence of synthetic biology research and development facilities in infrastructure to support the epirubicin market. The growing incidence of various cancers in regional countries has increased the use of epirubicin. The Asia-Pacific region is anticipated to grow lucratively during the forecast period. The market is witnessing a lucrative growth rate due to a couple of factors, such as rising funding for research and development and increasing awareness regarding cancer treatment in countries like Japan and China.
North America region Epirubicin Market Share in 2022 - 41.05%
www.thebrainyinsights.com
Check the geographical analysis of this market by requesting a free sample
The dosage segment is divided into 10mg/vial, 50mg/vial, 100mg/vial and 200mg/vial. The 50mg/vial segment dominated the market with a revenue share of around 43.10% in 2022. The 50mg/vial is mainly used for breast cancer treatment. It is found to be effective and lasts for about five days.
The product segment is divided into chromomycins, anthracyclines and others. The chromomycins segment dominated the market with a market share of 62.15% in 2022. Chromomycins are the most effective epirubicin and are essential for treating breast cancer. It binds to the DNA reversibly, which generates maximum emission and excitation wavelength.
The application segment includes liver cancer, breast cancer, bladder cancer and others. The breast cancer segment dominated the market with a revenue share of 45.02% in 2022. Breast cancer develops in the breast and spreads to other body parts. When cells proliferate out of control, cancer develops. Breast cancer affects almost exclusively women, although it can also affect men.
The distribution channel segment includes hospital pharmacies, retail pharmacies and online pharmacies. The hospital pharmacies segment dominated the market with a revenue share of 53.06% in 2022. Hospital pharmacies have a higher demand for epirubicin due to the surge in breast cancer treatment. The need for regenerative medicine has increased drastically. Thus, hospital pharmacy invests in epirubicin.
| Attribute | Description |
|---|---|
| Market Size | Revenue (USD Million) |
| Market size value in 2022 | USD 200.84 Million |
| Market size value in 2030 | USD 286.71 Million |
| CAGR (2022 to 2030) | 4.55% |
| Historical data | 2019-2020 |
| Base Year | 2021 |
| Forecast | 2022-2030 |
| Segments | The research segment is based on dosage, product, application and distribution channel. |
| Regional Segments | The regions examined for the market are Europe, Asia Pacific, North America, South America, and Middle East & Africa. |
As per The Brainy Insights, the size of the epirubicin market was valued 200.84 million in 2022 to USD 286.71 million by 2030.
Global epirubicin market is growing at a CAGR of 4.55% during the forecast period 2022-2030.
North America region emerged as the largest market for the epirubicin.
The market's growth will be influenced by the growing prevalence of breast cancer.
The prevalence of potential side-effects could hamper the market growth.
The increasing investments in synthetic biology is providing huge opportunities to the market.
Key players are Teva Pharmaceutical Industries Ltd., Pfizer Inc, Salius Pharma Pvt. Ltd., Mylan N.V., Fresenius Kabi AG, Hikma Pharmaceuticals PLC, Miracalus Pharma Pvt. Ltd., Areva Pharmaceuticals, Hologic Inc., among others.
1. Introduction
1.1. Objective of the Study
1.2. Market Definition
1.3. Research Scope
1.4. Currency
1.5. Key Target Audience
2. Research Methodology and Assumptions
3. Executive Summary
4. Premium Insights
4.1. Porter’s Five Forces Analysis
4.2. Value Chain Analysis
4.3. Top Investment Pockets
4.3.1. Market Attractiveness Analysis By Dosage
4.3.2. Market Attractiveness Analysis By Product
4.3.3. Market Attractiveness Analysis By Application
4.3.4. Market Attractiveness Analysis By Distribution Channel
4.3.5. Market Attractiveness Analysis By Region
4.4. Industry Trends
5. Market Dynamics
5.1. Market Evaluation
5.2. Drivers
5.2.1. Increasing prevalence of breast cancer
5.3. Restraints
5.3.1. Potential side effects
5.4. Opportunities
5.4.1. Increasing investments in cancer treatment technology
5.5. Challenges
5.5.1. Stringent clinical regulations
6. Global Epirubicin Market Analysis and Forecast, By Dosage
6.1. Segment Overview
6.2. 10Mg/Vial
6.3. 50Mg/Vial
6.4. 100Mg/Vial
6.5. 200Mg/Vial
7. Global Epirubicin Market Analysis and Forecast, By Product
7.1. Segment Overview
7.2. Chromomycins
7.3. Anthracyclines
7.4. Others
8. Global Epirubicin Market Analysis and Forecast, By Application
8.1. Segment Overview
8.2. Liver Cancer
8.3. Breast Cancer
8.4. Bladder Cancer
8.5. Others
9. Global Epirubicin Market Analysis and Forecast, By Distribution Channel
9.1. Segment Overview
9.2. Hospital Pharmacies
9.3. Retail Pharmacies
9.4. Online Pharmacies
10. Global Epirubicin Market Analysis and Forecast, By Regional Analysis
10.1. Segment Overview
10.2. North America
10.2.1. U.S.
10.2.2. Canada
10.2.3. Mexico
10.3. Europe
10.3.1. Germany
10.3.2. France
10.3.3. U.K.
10.3.4. Italy
10.3.5. Spain
10.4. Asia-Pacific
10.4.1. Japan
10.4.2. China
10.4.3. India
10.5. South America
10.5.1. Brazil
10.6. Middle East and Africa
10.6.1. UAE
10.6.2. South Africa
11. Global Epirubicin Market-Competitive Landscape
11.1. Overview
11.2. Market Share of Key Players in the Epirubicin Market
11.2.1. Global Company Market Share
11.2.2. North America Company Market Share
11.2.3. Europe Company Market Share
11.2.4. APAC Company Market Share
11.3. Competitive Situations and Trends
11.3.1. Product Launches and Developments
11.3.2. Partnerships, Collaborations, and Agreements
11.3.3. Mergers & Acquisitions
11.3.4. Expansions
12. Company Profiles
12.1. Teva Pharmaceutical Industries Ltd.
12.1.1. Business Overview
12.1.2. Company Snapshot
12.1.3. Company Market Share Analysis
12.1.4. Company Product Portfolio
12.1.5. Recent Developments
12.1.6. SWOT Analysis
12.2. Pfizer Inc
12.2.1. Business Overview
12.2.2. Company Snapshot
12.2.3. Company Market Share Analysis
12.2.4. Company Product Portfolio
12.2.5. Recent Developments
12.2.6. SWOT Analysis
12.3. Salius Pharma Pvt. Ltd.
12.3.1. Business Overview
12.3.2. Company Snapshot
12.3.3. Company Market Share Analysis
12.3.4. Company Product Portfolio
12.3.5. Recent Developments
12.3.6. SWOT Analysis
12.4. Mylan N.V.
12.4.1. Business Overview
12.4.2. Company Snapshot
12.4.3. Company Market Share Analysis
12.4.4. Company Product Portfolio
12.4.5. Recent Developments
12.4.6. SWOT Analysis
12.5. Fresenius Kabi AG.
1.1.1. Business Overview
1.1.2. Company Snapshot
1.1.3. Company Market Share Analysis
1.1.4. Company Product Portfolio
1.1.5. Recent Developments
1.1.6. SWOT Analysis
12.6. Hikma Pharmaceuticals PLC
12.6.1. Business Overview
12.6.2. Company Snapshot
12.6.3. Company Market Share Analysis
12.6.4. Company Product Portfolio
12.6.5. Recent Developments
12.6.6. SWOT Analysis
12.7. Miracalus Pharma Pvt. Ltd.
12.7.1. Business Overview
12.7.2. Company Snapshot
12.7.3. Company Market Share Analysis
12.7.4. Company Product Portfolio
12.7.5. Recent Developments
12.7.6. SWOT Analysis
12.8. Areva Pharmaceuticals
12.8.1. Business Overview
12.8.2. Company Snapshot
12.8.3. Company Market Share Analysis
12.8.4. Company Product Portfolio
12.8.5. Recent Developments
12.8.6. SWOT Analysis
12.9. Hologic Inc
12.9.1. Business Overview
12.9.2. Company Snapshot
12.9.3. Company Market Share Analysis
12.9.4. Company Product Portfolio
12.9.5. Recent Developments
12.9.6. SWOT Analysis
List of Table
1. Global Epirubicin Market, By Dosage, 2019-2030 (USD Million)
2. Global 10Mg/Vial, Epirubicin Market, By Region, 2019-2030 (USD Million)
3. Global 50Mg/Vial, Epirubicin Market, By Region, 2019-2030 (USD Million)
4. Global 100Mg/Vial, Epirubicin Market, By Region, 2019-2030 (USD Million)
5. Global 200Mg/Vial, Epirubicin Market, By Region, 2019-2030 (USD Million)
6. Global Epirubicin Market, By Product, 2019-2030 (USD Million)
7. Global Chromomycins, Epirubicin Market, By Region, 2019-2030 (USD Million)
8. Global Anthracyclines, Epirubicin Market, By Region, 2019-2030 (USD Million)
9. Global Others, Epirubicin Market, By Region, 2019-2030 (USD Million)
10. Global Epirubicin Market, By Application, 2019-2030 (USD Million)
11. Global Liver Cancer, Epirubicin Market, By Region, 2019-2030 (USD Million)
12. Global Breast Cancer, Epirubicin Market, By Region, 2019-2030 (USD Million)
13. Global Bladder Cancer, Epirubicin Market, By Region, 2019-2030 (USD Million)
14. Global Others, Epirubicin Market, By Region, 2019-2030 (USD Million)
15. Global Epirubicin Market, By Distribution Channel, 2019-2030 (USD Million)
16. Global Hospital Pharmacies, Epirubicin Market, By Region, 2019-2030 (USD Million)
17. Global Retail Pharmacies, Epirubicin Market, By Region, 2019-2030 (USD Million)
18. Global Online Pharmacies, Epirubicin Market, By Region, 2019-2030 (USD Million)
19. Global Epirubicin Market, By Region, 2019-2030 (USD Million)
20. North America Epirubicin Market, By Dosage, 2019-2030 (USD Million)
21. North America Epirubicin Market, By Product, 2019-2030 (USD Million)
22. North America Epirubicin Market, By Application, 2019-2030 (USD Million)
23. North America Epirubicin Market, By Distribution Channel, 2019-2030 (USD Million)
24. U.S. Epirubicin Market, By Dosage, 2019-2030 (USD Million)
25. U.S. Epirubicin Market, By Product, 2019-2030 (USD Million)
26. U.S. Epirubicin Market, By Application, 2019-2030 (USD Million)
27. U.S. Epirubicin Market, By Distribution Channel, 2019-2030 (USD Million)
28. Canada Epirubicin Market, By Dosage, 2019-2030 (USD Million)
29. Canada Epirubicin Market, By Product, 2019-2030 (USD Million)
30. Canada Epirubicin Market, By Application, 2019-2030 (USD Million)
31. Canada Epirubicin Market, By Distribution Channel, 2019-2030 (USD Million)
32. Mexico Epirubicin Market, By Dosage, 2019-2030 (USD Million)
33. Mexico Epirubicin Market, By Product, 2019-2030 (USD Million)
34. Mexico Epirubicin Market, By Application, 2019-2030 (USD Million)
35. Mexico Epirubicin Market, By Distribution Channel, 2019-2030 (USD Million)
36. Europe Epirubicin Market, By Dosage, 2019-2030 (USD Million)
37. Europe Epirubicin Market, By Product, 2019-2030 (USD Million)
38. Europe Epirubicin Market, By Application, 2019-2030 (USD Million)
39. Europe Epirubicin Market, By Distribution Channel, 2019-2030 (USD Million)
40. Germany Epirubicin Market, By Dosage, 2019-2030 (USD Million)
41. Germany Epirubicin Market, By Product, 2019-2030 (USD Million)
42. Germany Epirubicin Market, By Application, 2019-2030 (USD Million)
43. Germany Epirubicin Market, By Distribution Channel, 2019-2030 (USD Million)
44. France Epirubicin Market, By Dosage, 2019-2030 (USD Million)
45. France Epirubicin Market, By Product, 2019-2030 (USD Million)
46. France Epirubicin Market, By Application, 2019-2030 (USD Million)
47. France Epirubicin Market, By Distribution Channel, 2019-2030 (USD Million)
48. U.K. Epirubicin Market, By Dosage, 2019-2030 (USD Million)
49. U.K. Epirubicin Market, By Product, 2019-2030 (USD Million)
50. U.K. Epirubicin Market, By Application, 2019-2030 (USD Million)
51. U.K. Epirubicin Market, By Distribution Channel, 2019-2030 (USD Million)
52. Italy Epirubicin Market, By Dosage, 2019-2030 (USD Million)
53. Italy Epirubicin Market, By Product, 2019-2030 (USD Million)
54. Italy Epirubicin Market, By Application, 2019-2030 (USD Million)
55. Italy Epirubicin Market, By Distribution Channel, 2019-2030 (USD Million)
56. Spain Epirubicin Market, By Dosage, 2019-2030 (USD Million)
57. Spain Epirubicin Market, By Product, 2019-2030 (USD Million)
58. Spain Epirubicin Market, By Application, 2019-2030 (USD Million)
59. Spain Epirubicin Market, By Distribution Channel, 2019-2030 (USD Million)
60. Asia Pacific Epirubicin Market, By Dosage, 2019-2030 (USD Million)
61. Asia Pacific Epirubicin Market, By Product, 2019-2030 (USD Million)
62. Asia Pacific Epirubicin Market, By Application, 2019-2030 (USD Million)
63. Asia Pacific Epirubicin Market, By Distribution Channel, 2019-2030 (USD Million)
64. Japan Epirubicin Market, By Dosage, 2019-2030 (USD Million)
65. Japan Epirubicin Market, By Product, 2019-2030 (USD Million)
66. Japan Epirubicin Market, By Application 2019-2030 (USD Million)
67. Japan Epirubicin Market, By Distribution Channel, 2019-2030 (USD Million)
68. China Epirubicin Market, By Dosage, 2019-2030 (USD Million)
69. China Epirubicin Market, By Product, 2019-2030 (USD Million)
70. China Epirubicin Market, By Application, 2019-2030 (USD Million)
71. China Epirubicin Market, By Distribution Channel, 2019-2030 (USD Million)
72. India Epirubicin Market, By Dosage, 2019-2030 (USD Million)
73. India Epirubicin Market, By Product, 2019-2030 (USD Million)
74. India Epirubicin Market, By Application, 2019-2030 (USD Million)
75. India Epirubicin Market, By Distribution Channel, 2019-2030 (USD Million)
76. South America Epirubicin Market, By Dosage, 2019-2030 (USD Million)
77. South America Epirubicin Market, By Product, 2019-2030 (USD Million)
78. South America Epirubicin Market, By Application, 2019-2030 (USD Million)
79. South America Epirubicin Market, By Distribution Channel, 2019-2030 (USD Million)
80. Brazil Epirubicin Market, By Dosage, 2019-2030 (USD Million)
81. Brazil Epirubicin Market, By Product, 2019-2030 (USD Million)
82. Brazil Epirubicin Market, By Application, 2019-2030 (USD Million)
83. Brazil Epirubicin Market, By Distribution Channel, 2019-2030 (USD Million)
84. Middle East and Africa Epirubicin Market, By Dosage, 2019-2030 (USD Million)
85. Middle East and Africa Epirubicin Market, By Product, 2019-2030 (USD Million)
86. Middle East and Africa Epirubicin Market, By Application, 2019-2030 (USD Million)
87. Middle East and Africa Epirubicin Market, By Distribution Channel, 2019-2030 (USD Million)
88. UAE Epirubicin Market, By Dosage, 2019-2030 (USD Million)
89. UAE Epirubicin Market, By Product, 2019-2030 (USD Million)
90. UAE Epirubicin Market, By Application, 2019-2030 (USD Million)
91. UAE Epirubicin Market, By Distribution Channel, 2019-2030 (USD Million)
92. South Africa Epirubicin Market, By Dosage, 2019-2030 (USD Million)
93. South Africa Epirubicin Market, By Product, 2019-2030 (USD Million)
94. South Africa Epirubicin Market, By Application, 2019-2030 (USD Million)
95. South Africa Epirubicin Market, By Distribution Channel, 2019-2030 (USD Million)
List of Figures
1. Global Epirubicin Market Segmentation
2. Epirubicin Market: Research Methodology
3. Market Size Estimation Methodology: Bottom-Up Approach
4. Market Size Estimation Methodology: Top-Down Approach
5. Data Triangulation
6. Porter’s Five Forces Analysis
7. Value Chain Analysis
8. Global Epirubicin Market Attractiveness Analysis By Dosage
9. Global Epirubicin Market Attractiveness Analysis By Product
10. Global Epirubicin Market Attractiveness Analysis By Application
11. Global Epirubicin Market Attractiveness Analysis By Distribution Channel
12. Global Epirubicin Market Attractiveness Analysis By Region
13. Global Epirubicin Market: Dynamics
14. Global Epirubicin Market Share by Dosage (2022 & 2030)
15. Global Epirubicin Market Share by Product (2022 & 2030)
16. Global Epirubicin Market Share by Application (2022 & 2030)
17. Global Epirubicin Market Share by Distribution Channel (2022 & 2030)
18. Global Epirubicin Market Share by Regions (2022 & 2030)
19. Global Epirubicin Market Share by Company (2021)
This study forecasts revenue at global, regional, and country levels from 2019 to 2030. The Brainy Insights has segmented the global epirubicin market based on below mentioned segments:
Global Epirubicin Market by Dosage:
Global Epirubicin Market by Product:
Global Epirubicin Market by Application:
Global Epirubicin Market by Distribution Channel:
Global Epirubicin Market by Region:
Research has its special purpose to undertake marketing efficiently. In this competitive scenario, businesses need information across all industry verticals; the information about customer wants, market demand, competition, industry trends, distribution channels etc. This information needs to be updated regularly because businesses operate in a dynamic environment. Our organization, The Brainy Insights incorporates scientific and systematic research procedures in order to get proper market insights and industry analysis for overall business success. The analysis consists of studying the market from a miniscule level wherein we implement statistical tools which helps us in examining the data with accuracy and precision.
Our research reports feature both; quantitative and qualitative aspects for any market. Qualitative information for any market research process are fundamental because they reveal the customer needs and wants, usage and consumption for any product/service related to a specific industry. This in turn aids the marketers/investors in knowing certain perceptions of the customers. Qualitative research can enlighten about the different product concepts and designs along with unique service offering that in turn, helps define marketing problems and generate opportunities. On the other hand, quantitative research engages with the data collection process through interviews, e-mail interactions, surveys and pilot studies. Quantitative aspects for the market research are useful to validate the hypotheses generated during qualitative research method, explore empirical patterns in the data with the help of statistical tools, and finally make the market estimations.
The Brainy Insights offers comprehensive research and analysis, based on a wide assortment of factual insights gained through interviews with CXOs and global experts and secondary data from reliable sources. Our analysts and industry specialist assume vital roles in building up statistical tools and analysis models, which are used to analyse the data and arrive at accurate insights with exceedingly informative research discoveries. The data provided by our organization have proven precious to a diverse range of companies, facilitating them to address issues such as determining which products/services are the most appealing, whether or not customers use the product in the manner anticipated, the purchasing intentions of the market and many others.
Our research methodology encompasses an idyllic combination of primary and secondary initiatives. Key phases involved in this process are listed below:

The phase involves the gathering and collecting of market data and its related information with the help of different sources & research procedures.

The data procurement stage involves in data gathering and collecting through various data sources.
This stage involves in extensive research. These data sources includes:
Purchased Database: Purchased databases play a crucial role in estimating the market sizes irrespective of the domain. Our purchased database includes:
Primary Research: The Brainy Insights interacts with leading companies and experts of the concerned domain to develop the analyst team’s market understanding and expertise. It improves and substantiates every single data presented in the market reports. Primary research mainly involves in telephonic interviews, E-mail interactions and face-to-face interviews with the raw material providers, manufacturers/producers, distributors, & independent consultants. The interviews that we conduct provides valuable data on market size and industry growth trends prevailing in the market. Our organization also conducts surveys with the various industry experts in order to gain overall insights of the industry/market. For instance, in healthcare industry we conduct surveys with the pharmacists, doctors, surgeons and nurses in order to gain insights and key information of a medical product/device/equipment which the customers are going to usage. Surveys are conducted in the form of questionnaire designed by our own analyst team. Surveys plays an important role in primary research because surveys helps us to identify the key target audiences of the market. Additionally, surveys helps to identify the key target audience engaged with the market. Our survey team conducts the survey by targeting the key audience, thus gaining insights from them. Based on the perspectives of the customers, this information is utilized to formulate market strategies. Moreover, market surveys helps us to understand the current competitive situation of the industry. To be precise, our survey process typically involve with the 360 analysis of the market. This analytical process begins by identifying the prospective customers for a product or service related to the market/industry to obtain data on how a product/service could fit into customers’ lives.

Secondary Research: The secondary data sources includes information published by the on-profit organizations such as World bank, WHO, company fillings, investor presentations, annual reports, national government documents, statistical databases, blogs, articles, white papers and others. From the annual report, we analyse a company’s revenue to understand the key segment and market share of that organization in a particular region. We analyse the company websites and adopt the product mapping technique which is important for deriving the segment revenue. In the product mapping method, we select and categorize the products offered by the companies catering to domain specific market, deduce the product revenue for each of the companies so as to get overall estimation of the market size. We also source data and analyses trends based on information received from supply side and demand side intermediaries in the value chain. The supply side denotes the data gathered from supplier, distributor, wholesaler and the demand side illustrates the data gathered from the end customers for respective market domain.

The supply side for a domain specific market is analysed by:
The demand side for the market is estimated through:
In-house Library: Apart from these third-party sources, we have our in-house library of qualitative and quantitative information. Our in-house database includes market data for various industry and domains. These data are updated on regular basis as per the changing market scenario. Our library includes, historic databases, internal audit reports and archives.
Sometimes there are instances where there is no metadata or raw data available for any domain specific market. For those cases, we use our expertise to forecast and estimate the market size in order to generate comprehensive data sets. Our analyst team adopt a robust research technique in order to produce the estimates:
Data Synthesis: This stage involves the analysis & mapping of all the information obtained from the previous step. It also involves in scrutinizing the data for any discrepancy observed while data gathering related to the market. The data is collected with consideration to the heterogeneity of sources. Robust scientific techniques are in place for synthesizing disparate data sets and provide the essential contextual information that can orient market strategies. The Brainy Insights has extensive experience in data synthesis where the data passes through various stages:


Market Deduction & Formulation: The final stage comprises of assigning data points at appropriate market spaces so as to deduce feasible conclusions. Analyst perspective & subject matter expert based holistic form of market sizing coupled with industry analysis also plays a crucial role in this stage.
This stage involves in finalization of the market size and numbers that we have collected from data integration step. With data interpolation, it is made sure that there is no gap in the market data. Successful trend analysis is done by our analysts using extrapolation techniques, which provide the best possible forecasts for the market.
Data Validation & Market Feedback: Validation is the most important step in the process. Validation & re-validation via an intricately designed process helps us finalize data-points to be used for final calculations.

The Brainy Insights interacts with leading companies and experts of the concerned domain to develop the analyst team’s market understanding and expertise. It improves and substantiates every single data presented in the market reports. The data validation interview and discussion panels are typically composed of the most experienced industry members. The participants include, however, are not limited to:
Moreover, we always validate our data and findings through primary respondents from all the major regions we are working on.


Free Customization
Fortune 500 Clients
Free Yearly Update On Purchase Of Multi/Corporate License
Companies Served Till Date