- +1-315-215-1633
- sales@thebrainyinsights.com

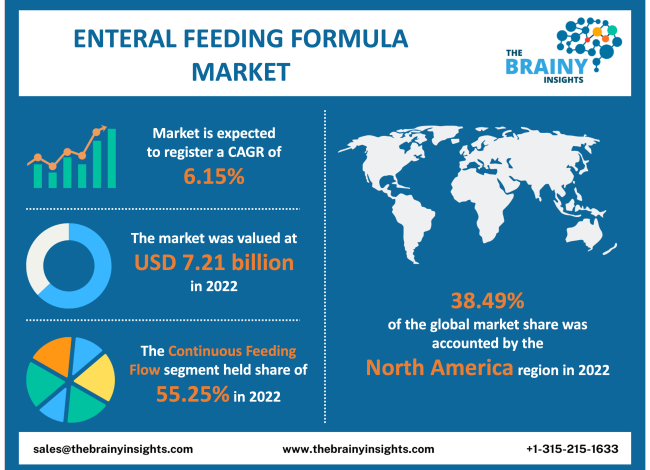
The global enteral feeding formula market was valued at USD 7.21 billion in 2022, increasing at a CAGR of 6.15% from 2022 to 2032 and anticipated to reach USD 13.09 billion by 2032. Asia Pacific is expected to grow the fastest during the forecast period.
Enteral feeding refers to food intake through the gastrointestinal (GI) tract. The GI tract comprises the stomach, mouth, intestines, and esophagus. Feeding is considered in cases such as eating inability, cancer disease, serious illness, stroke attack, and critical injury. On the other hand, enteral feeding may mean nutrition taken via the mouth or through a tube that goes directly to the small intestine or stomach. Enteral feeding is most frequently utilized in the medical setting to mean tube feeding. Most energy in enteral formulas typically comes from carbohydrates, with polymeric/standard formulas providing 30-60% energy from carbohydrates. Enteral formulas vary in caloric range from 1.0-2.0 kcal/mL. Formulas comprise different sources of fats, carbohydrates, proteins, and micronutrients. This feeding method may be utilized as a supplement or make up the entire caloric intake. Enteral feeding devices are used considerably in CCU, OT, ICU, and severely ill patients at home.
Get an overview of this study by requesting a free sample
For example, on August 24, 2020, Kate Farms Company announced the launching of two new plant-based, organic products – Kate Farms Pediatric Peptide 1.0 formula & Kate Farms Standard 1.4 formula.
For example, in October 2020, Nestle Health Science Company introduced China's first ready-to-drink protein-based comprehensive nutrition Foods. This protein-based extensive nutrition food is intended for Special Medical Purposes for malnourished patients.
The increasing demand for enteral feeding formulas: The growth in the geriatric population & age-related health disorders are propelling the market growth. Further, the raised demand for enteral nutrition formulae for older persons at home, coupled with the increasing customer awareness about balanced diets worldwide, is also leading to a proliferation in the number of manufacturers, which are driving factors of the market growth Moreover, ever-increasing deficiency of macro & micronutrients among patients in hospitals during pre and post-surgery are anticipated to propel the market growth during the forecast period Additionally, the adoption of enteral feeding formulae to meet babies' nutritional requirements is also fueled by the rise in the incidence of preterm births, which is also helping to boost the market growth.
The occurrence of feeding & medication errors: The issues related to enteral nutrition & patient, safety risk issues, are restraining factors of the market growth. Further, the adverse effects and problems associated with enteral feedings hinder the market growth.
The increase in healthcare expenditure: The development of affordable and effective diabetes therapy and the growing government spending on healthcare propel the market growth during the forecast period. An increase in healthcare expenditures associated with effective health intervention increases labor supply and productivity, which ultimately increase GDP, which is also helping to stimulate market growth. Also, the growing penetration of diagnostic labs and healthcare units, especially in emerging markets, is helping to boost the market growth. Further, the increased awareness among healthcare workers about hospital-associated malnutrition, the increase in the number of neonatal intensive care units, along with the increasing demand for personalized medicine are expected to propel the market growth during the forecast period.
The lack of reimbursement: The lack of reimbursement for enteral feeding formula is anticipated to inhibit the usage of enteral feeding formula & lower the adoption rate in the prediction period.
The regions analyzed for the market include Europe, South America, Asia Pacific, North America, the Middle East, and Africa. North America emerged as the largest global enteral feeding formula market, with a 38.49% market revenue share in 2022. North America dominates the enteral feeding formula market due to the increasing geriatric population. Further, implementing guidelines for the proper adoption of enteral nutrition for senior citizens and neonatal care also propels the market growth in this region. Moreover, the presence of a large number of product manufacturers, along with the increasing aging population, is expected to drive market growth in this region. Asia Pacific is expected to grow the fastest during the forecast period due to the expanding number of malnutrition cases and enteral nutrition improvement strategies. Furthermore, the rising consumer understanding of the benefits of tube feeding for treating chronic health concerns is also helping to drive market growth during the forecast period in this region.
North America Region Enteral Feeding Formula Market Share in 2022 - 38.49%
www.thebrainyinsights.com
Check the geographical analysis of this market by requesting a free sample
The flow type segment is divided into continuous feeding flow and intermittent feeding flow. The continuous feeding flow segment dominated, with a market share of around 55.25% in 2022. This growth is attributed to the increasing adoption of continuous feeding flow types for critically ill patients suffering from respiratory failure, severe burns, cancer, and heart conditions. Further, by 2032, the intermittent feeding flow segment will likely dominate the market due to physicians' increased intermittent enteral nutrition administration recommendations due to its better gastrointestinal tolerance by patients.
The product segment is divided into a disease-specific formula and standard formula. In 2022, the standard formula segment dominated the market with 59.07% and a revenue of 4.25 billion. This growth is attributed to their extensive use in most enterally-fed patients, especially chronically tube-fed patients. Moreover, the broad adoption of standard formulas among all types of patients and associated cost-effectiveness is also helping to boost the segment's market growth. Further, by 2032, the disease-specific formula segment will likely dominate the market due to the recent product innovations for specific nutritional requirements. Additionally, the increase in the development and launch of disease-specific nutritional products by manufacturers as per the patient's needs is also helping to boost the segment's market growth.
The indication segment is divided into nutrition deficiency, oncology, diabetes, Alzheimer's, orphan diseases, cancer care, chronic kidney diseases, pain management, dysphagia, malabsorption/GI disorder/diarrhea, and others. In 2022, the oncology segment dominated the market with 19.29% and a revenue of 1.39 billion. This growth is attributed to the increasing adoption of enteral feeding as an efficient alternative to parenteral nutrition among cancer patients. Further, by 2032, the orphan diseases segment will likely dominate the market due to the raised preference for nutrition & clinical management of rare or orphan disorders to improve quality of life.
The stage segment is divided into pediatric and adult. In 2022, the adult segment dominated the market with 56.21% and a revenue of 4.05 billion. This growth is attributed to the availability of a large number of tube feeds or products for adults on a commercial level. However, the increasing use of enteral tube feeding among individuals with various illnesses, including cancer, chronic liver disease, diabetes, multiple sclerosis, and chronic obstructive pulmonary disease (COPD), is also helping to boost the segment's market growth. Further, by 2032, the pediatric segment will likely dominate the market due to the increasing prevalence rate of malnutrition among hospitalized children. Additionally, some pediatric patients suffering from gastrointestinal disorders, such as severe gastroesophageal reflux, allergies, food refusal behavior, and metabolic disorders, are also provided tube feeding.
The end-user segment is divided into home care and hospitals. In 2022, the home care segment dominated the market with 54.27% and a revenue of 3.19 billion. This growth is attributed to the increasing awareness of adopting enteral feeding formulas among patients suffering from chronic disorders in home-based healthcare settings.
| Attribute | Description |
|---|---|
| Market Size | Revenue (USD Billion) |
| Market size value in 2022 | USD 7.21 Billion |
| Market size value in 2032 | USD 13.09 Billion |
| CAGR (2023 to 2032) | 6.15% |
| Historical data | 2019-2021 |
| Base Year | 2022 |
| Forecast | 2023-2032 |
| Regional Segments | The key regions are North America, South America, Europe, Asia Pacific, and Middle East & Africa. |
| Segments | Key Segments are flow type, product, indication, stage, end-user, regions |
North American region emerged as the largest market for an enteral feeding formula.
The market's growth will be influenced by the increase in the prevalence of chronic diseases.
The lack of awareness regarding enteral feeding formulas could hamper the market growth.
The technological advancements in enteral feeding devices will provide huge opportunities to the market.
1. Introduction
1.1. Objectives of the Study
1.2. Market Definition
1.3. Research Scope
1.4. Currency
1.5. Key Target Audience
2. Research Methodology and Assumptions
3. Executive Summary
4. Premium Insights
4.1. Porter’s Five Forces Analysis
4.2. Value Chain Analysis
4.3. Top Investment Pockets
4.3.1. Market Attractiveness Analysis By Flow Type
4.3.2. Market Attractiveness Analysis By Product
4.3.3. Market Attractiveness Analysis By Indication
4.3.4. Market Attractiveness Analysis By Stage
4.3.5. Market Attractiveness Analysis By End-User
4.3.6. Market Attractiveness Analysis By Region
4.4. Industry Trends
5. Market Dynamics
5.1. Market Evaluation
5.2. Drivers
5.2.1. The increase in the prevalence of chronic diseases
5.2.2. The rising prevalence of preterm births
5.2.3. The growing malnutrition
5.2.4. The rise in the number of home health agencies and nursing care
5.3. Restraints
5.3.1. The lack of awareness regarding enteral feeding formulas
5.3.2. The occurrence of feeding and medication errors
5.4. Opportunities
5.4.1. The increase in healthcare expenditure
5.4.2. The technological advancements in enteral feeding devices
5.5. Challenges
5.5.1. The lack of reimbursement of enteral feeding formula
1. Global Enteral Feeding Formula Market Analysis and Forecast, By Flow Type
1.1. Segment Overview
1.2. Continuous Feeding Flow
1.3. Intermittent Feeding Flow
2. Global Enteral Feeding Formula Market Analysis and Forecast, By Product
2.1. Segment Overview
2.2. Disease-Specific Formula
2.3. Standard Formula
3. Global Enteral Feeding Formula Market Analysis and Forecast, By Indication
3.1. Segment Overview
3.2. Nutrition Deficiency
3.3. Oncology
3.4. Diabetes
3.5. Alzheimer’s
3.6. Orphan Diseases
3.7. Cancer Care
3.8. Chronic Kidney Diseases
3.9. Pain Management
3.10. Dysphagia
3.11. Malabsorption/GI Disorder/Diarrhea
3.12. Others
4. Global Enteral Feeding Formula Market Analysis and Forecast, By Stage
4.1. Segment Overview
4.2. Pediatric
4.3. Adult
5. Global Enteral Feeding Formula Market Analysis and Forecast, By End-User
5.1. Segment Overview
5.2. Home Care
5.3. Hospitals
6. Global Enteral Feeding Formula Market Analysis and Forecast, By Regional Analysis
6.1. Segment Overview
6.2. North America
6.2.1. U.S.
6.2.2. Canada
6.2.3. Mexico
6.3. Europe
6.3.1. Germany
6.3.2. France
6.3.3. U.K.
6.3.4. Italy
6.3.5. Spain
6.4. Asia-Pacific
6.4.1. Japan
6.4.2. China
6.4.3. India
6.5. South America
6.5.1. Brazil
6.6. Middle East and Africa
6.6.1. UAE
6.6.2. South Africa
7. Global Enteral Feeding Formula Market-Competitive Landscape
7.1. Overview
7.2. Market Share of Key Players in Global Enteral Feeding Formula Market
7.2.1. Global Company Market Share
7.2.2. North America Company Market Share
7.2.3. Europe Company Market Share
7.2.4. APAC Company Market Share
7.3. Competitive Situations and Trends
7.3.1. Product Launches and Developments
7.3.2. Partnerships, Collaborations, and Agreements
7.3.3. Mergers & Acquisitions
7.3.4. Expansions
8. Company Profiles
8.1. Nestlé S.A.
8.1.1. Business Overview
8.1.2. Company Snapshot
8.1.3. Company Market Share Analysis
8.1.4. Company Product Portfolio
8.1.5. Recent Developments
8.1.6. SWOT Analysis
8.2. Abbott Laboratories
8.2.1. Business Overview
8.2.2. Company Snapshot
8.2.3. Company Market Share Analysis
8.2.4. Company Product Portfolio
8.2.5. Recent Developments
8.2.6. SWOT Analysis
8.3. Mead Johnson Nutrition Company
8.3.1. Business Overview
8.3.2. Company Snapshot
8.3.3. Company Market Share Analysis
8.3.4. Company Product Portfolio
8.3.5. Recent Developments
8.3.6. SWOT Analysis
8.4. Fresenius Kabi AG
8.4.1. Business Overview
8.4.2. Company Snapshot
8.4.3. Company Market Share Analysis
8.4.4. Company Product Portfolio
8.4.5. Recent Developments
8.4.6. SWOT Analysis
8.5. Danone S.A.
8.5.1. Business Overview
8.5.2. Company Snapshot
8.5.3. Company Market Share Analysis
8.5.4. Company Product Portfolio
8.5.5. Recent Developments
8.5.6. SWOT Analysis
8.6. Victus Inc.
8.6.1. Business Overview
8.6.2. Company Snapshot
8.6.3. Company Market Share Analysis
8.6.4. Company Product Portfolio
8.6.5. Recent Developments
8.6.6. SWOT Analysis
8.7. Hormel Foods, LLC
8.7.1. Business Overview
8.7.2. Company Snapshot
8.7.3. Company Market Share Analysis
8.7.4. Company Product Portfolio
8.7.5. Recent Developments
8.7.6. SWOT Analysis
8.8. B. Braun Melsungen AG
8.8.1. Business Overview
8.8.2. Company Snapshot
8.8.3. Company Market Share Analysis
8.8.4. Company Product Portfolio
8.8.5. Recent Developments
8.8.6. SWOT Analysis
8.9. Global Health Product Inc.
8.9.1. Business Overview
8.9.2. Company Snapshot
8.9.3. Company Market Share Analysis
8.9.4. Company Product Portfolio
8.9.5. Recent Developments
8.9.6. SWOT Analysis
8.10. Aveanna Healthcare
8.10.1. Business Overview
8.10.2. Company Snapshot
8.10.3. Company Market Share Analysis
8.10.4. Company Product Portfolio
8.10.5. Recent Developments
8.10.6. SWOT Analysis
8.11. Meiji Holdings Co., Ltd
8.11.1. Business Overview
8.11.2. Company Snapshot
8.11.3. Company Market Share Analysis
8.11.4. Company Product Portfolio
8.11.5. Recent Developments
8.11.6. SWOT Analysis
8.12. Nutricia
8.12.1. Business Overview
8.12.2. Company Snapshot
8.12.3. Company Market Share Analysis
8.12.4. Company Product Portfolio
8.12.5. Recent Developments
8.12.6. SWOT Analysis
List of Table
1. Global Enteral Feeding Formula Market, By Flow Type, 2019-2032 (USD Billion)
2. Global Continuous Feeding Flow, Enteral Feeding Formula Market, By Region, 2019-2032 (USD Billion)
3. Global Intermittent Feeding Flow, Enteral Feeding Formula Market, By Region, 2019-2032 (USD Billion)
4. Global Enteral Feeding Formula Market, By Product, 2019-2032 (USD Billion)
5. Global Disease-Specific Formula, Enteral Feeding Formula Market, By Region, 2019-2032 (USD Billion)
6. Global Standard Formula, Enteral Feeding Formula Market, By Region, 2019-2032 (USD Billion)
7. Global Enteral Feeding Formula Market, By Indication, 2019-2032 (USD Billion)
8. Global Nutrition Deficiency, Enteral Feeding Formula Market, By Region, 2019-2032 (USD Billion)
9. Global Oncology, Enteral Feeding Formula Market, By Region, 2019-2032 (USD Billion)
10. Global Diabetes, Enteral Feeding Formula Market, By Region, 2019-2032 (USD Billion)
11. Global Alzheimer’s, Enteral Feeding Formula Market, By Region, 2019-2032 (USD Billion)
12. Global Orphan Diseases, Enteral Feeding Formula Market, By Region, 2019-2032 (USD Billion)
13. Global Cancer Care, Enteral Feeding Formula Market, By Region, 2019-2032 (USD Billion)
14. Global Chronic Kidney Diseases, Enteral Feeding Formula Market, By Region, 2019-2032 (USD Billion)
15. Global Pain Management, Enteral Feeding Formula Market, By Region, 2019-2032 (USD Billion)
16. Global Dysphagia, Enteral Feeding Formula Market, By Region, 2019-2032 (USD Billion)
17. Global Malabsorption/GI Disorder/Diarrhea, Enteral Feeding Formula Market, By Region, 2019-2032 (USD Billion)
18. Global Others, Enteral Feeding Formula Market, By Region, 2019-2032 (USD Billion)
19. Global Enteral Feeding Formula Market, By Stage, 2019-2032 (USD Billion)
20. Global Pediatric, Enteral Feeding Formula Market, By Region, 2019-2032 (USD Billion)
21. Global Adult, Enteral Feeding Formula Market, By Region, 2019-2032 (USD Billion)
22. Global Enteral Feeding Formula Market, By End-User, 2019-2032 (USD Billion)
23. Global Home Care, Enteral Feeding Formula Market, By Region, 2019-2032 (USD Billion)
24. Global Hospitals, Enteral Feeding Formula Market, By Region, 2019-2032 (USD Billion)
25. North America Enteral Feeding Formula Market, By Flow Type, 2019-2032 (USD Billion)
26. North America Enteral Feeding Formula Market, By Product, 2019-2032 (USD Billion)
27. North America Enteral Feeding Formula Market, By Indication, 2019-2032 (USD Billion)
28. North America Enteral Feeding Formula Market, By Stage, 2019-2032 (USD Billion)
29. North America Enteral Feeding Formula Market, By End-User, 2019-2032 (USD Billion)
30. U.S. Enteral Feeding Formula Market, By Flow Type, 2019-2032 (USD Billion)
31. U.S. Enteral Feeding Formula Market, By Product, 2019-2032 (USD Billion)
32. U.S. Enteral Feeding Formula Market, By Indication, 2019-2032 (USD Billion)
33. U.S. Enteral Feeding Formula Market, By Stage, 2019-2032 (USD Billion)
34. U.S. Enteral Feeding Formula Market, By End-User, 2019-2032 (USD Billion)
35. Canada Enteral Feeding Formula Market, By Flow Type, 2019-2032 (USD Billion)
36. Canada Enteral Feeding Formula Market, By Product, 2019-2032 (USD Billion)
37. Canada Enteral Feeding Formula Market, By Indication, 2019-2032 (USD Billion)
38. Canada Enteral Feeding Formula Market, By Stage, 2019-2032 (USD Billion)
39. Canada Enteral Feeding Formula Market, By End-User, 2019-2032 (USD Billion)
40. Mexico Enteral Feeding Formula Market, By Flow Type, 2019-2032 (USD Billion)
41. Mexico Enteral Feeding Formula Market, By Product, 2019-2032 (USD Billion)
42. Mexico Enteral Feeding Formula Market, By Indication, 2019-2032 (USD Billion)
43. Mexico Enteral Feeding Formula Market, By Stage, 2019-2032 (USD Billion)
44. Mexico Enteral Feeding Formula Market, By End-User, 2019-2032 (USD Billion)
45. Europe Enteral Feeding Formula Market, By Flow Type, 2019-2032 (USD Billion)
46. Europe Enteral Feeding Formula Market, By Product, 2019-2032 (USD Billion)
47. Europe Enteral Feeding Formula Market, By Indication, 2019-2032 (USD Billion)
48. Europe Enteral Feeding Formula Market, By Stage, 2019-2032 (USD Billion)
49. Europe Enteral Feeding Formula Market, By End-User, 2019-2032 (USD Billion)
50. Germany Enteral Feeding Formula Market, By Flow Type, 2019-2032 (USD Billion)
51. Germany Enteral Feeding Formula Market, By Product, 2019-2032 (USD Billion)
52. Germany Enteral Feeding Formula Market, By Indication, 2019-2032 (USD Billion)
53. Germany Enteral Feeding Formula Market, By Stage, 2019-2032 (USD Billion)
54. Germany Enteral Feeding Formula Market, By End-User, 2019-2032 (USD Billion)
55. France Enteral Feeding Formula Market, By Flow Type, 2019-2032 (USD Billion)
56. France Enteral Feeding Formula Market, By Product, 2019-2032 (USD Billion)
57. France Enteral Feeding Formula Market, By Indication, 2019-2032 (USD Billion)
58. France Enteral Feeding Formula Market, By Stage, 2019-2032 (USD Billion)
59. France Enteral Feeding Formula Market, By End-User, 2019-2032 (USD Billion)
60. U.K. Enteral Feeding Formula Market, By Flow Type, 2019-2032 (USD Billion)
61. U.K. Enteral Feeding Formula Market, By Product, 2019-2032 (USD Billion)
62. U.K. Enteral Feeding Formula Market, By Indication, 2019-2032 (USD Billion)
63. U.K. Enteral Feeding Formula Market, By Stage, 2019-2032 (USD Billion)
64. U.K. Enteral Feeding Formula Market, By End-User, 2019-2032 (USD Billion)
65. Italy Enteral Feeding Formula Market, By Flow Type, 2019-2032 (USD Billion)
66. Italy Enteral Feeding Formula Market, By Product, 2019-2032 (USD Billion)
67. Italy Enteral Feeding Formula Market, By Indication, 2019-2032 (USD Billion)
68. Italy Enteral Feeding Formula Market, By Stage, 2019-2032 (USD Billion)
69. Italy Enteral Feeding Formula Market, By End-User, 2019-2032 (USD Billion)
70. Spain Enteral Feeding Formula Market, By Flow Type, 2019-2032 (USD Billion)
71. Spain Enteral Feeding Formula Market, By Product, 2019-2032 (USD Billion)
72. Spain Enteral Feeding Formula Market, By Indication, 2019-2032 (USD Billion)
73. Spain Enteral Feeding Formula Market, By Stage, 2019-2032 (USD Billion)
74. Spain Enteral Feeding Formula Market, By End-User, 2019-2032 (USD Billion)
75. Asia Pacific Enteral Feeding Formula Market, By Flow Type, 2019-2032 (USD Billion)
76. Asia Pacific Enteral Feeding Formula Market, By Product, 2019-2032 (USD Billion)
77. Asia Pacific Enteral Feeding Formula Market, By Indication, 2019-2032 (USD Billion)
78. Asia Pacific Enteral Feeding Formula Market, By Stage, 2019-2032 (USD Billion)
79. Asia Pacific Enteral Feeding Formula Market, By End-User, 2019-2032 (USD Billion)
80. Japan Enteral Feeding Formula Market, By Flow Type, 2019-2032 (USD Billion)
81. Japan Enteral Feeding Formula Market, By Product, 2019-2032 (USD Billion)
82. Japan Enteral Feeding Formula Market, By Indication, 2019-2032 (USD Billion)
83. Japan Enteral Feeding Formula Market, By Stage, 2019-2032 (USD Billion)
84. Japan Enteral Feeding Formula Market, By End-User, 2019-2032 (USD Billion)
85. China Enteral Feeding Formula Market, By Flow Type, 2019-2032 (USD Billion)
86. China Enteral Feeding Formula Market, By Product, 2019-2032 (USD Billion)
87. China Enteral Feeding Formula Market, By Indication, 2019-2032 (USD Billion)
88. China Enteral Feeding Formula Market, By Stage, 2019-2032 (USD Billion)
89. China Enteral Feeding Formula Market, By End-User, 2019-2032 (USD Billion)
90. India Enteral Feeding Formula Market, By Flow Type, 2019-2032 (USD Billion)
91. India Enteral Feeding Formula Market, By Product, 2019-2032 (USD Billion)
92. India Enteral Feeding Formula Market, By Indication, 2019-2032 (USD Billion)
93. India Enteral Feeding Formula Market, By Stage, 2019-2032 (USD Billion)
94. India Enteral Feeding Formula Market, By End-User, 2019-2032 (USD Billion)
95. South America Enteral Feeding Formula Market, By Flow Type, 2019-2032 (USD Billion)
96. South America Enteral Feeding Formula Market, By Product, 2019-2032 (USD Billion)
97. South America Enteral Feeding Formula Market, By Indication, 2019-2032 (USD Billion)
98. South America Enteral Feeding Formula Market, By Stage, 2019-2032 (USD Billion)
99. South America Enteral Feeding Formula Market, By End-User, 2019-2032 (USD Billion)
100. Brazil Enteral Feeding Formula Market, By Flow Type, 2019-2032 (USD Billion)
101. Brazil Enteral Feeding Formula Market, By Product, 2019-2032 (USD Billion)
102. Brazil Enteral Feeding Formula Market, By Indication, 2019-2032 (USD Billion)
103. Brazil Enteral Feeding Formula Market, By Stage, 2019-2032 (USD Billion)
104. Brazil Enteral Feeding Formula Market, By End-User, 2019-2032 (USD Billion)
105. Middle East and Africa Enteral Feeding Formula Market, By Flow Type, 2019-2032 (USD Billion)
106. Middle East and Africa Enteral Feeding Formula Market, By Product, 2019-2032 (USD Billion)
107. Middle East and Africa Enteral Feeding Formula Market, By Indication, 2019-2032 (USD Billion)
108. Middle East and Africa Enteral Feeding Formula Market, By Stage, 2019-2032 (USD Billion)
109. Middle East and Africa Enteral Feeding Formula Market, By End-User, 2019-2032 (USD Billion)
110. UAE Enteral Feeding Formula Market, By Flow Type, 2019-2032 (USD Billion)
111. UAE Enteral Feeding Formula Market, By Product, 2019-2032 (USD Billion)
112. UAE Enteral Feeding Formula Market, By Indication, 2019-2032 (USD Billion)
113. UAE Enteral Feeding Formula Market, By Stage, 2019-2032 (USD Billion)
114. UAE Enteral Feeding Formula Market, By End-User, 2019-2032 (USD Billion)
115. South Africa Enteral Feeding Formula Market, By Flow Type, 2019-2032 (USD Billion)
116. South Africa Enteral Feeding Formula Market, By Product, 2019-2032 (USD Billion)
117. South Africa Enteral Feeding Formula Market, By Indication, 2019-2032 (USD Billion)
118. South Africa Enteral Feeding Formula Market, By Stage, 2019-2032 (USD Billion)
119. South Africa Enteral Feeding Formula Market, By End-User, 2019-2032 (USD Billion)
List of Figures
1. Global Enteral Feeding Formula Market Segmentation
2. Global Enteral Feeding Formula Market: Research Methodology
3. Market Size Estimation Methodology: Bottom-Up Approach
4. Market Size Estimation Methodology: Top-Down Approach
5. Data Triangulation
6. Porter’s Five Forces Analysis
7. Value Chain Analysis
8. Global Enteral Feeding Formula Market Attractiveness Analysis By Flow Type
9. Global Enteral Feeding Formula Market Attractiveness Analysis By Product
10. Global Enteral Feeding Formula Market Attractiveness Analysis By Indication
11. Global Enteral Feeding Formula Market Attractiveness Analysis By Stage
12. Global Enteral Feeding Formula Market Attractiveness Analysis By End-User
13. Global Enteral Feeding Formula Market Attractiveness Analysis By Region
14. Global Enteral Feeding Formula Market: Dynamics
15. Global Enteral Feeding Formula Market Share By Flow Type (2023 & 2032)
16. Global Enteral Feeding Formula Market Share By Product (2023 & 2032)
17. Global Enteral Feeding Formula Market Share By Indication (2023 & 2032)
18. Global Enteral Feeding Formula Market Share By Stage (2023 & 2032)
19. Global Enteral Feeding Formula Market Share By End-User (2023 & 2032)
20. Global Enteral Feeding Formula Market Share By Regions (2022 & 2032)
21. Global Enteral Feeding Formula Market Share By Company (2022)
This study forecasts revenue at global, regional, and country levels from 2019 to 2032. The Brainy Insights has segmented the global enteral feeding formula based on below mentioned segments:
Global Enteral Feeding Formula Market by Flow Type:
Global Enteral Feeding Formula Market by Product:
Global Enteral Feeding Formula Market by Indication
Global Enteral Feeding Formula Market by Stage
Global Enteral Feeding Formula Market by End-User
Global Enteral Feeding Formula by Region:
Research has its special purpose to undertake marketing efficiently. In this competitive scenario, businesses need information across all industry verticals; the information about customer wants, market demand, competition, industry trends, distribution channels etc. This information needs to be updated regularly because businesses operate in a dynamic environment. Our organization, The Brainy Insights incorporates scientific and systematic research procedures in order to get proper market insights and industry analysis for overall business success. The analysis consists of studying the market from a miniscule level wherein we implement statistical tools which helps us in examining the data with accuracy and precision.
Our research reports feature both; quantitative and qualitative aspects for any market. Qualitative information for any market research process are fundamental because they reveal the customer needs and wants, usage and consumption for any product/service related to a specific industry. This in turn aids the marketers/investors in knowing certain perceptions of the customers. Qualitative research can enlighten about the different product concepts and designs along with unique service offering that in turn, helps define marketing problems and generate opportunities. On the other hand, quantitative research engages with the data collection process through interviews, e-mail interactions, surveys and pilot studies. Quantitative aspects for the market research are useful to validate the hypotheses generated during qualitative research method, explore empirical patterns in the data with the help of statistical tools, and finally make the market estimations.
The Brainy Insights offers comprehensive research and analysis, based on a wide assortment of factual insights gained through interviews with CXOs and global experts and secondary data from reliable sources. Our analysts and industry specialist assume vital roles in building up statistical tools and analysis models, which are used to analyse the data and arrive at accurate insights with exceedingly informative research discoveries. The data provided by our organization have proven precious to a diverse range of companies, facilitating them to address issues such as determining which products/services are the most appealing, whether or not customers use the product in the manner anticipated, the purchasing intentions of the market and many others.
Our research methodology encompasses an idyllic combination of primary and secondary initiatives. Key phases involved in this process are listed below:

The phase involves the gathering and collecting of market data and its related information with the help of different sources & research procedures.

The data procurement stage involves in data gathering and collecting through various data sources.
This stage involves in extensive research. These data sources includes:
Purchased Database: Purchased databases play a crucial role in estimating the market sizes irrespective of the domain. Our purchased database includes:
Primary Research: The Brainy Insights interacts with leading companies and experts of the concerned domain to develop the analyst team’s market understanding and expertise. It improves and substantiates every single data presented in the market reports. Primary research mainly involves in telephonic interviews, E-mail interactions and face-to-face interviews with the raw material providers, manufacturers/producers, distributors, & independent consultants. The interviews that we conduct provides valuable data on market size and industry growth trends prevailing in the market. Our organization also conducts surveys with the various industry experts in order to gain overall insights of the industry/market. For instance, in healthcare industry we conduct surveys with the pharmacists, doctors, surgeons and nurses in order to gain insights and key information of a medical product/device/equipment which the customers are going to usage. Surveys are conducted in the form of questionnaire designed by our own analyst team. Surveys plays an important role in primary research because surveys helps us to identify the key target audiences of the market. Additionally, surveys helps to identify the key target audience engaged with the market. Our survey team conducts the survey by targeting the key audience, thus gaining insights from them. Based on the perspectives of the customers, this information is utilized to formulate market strategies. Moreover, market surveys helps us to understand the current competitive situation of the industry. To be precise, our survey process typically involve with the 360 analysis of the market. This analytical process begins by identifying the prospective customers for a product or service related to the market/industry to obtain data on how a product/service could fit into customers’ lives.

Secondary Research: The secondary data sources includes information published by the on-profit organizations such as World bank, WHO, company fillings, investor presentations, annual reports, national government documents, statistical databases, blogs, articles, white papers and others. From the annual report, we analyse a company’s revenue to understand the key segment and market share of that organization in a particular region. We analyse the company websites and adopt the product mapping technique which is important for deriving the segment revenue. In the product mapping method, we select and categorize the products offered by the companies catering to domain specific market, deduce the product revenue for each of the companies so as to get overall estimation of the market size. We also source data and analyses trends based on information received from supply side and demand side intermediaries in the value chain. The supply side denotes the data gathered from supplier, distributor, wholesaler and the demand side illustrates the data gathered from the end customers for respective market domain.

The supply side for a domain specific market is analysed by:
The demand side for the market is estimated through:
In-house Library: Apart from these third-party sources, we have our in-house library of qualitative and quantitative information. Our in-house database includes market data for various industry and domains. These data are updated on regular basis as per the changing market scenario. Our library includes, historic databases, internal audit reports and archives.
Sometimes there are instances where there is no metadata or raw data available for any domain specific market. For those cases, we use our expertise to forecast and estimate the market size in order to generate comprehensive data sets. Our analyst team adopt a robust research technique in order to produce the estimates:
Data Synthesis: This stage involves the analysis & mapping of all the information obtained from the previous step. It also involves in scrutinizing the data for any discrepancy observed while data gathering related to the market. The data is collected with consideration to the heterogeneity of sources. Robust scientific techniques are in place for synthesizing disparate data sets and provide the essential contextual information that can orient market strategies. The Brainy Insights has extensive experience in data synthesis where the data passes through various stages:


Market Deduction & Formulation: The final stage comprises of assigning data points at appropriate market spaces so as to deduce feasible conclusions. Analyst perspective & subject matter expert based holistic form of market sizing coupled with industry analysis also plays a crucial role in this stage.
This stage involves in finalization of the market size and numbers that we have collected from data integration step. With data interpolation, it is made sure that there is no gap in the market data. Successful trend analysis is done by our analysts using extrapolation techniques, which provide the best possible forecasts for the market.
Data Validation & Market Feedback: Validation is the most important step in the process. Validation & re-validation via an intricately designed process helps us finalize data-points to be used for final calculations.

The Brainy Insights interacts with leading companies and experts of the concerned domain to develop the analyst team’s market understanding and expertise. It improves and substantiates every single data presented in the market reports. The data validation interview and discussion panels are typically composed of the most experienced industry members. The participants include, however, are not limited to:
Moreover, we always validate our data and findings through primary respondents from all the major regions we are working on.


Free Customization
Fortune 500 Clients
Free Yearly Update On Purchase Of Multi/Corporate License
Companies Served Till Date