- +1-315-215-1633
- sales@thebrainyinsights.com

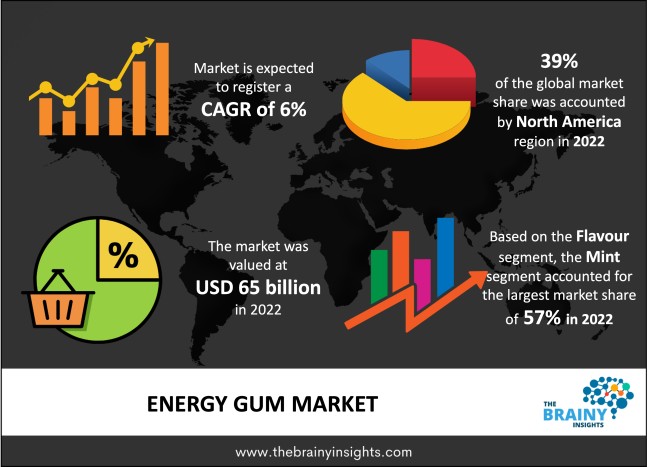
The global energy gum market was valued at USD 65 billion in 2022 and grew at a CAGR of 6% from 2023 to 2032. The market is expected to reach USD 116.40 billion by 2032. The rising adoption of an active lifestyle will drive the growth of the global energy-gum market.
Humans need energy to get through the day by performing various activities like working, exercising, walking etc. The human body also requires energy to maintain its life processes, just as digestion, respiration, blood circulation etc. It also needs energy to regulate sleep and body temperature. The energy comes from various foods and the macronutrients contained in them. The primary macronutrient that is the human body's energy source is carbohydrates. However, with the intense hustle culture, the need for an instant energy boost is rising. Food cannot help with this short-term requirement. Therefore, people consume caffeine which boosts energy and reduces the need for sleep. However, conventional coffee consumption is becoming redundant. Caffeine-induced products such as energy gums are gaining traction. Energy gum has Sweeteners, Gum Base, Flavourings, Caffeine, Thickener, Niacin, Glazing Agent and several vitamins. Chewing caffeinated gum leads to better absorption under the tongue, thus directly into the bloodstream, making it more effective than caffeine drinks. Energy gum is a quick and efficient solution to provide rapid energy to improve mental clarity. It also treats the effects of exhaustion and lack of sleep. Caffeine-rich energy gums provide a short boost of energy to improve focus, alertness, and attention while exercising, playing sports, studying and performing other cognitive tasks. These are practical and powerful substitutes for energy drinks and supplements. They offer quick results and improve concentration and focus. They come in different flavours and amounts of caffeine, as the user requires.
Get an overview of this study by requesting a free sample
The rising adoption of an active lifestyle – The increasing incidence of cardiovascular, pulmonary, and other lifestyle diseases such as obesity and diabetes has increased awareness about the importance of having a healthy lifestyle. The covid-19 pandemic increased this awareness and encouraged people to adopt an active lifestyle to care for their bodies. The positive social media messaging with people going to the gym, working out, eating right, and teaching others about active lifestyles has encouraged the young population to exercise. The increasing adoption of a healthy and active lifestyle has also been associated with the increasing promotion of supplements, active ingredients, superfoods and other beverages that give energy and improve focus, endurance, metabolism and concentration in daily life. The growing interest in sports, dancing, and gaming has also increased. Therefore, the increasing adoption of an active lifestyle will drive the global energy-gum market's growth.
The growing concerns about unregulated caffeine consumption – While caffeine in regulated amounts can improve focus, concentration and energy, it is harmful when consumed beyond certain limits. Unregulated caffeine consumption daily kills appetite, induces anxiety and restlessness and increases the dependency on caffeine. It changes sleep patterns, impacts the nervous system etc. the lack of knowledge surrounding the regulated use of energy gums with caffeine content as high as 100 gm is concerning as it can lead to severe negative health consequences. The increasing heart attack rates in youngsters with an active lifestyle is a visible cause that deviates potential customers from the energy gum market. Therefore, the growing concerns about caffeine consumption will hamper the market's growth.
The introduction of new flavours, packaging and ingredients – The growing demand for caffeine-induced products as a substitute or alternative to conventional coffee has facilitated the development of energy drinks, gums, superfoods etc. the increasing demand in the highly segmented market has encouraged the market players to develop new flavours like fruits, superfood induced gums etc. to improve their market share. The market players also focus on reducing artificial sweeteners, stabilizers and supplements to improve product quality and effectiveness. Therefore, the increasing research and development to introduce new flavours, ingredients, colours, and packaging will propel the market's growth.
The regions analyzed for the market include North America, Europe, South America, Asia Pacific, the Middle East, and Africa. North America emerged as the largest global energy gum market, with a 39% market revenue share in 2022.
Given the rising instances of cardiovascular and pulmonary diseases, the increasing adoption of an active lifestyle in the region will drive the market's growth. The growing presence of gyms, fitness and health centres will propel the market's growth. The increasing demand for caffeine-induced products by sports persons, fitness enthusiasts, powerlifters, bodybuilders and athletes will also boost the market's growth. The presence of retail chains improves access to energy gum products, facilitating market expansion.
North America Region Energy Gum Market Share in 2022 - 39%
www.thebrainyinsights.com
Check the geographical analysis of this market by requesting a free sample
The flavour segment is divided into mint, fruit, and others. The mint segment dominated the market, with a market share of around 57% in 2022. Mint contains a significant amount of menthol. Methanol contains a crucial active element that produces a cooling sensation, a key feature that increases its preference over other flavours in the market. Mint can leave a sense of cool freshness after its consumption. It produces a feeling of cleanliness in the mouth. Mint-flavoured energy gums are also induced with peppermint, which has natural anti-bacterial characteristics that facilitate a clean mouth and a healthy body. Furthermore, most products in the market are mint induced and available at several stores, making them accessible and convenient. They require fewer artificial flavours, sweeteners and stabilizers than fruit energy gums.
The application segment is divided into fitness/exercise, study, business, sports and others. The fitness/exercise segment dominated the market, with a market share of around 38% in 2022. Chewing gum helps athletes, fitness enthusiasts, or regular exercising people to maintain composure under duress; it lowers stress and aids in boosting mental activity. Several scientific studies over the years have supported all these findings. The studies also revealed that chewing gum while exercising improves heart rate, blood flow to the brain and provides psychological benefits. Energy gums enhance performance and improve focus, alertness and endurance. The increasing adoption of an active lifestyle will stimulate the segment’s growth in the future.
The distribution channel segment is divided into online, supermarkets, health stores, convenience stores and others. The online segment dominated the market, with a market share of around 40% in 2022. The covid-19 pandemic-induced lockdowns contributed to the rising adoption of an active lifestyle as people had more time on their hands and realized the importance of a healthy body in the face of the devasting waves. The increased ownership of smart connected devices complemented this rise in active lifestyles, with people working out at home and buying the necessary equipment, programs, foods and supplements online. The trend continued after the pandemic, and the general population still prefers online shopping for lifestyle products, given the wide variety of choices, brands, discounts, payment options, home delivery, easy return policy and the absence of face-to-face contact.
| Attribute | Description |
|---|---|
| Market Size | Revenue (USD Billion) |
| Market size value in 2022 | USD 65 Billion |
| Market size value in 2032 | USD 116.40 Billion |
| CAGR (2023 to 2032) | 6% |
| Historical data | 2019-2021 |
| Base Year | 2022 |
| Forecast | 2023-2032 |
| Region | The regions analyzed for the market are Asia Pacific, Europe, South America, North America, and Middle East & Africa. Furthermore, the regions are further analyzed at the country level. |
| Segments | Flavour, Application and Distribution Channel |
As per The Brainy Insights, the size of the global energy gum market was valued at USD 65 billion in 2022 to USD 116.40 billion by 2032.
Global energy gum market is growing at a CAGR of 6% during the forecast period 2023-2032.
The market's growth will be influenced by the rising adoption of an active lifestyle.
The growing concerns about unregulated caffeine consumption could hamper the market growth.
1. Introduction
1.1. Objectives of the Study
1.2. Market Definition
1.3. Research Scope
1.4. Currency
1.5. Key Target Audience
2. Research Methodology and Assumptions
3. Executive Summary
4. Premium Insights
4.1. Porter’s Five Forces Analysis
4.2. Value Chain Analysis
4.3. Top Investment Pockets
4.3.1. Market Attractiveness Analysis by Flavour
4.3.2. Market Attractiveness Analysis by Application
4.3.3. Market Attractiveness Analysis by Distribution Channel
4.3.4. Market Attractiveness Analysis by Region
4.4. Industry Trends
5. Market Dynamics
5.1. Market Evaluation
5.2. Drivers
5.2.1. The rising adoption of an active lifestyle
5.3. Restraints
5.3.1. The growing concerns about unregulated caffeine consumption
5.4. Opportunities
5.4.1. The introduction of new flavours, packaging and ingredients
5.5. Challenges
5.5.1. The presence of alternative energy foods and drinks
6. Global Energy Gum Market Analysis and Forecast, By Flavour
6.1. Segment Overview
6.2. Mint
6.3. Fruit
6.4. Others
7. Global Energy Gum Market Analysis and Forecast, By Application
7.1. Segment Overview
7.2. Fitness/Exercise
7.3. Study
7.4. Business
7.5. Sports
7.6. Others
8. Global Energy Gum Market Analysis and Forecast, By Distribution Channel
8.1. Segment Overview
8.2. Online
8.3. Supermarkets
8.4. Health Stores
8.5. Convenience Stores
8.6. Others
9. Global Energy Gum Market Analysis and Forecast, By Regional Analysis
9.1. Segment Overview
9.2. North America
9.2.1. U.S.
9.2.2. Canada
9.2.3. Mexico
9.3. Europe
9.3.1. Germany
9.3.2. France
9.3.3. U.K.
9.3.4. Italy
9.3.5. Spain
9.4. Asia-Pacific
9.4.1. Japan
9.4.2. China
9.4.3. India
9.5. South America
9.5.1. Brazil
9.6. Middle East and Africa
9.6.1. UAE
9.6.2. South Africa
10. Global Energy Gum Market-Competitive Landscape
10.1. Overview
10.2. Market Share of Key Players in the Energy Gum Market
10.2.1. Global Company Market Share
10.2.2. North America Company Market Share
10.2.3. Europe Company Market Share
10.2.4. APAC Company Market Share
10.3. Competitive Situations and Trends
10.3.1. Product Launches and Developments
10.3.2. Partnerships, Collaborations, and Agreements
10.3.3. Mergers & Acquisitions
10.3.4. Expansions
11. Company Profiles
11.1. Blast Power Gum
11.1.1. Business Overview
11.1.2. Company Snapshot
11.1.3. Company Market Share Analysis
11.1.4. Company Product Portfolio
11.1.5. Recent Developments
11.1.6. SWOT Analysis
11.2. GumRunners, LLC
11.2.1. Business Overview
11.2.2. Company Snapshot
11.2.3. Company Market Share Analysis
11.2.4. Company Product Portfolio
11.2.5. Recent Developments
11.2.6. SWOT Analysis
11.3. GelStat Corporation
11.3.1. Business Overview
11.3.2. Company Snapshot
11.3.3. Company Market Share Analysis
11.3.4. Company Product Portfolio
11.3.5. Recent Developments
11.3.6. SWOT Analysis
11.4. Ferrero SpA
11.4.1. Business Overview
11.4.2. Company Snapshot
11.4.3. Company Market Share Analysis
11.4.4. Company Product Portfolio
11.4.5. Recent Developments
11.4.6. SWOT Analysis
11.5. Blockhead HQ Ltd.
11.5.1. Business Overview
11.5.2. Company Snapshot
11.5.3. Company Market Share Analysis
11.5.4. Company Product Portfolio
11.5.5. Recent Developments
11.5.6. SWOT Analysis
11.6. Mars Inc.
11.6.1. Business Overview
11.6.2. Company Snapshot
11.6.3. Company Market Share Analysis
11.6.4. Company Product Portfolio
11.6.5. Recent Developments
11.6.6. SWOT Analysis
11.7. Mondelez International, Inc.
11.7.1. Business Overview
11.7.2. Company Snapshot
11.7.3. Company Market Share Analysis
11.7.4. Company Product Portfolio
11.7.5. Recent Developments
11.7.6. SWOT Analysis
11.8. NeuroGum, LLC
11.8.1. Business Overview
11.8.2. Company Snapshot
11.8.3. Company Market Share Analysis
11.8.4. Company Product Portfolio
11.8.5. Recent Developments
11.8.6. SWOT Analysis
11.9. Yıldız Holding Blast Power Gum
11.9.1. Business Overview
11.9.2. Company Snapshot
11.9.3. Company Market Share Analysis
11.9.4. Company Product Portfolio
11.9.5. Recent Developments
11.9.6. SWOT Analysis
11.10. LOTTE Corp.
11.10.1. Business Overview
11.10.2. Company Snapshot
11.10.3. Company Market Share Analysis
11.10.4. Company Product Portfolio
11.10.5. Recent Developments
11.10.6. SWOT Analysis
List of Table
1. Global Energy Gum Market, By Flavour, 2019-2032 (USD Million)
2. Global Mint Energy Gum Market, By Region, 2019-2032 (USD Million)
3. Global Fruit Energy Gum Market, By Region, 2019-2032 (USD Million)
4. Global Others Energy Gum Market, By Region, 2019-2032 (USD Million)
5. Global Energy Gum Market, By Application, 2019-2032 (USD Million)
6. Global Fitness/Exercise Energy Gum Market, By Region, 2019-2032 (USD Million)
7. Global Study Energy Gum Market, By Region, 2019-2032 (USD Million)
8. Global Business Energy Gum Market, By Region, 2019-2032 (USD Million)
9. Global Sports Energy Gum Market, By Region, 2019-2032 (USD Million)
10. Global Others Energy Gum Market, By Region, 2019-2032 (USD Million)
11. Global Energy Gum Market, By Distribution Channel, 2019-2032 (USD Million)
12. Global Online Energy Gum Market, By Region, 2019-2032 (USD Million)
13. Global Supermarkets Energy Gum Market, By Region, 2019-2032 (USD Million)
14. Global Health Stores Energy Gum Market, By Region, 2019-2032 (USD Million)
15. Global Convenience Stores Energy Gum Market, By Region, 2019-2032 (USD Million)
16. Global Others Energy Gum Market, By Region, 2019-2032 (USD Million)
17. Global Energy Gum Market, By Region, 2019-2032 (USD Million)
18. North America Energy Gum Market, By Flavour, 2019-2032 (USD Million)
19. North America Energy Gum Market, By Application, 2019-2032 (USD Million)
20. North America Energy Gum Market, By Distribution Channel, 2019-2032 (USD Million)
21. U.S. Energy Gum Market, By Flavour, 2019-2032 (USD Million)
22. U.S. Energy Gum Market, By Application, 2019-2032 (USD Million)
23. U.S. Energy Gum Market, By Distribution Channel, 2019-2032 (USD Million)
24. Canada Energy Gum Market, By Flavour, 2019-2032 (USD Million)
25. Canada Energy Gum Market, By Application, 2019-2032 (USD Million)
26. Canada Energy Gum Market, By Distribution Channel, 2019-2032 (USD Million)
27. Mexico Energy Gum Market, By Flavour, 2019-2032 (USD Million)
28. Mexico Energy Gum Market, By Application, 2019-2032 (USD Million)
29. Mexico Energy Gum Market, By Distribution Channel, 2019-2032 (USD Million)
30. Europe Energy Gum Market, By Flavour, 2019-2032 (USD Million)
31. Europe Energy Gum Market, By Application, 2019-2032 (USD Million)
32. Europe Energy Gum Market, By Distribution Channel, 2019-2032 (USD Million)
33. Germany Energy Gum Market, By Flavour, 2019-2032 (USD Million)
34. Germany Energy Gum Market, By Application, 2019-2032 (USD Million)
35. Germany Energy Gum Market, By Distribution Channel, 2019-2032 (USD Million)
36. France Energy Gum Market, By Flavour, 2019-2032 (USD Million)
37. France Energy Gum Market, By Application, 2019-2032 (USD Million)
38. France Energy Gum Market, By Distribution Channel, 2019-2032 (USD Million)
39. U.K. Energy Gum Market, By Flavour, 2019-2032 (USD Million)
40. U.K. Energy Gum Market, By Application, 2019-2032 (USD Million)
41. U.K. Energy Gum Market, By Distribution Channel, 2019-2032 (USD Million)
42. Italy Energy Gum Market, By Flavour, 2019-2032 (USD Million)
43. Italy Energy Gum Market, By Application, 2019-2032 (USD Million)
44. Italy Energy Gum Market, By Distribution Channel, 2019-2032 (USD Million)
45. Spain Energy Gum Market, By Flavour, 2019-2032 (USD Million)
46. Spain Energy Gum Market, By Application, 2019-2032 (USD Million)
47. Spain Energy Gum Market, By Distribution Channel, 2019-2032 (USD Million)
48. Asia Pacific Energy Gum Market, By Flavour, 2019-2032 (USD Million)
49. Asia Pacific Energy Gum Market, By Application, 2019-2032 (USD Million)
50. Asia Pacific Energy Gum Market, By Distribution Channel, 2019-2032 (USD Million)
51. Japan Energy Gum Market, By Flavour, 2019-2032 (USD Million)
52. Japan Energy Gum Market, By Application, 2019-2032 (USD Million)
53. Japan Energy Gum Market, By Distribution Channel, 2019-2032 (USD Million)
54. China Energy Gum Market, By Flavour, 2019-2032 (USD Million)
55. China Energy Gum Market, By Application, 2019-2032 (USD Million)
56. China Energy Gum Market, By Distribution Channel, 2019-2032 (USD Million)
57. India Energy Gum Market, By Flavour, 2019-2032 (USD Million)
58. India Energy Gum Market, By Application, 2019-2032 (USD Million)
59. India Energy Gum Market, By Distribution Channel, 2019-2032 (USD Million)
60. South America Energy Gum Market, By Flavour, 2019-2032 (USD Million)
61. South America Energy Gum Market, By Application, 2019-2032 (USD Million)
62. South America Energy Gum Market, By Distribution Channel, 2019-2032 (USD Million)
63. Brazil Energy Gum Market, By Flavour, 2019-2032 (USD Million)
64. Brazil Energy Gum Market, By Application, 2019-2032 (USD Million)
65. Brazil Energy Gum Market, By Distribution Channel, 2019-2032 (USD Million)
66. Middle East and Africa Energy Gum Market, By Flavour, 2019-2032 (USD Million)
67. Middle East and Africa Energy Gum Market, By Application, 2019-2032 (USD Million)
68. Middle East and Africa Energy Gum Market, By Distribution Channel, 2019-2032 (USD Million)
69. UAE Energy Gum Market, By Flavour, 2019-2032 (USD Million)
70. UAE Energy Gum Market, By Application, 2019-2032 (USD Million)
71. UAE Energy Gum Market, By Distribution Channel, 2019-2032 (USD Million)
72. South Africa Energy Gum Market, By Flavour, 2019-2032 (USD Million)
73. South Africa Energy Gum Market, By Application, 2019-2032 (USD Million)
74. South Africa Energy Gum Market, By Distribution Channel, 2019-2032 (USD Million)
List of Figures
1. Global Energy Gum Market Segmentation
2. Energy Gum Market: Research Methodology
3. Market Size Estimation Methodology: Bottom-Up Approach
4. Market Size Estimation Methodology: Top-Down Approach
5. Data Triangulation
6. Porter’s Five Forces Analysis
7. Value Chain Analysis
8. Global Energy Gum Market Attractiveness Analysis by Flavour
9. Global Energy Gum Market Attractiveness Analysis by Application
10. Global Energy Gum Market Attractiveness Analysis by Distribution Channel
11. Global Energy Gum Market Attractiveness Analysis by Region
12. Global Energy Gum Market: Dynamics
13. Global Energy Gum Market Share by Flavour (2022 & 2032)
14. Global Energy Gum Market Share by Application (2022 & 2032)
15. Global Energy Gum Market Share by Distribution Channel (2022 & 2032)
16. Global Energy Gum Market Share by Regions (2022 & 2032)
17. Global Energy Gum Market Share by Company (2022)
This study forecasts revenue at global, regional, and country levels from 2019 to 2032. The Brainy Insights has segmented the global energy gum market based on below mentioned segments:
Global Energy Gum Market by Flavour:
Global Energy Gum Market by Application:
Global Energy Gum Market by Distribution Channel:
Global Energy Gum Market by Region:
Research has its special purpose to undertake marketing efficiently. In this competitive scenario, businesses need information across all industry verticals; the information about customer wants, market demand, competition, industry trends, distribution channels etc. This information needs to be updated regularly because businesses operate in a dynamic environment. Our organization, The Brainy Insights incorporates scientific and systematic research procedures in order to get proper market insights and industry analysis for overall business success. The analysis consists of studying the market from a miniscule level wherein we implement statistical tools which helps us in examining the data with accuracy and precision.
Our research reports feature both; quantitative and qualitative aspects for any market. Qualitative information for any market research process are fundamental because they reveal the customer needs and wants, usage and consumption for any product/service related to a specific industry. This in turn aids the marketers/investors in knowing certain perceptions of the customers. Qualitative research can enlighten about the different product concepts and designs along with unique service offering that in turn, helps define marketing problems and generate opportunities. On the other hand, quantitative research engages with the data collection process through interviews, e-mail interactions, surveys and pilot studies. Quantitative aspects for the market research are useful to validate the hypotheses generated during qualitative research method, explore empirical patterns in the data with the help of statistical tools, and finally make the market estimations.
The Brainy Insights offers comprehensive research and analysis, based on a wide assortment of factual insights gained through interviews with CXOs and global experts and secondary data from reliable sources. Our analysts and industry specialist assume vital roles in building up statistical tools and analysis models, which are used to analyse the data and arrive at accurate insights with exceedingly informative research discoveries. The data provided by our organization have proven precious to a diverse range of companies, facilitating them to address issues such as determining which products/services are the most appealing, whether or not customers use the product in the manner anticipated, the purchasing intentions of the market and many others.
Our research methodology encompasses an idyllic combination of primary and secondary initiatives. Key phases involved in this process are listed below:

The phase involves the gathering and collecting of market data and its related information with the help of different sources & research procedures.

The data procurement stage involves in data gathering and collecting through various data sources.
This stage involves in extensive research. These data sources includes:
Purchased Database: Purchased databases play a crucial role in estimating the market sizes irrespective of the domain. Our purchased database includes:
Primary Research: The Brainy Insights interacts with leading companies and experts of the concerned domain to develop the analyst team’s market understanding and expertise. It improves and substantiates every single data presented in the market reports. Primary research mainly involves in telephonic interviews, E-mail interactions and face-to-face interviews with the raw material providers, manufacturers/producers, distributors, & independent consultants. The interviews that we conduct provides valuable data on market size and industry growth trends prevailing in the market. Our organization also conducts surveys with the various industry experts in order to gain overall insights of the industry/market. For instance, in healthcare industry we conduct surveys with the pharmacists, doctors, surgeons and nurses in order to gain insights and key information of a medical product/device/equipment which the customers are going to usage. Surveys are conducted in the form of questionnaire designed by our own analyst team. Surveys plays an important role in primary research because surveys helps us to identify the key target audiences of the market. Additionally, surveys helps to identify the key target audience engaged with the market. Our survey team conducts the survey by targeting the key audience, thus gaining insights from them. Based on the perspectives of the customers, this information is utilized to formulate market strategies. Moreover, market surveys helps us to understand the current competitive situation of the industry. To be precise, our survey process typically involve with the 360 analysis of the market. This analytical process begins by identifying the prospective customers for a product or service related to the market/industry to obtain data on how a product/service could fit into customers’ lives.

Secondary Research: The secondary data sources includes information published by the on-profit organizations such as World bank, WHO, company fillings, investor presentations, annual reports, national government documents, statistical databases, blogs, articles, white papers and others. From the annual report, we analyse a company’s revenue to understand the key segment and market share of that organization in a particular region. We analyse the company websites and adopt the product mapping technique which is important for deriving the segment revenue. In the product mapping method, we select and categorize the products offered by the companies catering to domain specific market, deduce the product revenue for each of the companies so as to get overall estimation of the market size. We also source data and analyses trends based on information received from supply side and demand side intermediaries in the value chain. The supply side denotes the data gathered from supplier, distributor, wholesaler and the demand side illustrates the data gathered from the end customers for respective market domain.

The supply side for a domain specific market is analysed by:
The demand side for the market is estimated through:
In-house Library: Apart from these third-party sources, we have our in-house library of qualitative and quantitative information. Our in-house database includes market data for various industry and domains. These data are updated on regular basis as per the changing market scenario. Our library includes, historic databases, internal audit reports and archives.
Sometimes there are instances where there is no metadata or raw data available for any domain specific market. For those cases, we use our expertise to forecast and estimate the market size in order to generate comprehensive data sets. Our analyst team adopt a robust research technique in order to produce the estimates:
Data Synthesis: This stage involves the analysis & mapping of all the information obtained from the previous step. It also involves in scrutinizing the data for any discrepancy observed while data gathering related to the market. The data is collected with consideration to the heterogeneity of sources. Robust scientific techniques are in place for synthesizing disparate data sets and provide the essential contextual information that can orient market strategies. The Brainy Insights has extensive experience in data synthesis where the data passes through various stages:


Market Deduction & Formulation: The final stage comprises of assigning data points at appropriate market spaces so as to deduce feasible conclusions. Analyst perspective & subject matter expert based holistic form of market sizing coupled with industry analysis also plays a crucial role in this stage.
This stage involves in finalization of the market size and numbers that we have collected from data integration step. With data interpolation, it is made sure that there is no gap in the market data. Successful trend analysis is done by our analysts using extrapolation techniques, which provide the best possible forecasts for the market.
Data Validation & Market Feedback: Validation is the most important step in the process. Validation & re-validation via an intricately designed process helps us finalize data-points to be used for final calculations.

The Brainy Insights interacts with leading companies and experts of the concerned domain to develop the analyst team’s market understanding and expertise. It improves and substantiates every single data presented in the market reports. The data validation interview and discussion panels are typically composed of the most experienced industry members. The participants include, however, are not limited to:
Moreover, we always validate our data and findings through primary respondents from all the major regions we are working on.


Free Customization
Fortune 500 Clients
Free Yearly Update On Purchase Of Multi/Corporate License
Companies Served Till Date