- +1-315-215-1633
- sales@thebrainyinsights.com

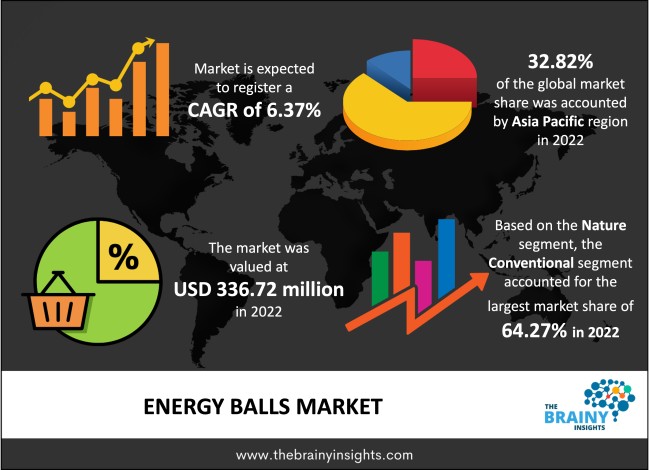
The global energy balls market was valued at USD 336.72 Million in 2022 and growing at a CAGR of 6.37% from 2023 to 2032. The market is expected to reach USD 624.39 Million by 2032. North America is expected to increase the fastest during the forecast period.
Energy balls are a nutritious snack gaining popularity due to their delicious flavours and blend of protein, carbs, healthy fats, and fibre. With 100-250 calories per ball, they make a great on-the-go snack before or after exercise, providing energy without the guilt. Energy balls include dried fruit, nuts, seeds, and other ingredients, offering various flavours. The energy ball is a highly nutritious product that makes the claim, using scientific research, that it will improve physical performance during demanding physical activity and improve recovery thereafter. In this situation, energy balls are made specifically to provide the body with the required vitamins, minerals, and carbs. The market for sports food and beverages is developed for significant consumers, particularly millennials. To improve market penetration in the sports nutrition market, innovation is needed. As a result, producers are introducing alternatives like energy balls to broaden their attractiveness. Protein-rich energy snacks in the form of balls are known as energy balls. The demand for vegan energy balls has substantially increased in recent years and is still rising significantly. The need for ethnic and exotic flavourings has increased as demand for flavours like chocolate, coconut, nuts, mint, and lime has expanded considerably in developed countries. One of the primary tactics international producers use to capture consumers' attention in the more developed markets of North America and Europe is the addition of unique flavours to existing product lines. Also, the rising demand for energy-boosting foods, beverages, and gels has prompted the adoption of more appealing flavour combinations, fuelling the expansion of the global market for energy balls. Sports nutrition products have traditionally only been used by athletes and bodybuilders, but this has changed recently to accommodate everyday consumers. The demand for energy balls has significantly expanded as a result. Before this, the product was only sold at speciality stores. However, as demand for energy balls has grown, manufacturers are already putting their items on the shelves of other retail locations. Products containing energy balls became more visible as a result, both in physical stores and online retailers.
Get an overview of this study by requesting a free sample
In November 2020, Govinda inaugurated a brand-new organic store in Germany that sells various vegan and organic goods. The business increased revenue with the help of the new store.
Pro Fuel has partnered with various online merchants and media organizations to distribute and market its effective products, including Amazon, Black Friday Sale, RTL, and Euro Sport. The organization wants to improve sales performance through these partnerships and promote corporate expansion.
Just Wholefoods has obtained vegan and organic certifications, assuring customers that no animal components or byproducts were used in the production process. The company hopes to take advantage of the significant market for vegan and plant-based items by receiving this accreditation.
To help food manufacturers create plant-based foods, SIGA, a corporation of scientists, dietitians, and researchers, has partnered with Nuttree. The partnership enables the business to guarantee that all products are healthy and independent of ultra-transformation markers, the existence of which can compromise the potential health advantages of the food.
Rising consumer awareness regarding health and nutrition- In many developed nations worldwide, consumer awareness of the possible adverse effects of counterfeit pharmaceuticals is growing. The popularity of energy balls among people around the world has increased as health awareness has improved. Also, consumers are more knowledgeable about the varied nutritional qualities of nuts, cereals, and fruits and the advantages of a lifestyle-related diet, such as increased antioxidant levels and decreased risks of metabolic illnesses like obesity and diabetes. Moreover, vitamins and minerals like calcium, iron, zinc, and vitamins A, B, E, and B12 are added to energy balls.
Cost of production- The cost of producing energy balls is high since manufacturers have less output per unit of input and higher labour costs, and their profit margins are squeezed by growing competition. These reasons are anticipated to hinder the market for energy balls from developing.
Increasing emphasis on naturally sourced ingredients- At present, producers are concentrating more on creating energy balls that are healthier and more nutritious. Manufacturers emphasize natural ingredients in their products without compromising the nutritional content. As a result, these products can be seen as more naturally sourced than their chemically generated counterparts.
Demand and supply gap- There is a lack of a proper balance between supply and demand since the information system and statistics available to producers are not as accurate and thorough as those of the food industry and general agriculture in nations with developed markets.
The regions analysed for the market include North America, Europe, South America, Asia Pacific, the Middle East, and Africa. Asia-Pacific emerged as the highest in the global energy balls market, with a share of 32.82% and valued at USD 110.51 Million in 2022. It results from increasing consumer preferences for nutrient-dense food products in nations like China and India, increased health consciousness among millennials, and rising per capita disposable income.
However, North America is anticipated to be the Energy Ball's primary market over the projected period. Due to the comparatively high consumption of products with a high protein concentration in the United States, the U.S. dominates North America. It is anticipated to provide the most revenue in the years to come.
Asia-Pacific Region Energy Balls Market Share in 2022 - 32.82%
www.thebrainyinsights.com
Check the geographical analysis of this market by requesting a free sample
The nature segment is divided into conventional and organic. The conventional segment had the highest market share of 64.27% and was valued at USD 216.40 Million in 2022 in the energy balls market. And it is predicted to grow at the highest CAGR of 8.54% over the forecast period.
The flavour segment is divided into nut-based, chocolate-based, fruit-based, and others. The nut-based segment had the highest market share of 29.33% and was valued at USD 98.75 Million in 2022 in the energy balls market.
However, the chocolate-based segment is predicted to grow at the highest CAGR of 8.26% over the forecast period.
| Attribute | Description |
|---|---|
| Market Size | Revenue (USD Million) |
| Market size value in 2022 | USD 336.72 Million |
| Market size value in 2032 | USD 624.39 Million |
| CAGR (2023 to 2032) | 6.37% |
| Historical data | 2019-2021 |
| Base Year | 2022 |
| Forecast | 2023-2032 |
| Regional Segments | The regions analyzed for the market are Europe, Asia Pacific, North America, South America, and Middle East & Africa. |
| Segments | Nature, Flavor |
As per The Brainy Insights, the size of the energy balls market was valued at USD 336.72 million in 2022 & USD 624.39 million by 2032.
Global energy balls market is growing at a CAGR of 6.37% during the forecast period 2023-2032.
Asia-Pacific region emerged as the largest market for the energy balls.
Rising consumer awareness regarding health and nutrition is a significant driving factor for the growth of the energy balls market.
Cost of production is a significant restraining factors for the energy balls market.
Increasing emphasis on naturally sourced ingredients is a significant opportunity for the growth of the energy balls market.
Demand and supply gap is a significant challenge for the growth of the energy balls market.
Key players are Bounce Foods ltd, Windmill Organics, Betty Lou's Inc., Boostball, Made In Nature, Inc., DELICIOUSLY ELLA LTD., and Nutri-Brex among others.
1. Introduction
1.1. Objective of the Study
1.2. Market Definition
1.3. Research Scope
1.4. Currency
1.5. Key Target Audience
2. Research Methodology and Assumptions
3. Executive Summary
4. Premium Insights
4.1. Porter’s Five Forces Analysis
4.2. Value Chain Analysis
4.3. Top Investment Pockets
4.3.1. Market Attractiveness Analysis By Nature
4.3.2. Market Attractiveness Analysis By Flavour
4.3.3. Market Attractiveness Analysis By Region
4.4. Industry Trends
5. Market Dynamics
5.1. Market Evaluation
5.2. Drivers
5.2.1. Rising consumer awareness regarding health and nutrition
5.3. Restraints
5.3.1. Cost of production
5.4. Opportunities
5.4.1. Increasing emphasis on naturally sourced ingredients
5.5. Challenges
5.5.1. Demand and supply gap
6. Global Energy Balls Market Analysis and Forecast, By Nature
6.1. Segment Overview
6.2. Conventional
6.3. Organic
7. Global Energy Balls Market Analysis and Forecast, By Flavour
7.1. Segment Overview
7.2. Nut-based
7.3. Chocolate-based
7.4. Fruit-based
7.5. Others
8. Global Energy Balls Market Analysis and Forecast, By Regional Analysis
8.1. Segment Overview
8.2. North America
8.2.1. U.S.
8.2.2. Canada
8.2.3. Mexico
8.3. Europe
8.3.1. Germany
8.3.2. France
8.3.3. U.K.
8.3.4. Italy
8.3.5. Spain
8.4. Asia-Pacific
8.4.1. Japan
8.4.2. China
8.4.3. India
8.5. South America
8.5.1. Brazil
8.6. Middle East and Africa
8.6.1. UAE
8.6.2. South Africa
9. Global Energy Balls Market-Competitive Landscape
9.1. Overview
9.2. Market Share of Key Players in the Energy Balls Market
9.2.1. Global Company Market Share
9.2.2. North America Company Market Share
9.2.3. Europe Company Market Share
9.2.4. APAC Company Market Share
9.3. Competitive Situations and Trends
9.3.1. Product Launches and Developments
9.3.2. Partnerships, Collaborations, and Agreements
9.3.3. Mergers & Acquisitions
9.3.4. Expansions
10. Company Profiles
10.1. Bounce Foods ltd
10.1.1. Business Overview
10.1.2. Company Snapshot
10.1.3. Company Market Share Analysis
10.1.4. Company Product Portfolio
10.1.5. Recent Developments
10.1.6. SWOT Analysis
10.2. Windmill Organics
10.2.1. Business Overview
10.2.2. Company Snapshot
10.2.3. Company Market Share Analysis
10.2.4. Company Product Portfolio
10.2.5. Recent Developments
10.2.6. SWOT Analysis
10.3. Betty Lou's Inc.
10.3.1. Business Overview
10.3.2. Company Snapshot
10.3.3. Company Market Share Analysis
10.3.4. Company Product Portfolio
10.3.5. Recent Developments
10.3.6. SWOT Analysis
10.4. Boostball
10.4.1. Business Overview
10.4.2. Company Snapshot
10.4.3. Company Market Share Analysis
10.4.4. Company Product Portfolio
10.4.5. Recent Developments
10.4.6. SWOT Analysis
10.5. Made In Nature, Inc.
10.5.1. Business Overview
10.5.2. Company Snapshot
10.5.3. Company Market Share Analysis
10.5.4. Company Product Portfolio
10.5.5. Recent Developments
10.5.6. SWOT Analysis
10.6. DELICIOUSLY ELLA LTD.
10.6.1. Business Overview
10.6.2. Company Snapshot
10.6.3. Company Market Share Analysis
10.6.4. Company Product Portfolio
10.6.5. Recent Developments
10.6.6. SWOT Analysis
10.7. Nutri-Brex
10.7.1. Business Overview
10.7.2. Company Snapshot
10.7.3. Company Market Share Analysis
10.7.4. Company Product Portfolio
10.7.5. Recent Developments
10.7.6. SWOT Analysis
List of Table
1. Global Energy Balls Market, By Nature, 2019-2032 (USD Million)
2. Global Conventional, Energy Balls Market, By Region, 2019-2032 (USD Million)
3. Global Organic, Energy Balls Market, By Region, 2019-2032 (USD Million)
4. Global Energy Balls Market, By Flavour, 2019-2032 (USD Million)
5. Global Nut-based, Energy Balls Market, By Region, 2019-2032 (USD Million)
6. Global Chocolate-based, Energy Balls Market, By Region, 2019-2032 (USD Million)
7. Global Fruit-based, Energy Balls Market, By Region, 2019-2032 (USD Million)
8. Global Others, Energy Balls Market, By Region, 2019-2032 (USD Million)
9. Global Energy Balls Market, By Region, 2019-2032 (USD Million)
10. North America Energy Balls Market, By Nature, 2019-2032 (USD Million)
11. North America Energy Balls Market, By Flavour, 2019-2032 (USD Million)
12. U.S. Energy Balls Market, By Nature, 2019-2032 (USD Million)
13. U.S. Energy Balls Market, By Flavour, 2019-2032 (USD Million)
14. Canada Energy Balls Market, By Nature, 2019-2032 (USD Million)
15. Canada Energy Balls Market, By Flavour, 2019-2032 (USD Million)
16. Mexico Energy Balls Market, By Nature, 2019-2032 (USD Million)
17. Mexico Energy Balls Market, By Flavour, 2019-2032 (USD Million)
18. Europe Energy Balls Market, By Nature, 2019-2032 (USD Million)
19. Europe Energy Balls Market, By Flavour, 2019-2032 (USD Million)
20. Germany Energy Balls Market, By Nature, 2019-2032 (USD Million)
21. Germany Energy Balls Market, By Flavour, 2019-2032 (USD Million)
22. France Energy Balls Market, By Nature, 2019-2032 (USD Million)
23. France Energy Balls Market, By Flavour, 2019-2032 (USD Million)
24. U.K. Energy Balls Market, By Nature, 2019-2032 (USD Million)
25. U.K. Energy Balls Market, By Flavour, 2019-2032 (USD Million)
26. Italy Energy Balls Market, By Nature, 2019-2032 (USD Million)
27. Italy Energy Balls Market, By Flavour, 2019-2032 (USD Million)
28. Spain Energy Balls Market, By Nature, 2019-2032 (USD Million)
29. Spain Energy Balls Market, By Flavour, 2019-2032 (USD Million)
30. Asia Pacific Energy Balls Market, By Nature, 2019-2032 (USD Million)
31. Asia Pacific Energy Balls Market, By Flavour, 2019-2032 (USD Million)
32. Japan Energy Balls Market, By Nature, 2019-2032 (USD Million)
33. Japan Energy Balls Market, By Flavour, 2019-2032 (USD Million)
34. China Energy Balls Market, By Nature, 2019-2032 (USD Million)
35. China Energy Balls Market, By Flavour, 2019-2032 (USD Million)
36. India Energy Balls Market, By Nature, 2019-2032 (USD Million)
37. India Energy Balls Market, By Flavour, 2019-2032 (USD Million)
38. South America Energy Balls Market, By Nature, 2019-2032 (USD Million)
39. South America Energy Balls Market, By Flavour, 2019-2032 (USD Million)
40. Brazil Energy Balls Market, By Nature, 2019-2032 (USD Million)
41. Brazil Energy Balls Market, By Flavour, 2019-2032 (USD Million)
42. Middle East and Africa Energy Balls Market, By Nature, 2019-2032 (USD Million)
43. Middle East and Africa Energy Balls Market, By Flavour, 2019-2032 (USD Million)
44. UAE Energy Balls Market, By Nature, 2019-2032 (USD Million)
45. UAE Energy Balls Market, By Flavour, 2019-2032 (USD Million)
46. South Africa Energy Balls Market, By Nature, 2019-2032 (USD Million)
47. South Africa Energy Balls Market, By Flavour, 2019-2032 (USD Million)
List of Figures
1. Global Energy Balls Market Segmentation
2. Energy Balls Market: Research Methodology
3. Market Size Estimation Methodology: Bottom-Up Approach
4. Market Size Estimation Methodology: Top-Down Approach
5. Data Triangulation
6. Porter’s Five Forces Analysis
7. Value Chain Analysis
8. Global Energy Balls Market Attractiveness Analysis By Nature
9. Global Energy Balls Market Attractiveness Analysis By Flavour
10. Global Energy Balls Market Attractiveness Analysis By Region
11. Global Energy Balls Market: Dynamics
12. Global Energy Balls Market Share by Nature (2023 & 2032)
13. Global Energy Balls Market Share by Flavour (2023 & 2032)
14. Global Energy Balls Market Share by Regions (2023 & 2032)
15. Global Energy Balls Market Share by Company (2022)
This study forecasts revenue at global, regional, and country levels from 2019 to 2032. The Brainy Insights has segmented the global energy balls based on below mentioned segments:
Global Energy Balls by Nature:
Global Energy Balls by Flavor:
Global Energy Balls by Region:
Research has its special purpose to undertake marketing efficiently. In this competitive scenario, businesses need information across all industry verticals; the information about customer wants, market demand, competition, industry trends, distribution channels etc. This information needs to be updated regularly because businesses operate in a dynamic environment. Our organization, The Brainy Insights incorporates scientific and systematic research procedures in order to get proper market insights and industry analysis for overall business success. The analysis consists of studying the market from a miniscule level wherein we implement statistical tools which helps us in examining the data with accuracy and precision.
Our research reports feature both; quantitative and qualitative aspects for any market. Qualitative information for any market research process are fundamental because they reveal the customer needs and wants, usage and consumption for any product/service related to a specific industry. This in turn aids the marketers/investors in knowing certain perceptions of the customers. Qualitative research can enlighten about the different product concepts and designs along with unique service offering that in turn, helps define marketing problems and generate opportunities. On the other hand, quantitative research engages with the data collection process through interviews, e-mail interactions, surveys and pilot studies. Quantitative aspects for the market research are useful to validate the hypotheses generated during qualitative research method, explore empirical patterns in the data with the help of statistical tools, and finally make the market estimations.
The Brainy Insights offers comprehensive research and analysis, based on a wide assortment of factual insights gained through interviews with CXOs and global experts and secondary data from reliable sources. Our analysts and industry specialist assume vital roles in building up statistical tools and analysis models, which are used to analyse the data and arrive at accurate insights with exceedingly informative research discoveries. The data provided by our organization have proven precious to a diverse range of companies, facilitating them to address issues such as determining which products/services are the most appealing, whether or not customers use the product in the manner anticipated, the purchasing intentions of the market and many others.
Our research methodology encompasses an idyllic combination of primary and secondary initiatives. Key phases involved in this process are listed below:

The phase involves the gathering and collecting of market data and its related information with the help of different sources & research procedures.

The data procurement stage involves in data gathering and collecting through various data sources.
This stage involves in extensive research. These data sources includes:
Purchased Database: Purchased databases play a crucial role in estimating the market sizes irrespective of the domain. Our purchased database includes:
Primary Research: The Brainy Insights interacts with leading companies and experts of the concerned domain to develop the analyst team’s market understanding and expertise. It improves and substantiates every single data presented in the market reports. Primary research mainly involves in telephonic interviews, E-mail interactions and face-to-face interviews with the raw material providers, manufacturers/producers, distributors, & independent consultants. The interviews that we conduct provides valuable data on market size and industry growth trends prevailing in the market. Our organization also conducts surveys with the various industry experts in order to gain overall insights of the industry/market. For instance, in healthcare industry we conduct surveys with the pharmacists, doctors, surgeons and nurses in order to gain insights and key information of a medical product/device/equipment which the customers are going to usage. Surveys are conducted in the form of questionnaire designed by our own analyst team. Surveys plays an important role in primary research because surveys helps us to identify the key target audiences of the market. Additionally, surveys helps to identify the key target audience engaged with the market. Our survey team conducts the survey by targeting the key audience, thus gaining insights from them. Based on the perspectives of the customers, this information is utilized to formulate market strategies. Moreover, market surveys helps us to understand the current competitive situation of the industry. To be precise, our survey process typically involve with the 360 analysis of the market. This analytical process begins by identifying the prospective customers for a product or service related to the market/industry to obtain data on how a product/service could fit into customers’ lives.

Secondary Research: The secondary data sources includes information published by the on-profit organizations such as World bank, WHO, company fillings, investor presentations, annual reports, national government documents, statistical databases, blogs, articles, white papers and others. From the annual report, we analyse a company’s revenue to understand the key segment and market share of that organization in a particular region. We analyse the company websites and adopt the product mapping technique which is important for deriving the segment revenue. In the product mapping method, we select and categorize the products offered by the companies catering to domain specific market, deduce the product revenue for each of the companies so as to get overall estimation of the market size. We also source data and analyses trends based on information received from supply side and demand side intermediaries in the value chain. The supply side denotes the data gathered from supplier, distributor, wholesaler and the demand side illustrates the data gathered from the end customers for respective market domain.

The supply side for a domain specific market is analysed by:
The demand side for the market is estimated through:
In-house Library: Apart from these third-party sources, we have our in-house library of qualitative and quantitative information. Our in-house database includes market data for various industry and domains. These data are updated on regular basis as per the changing market scenario. Our library includes, historic databases, internal audit reports and archives.
Sometimes there are instances where there is no metadata or raw data available for any domain specific market. For those cases, we use our expertise to forecast and estimate the market size in order to generate comprehensive data sets. Our analyst team adopt a robust research technique in order to produce the estimates:
Data Synthesis: This stage involves the analysis & mapping of all the information obtained from the previous step. It also involves in scrutinizing the data for any discrepancy observed while data gathering related to the market. The data is collected with consideration to the heterogeneity of sources. Robust scientific techniques are in place for synthesizing disparate data sets and provide the essential contextual information that can orient market strategies. The Brainy Insights has extensive experience in data synthesis where the data passes through various stages:


Market Deduction & Formulation: The final stage comprises of assigning data points at appropriate market spaces so as to deduce feasible conclusions. Analyst perspective & subject matter expert based holistic form of market sizing coupled with industry analysis also plays a crucial role in this stage.
This stage involves in finalization of the market size and numbers that we have collected from data integration step. With data interpolation, it is made sure that there is no gap in the market data. Successful trend analysis is done by our analysts using extrapolation techniques, which provide the best possible forecasts for the market.
Data Validation & Market Feedback: Validation is the most important step in the process. Validation & re-validation via an intricately designed process helps us finalize data-points to be used for final calculations.

The Brainy Insights interacts with leading companies and experts of the concerned domain to develop the analyst team’s market understanding and expertise. It improves and substantiates every single data presented in the market reports. The data validation interview and discussion panels are typically composed of the most experienced industry members. The participants include, however, are not limited to:
Moreover, we always validate our data and findings through primary respondents from all the major regions we are working on.


Free Customization
Fortune 500 Clients
Free Yearly Update On Purchase Of Multi/Corporate License
Companies Served Till Date