- +1-315-215-1633
- sales@thebrainyinsights.com

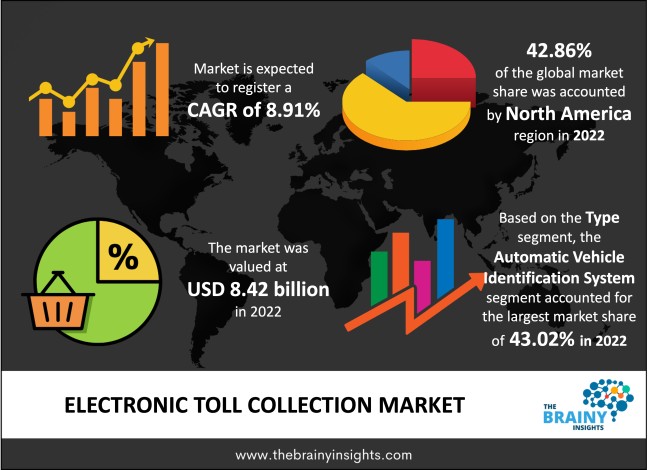
The global electronic toll collection market was valued at USD 8.42 Billion in 2022 and grew at a CAGR of 8.91% from 2023 to 2032. The market is expected to reach USD 19.76 Billion by 2032. There are various electronic toll collection is installed in urban cities and highways. Further, developing several technologies is leading to the market's growth.
A continuous toll collection system is called electronic toll collection. With the use of different technology, it has become the most sophisticated road and bridge toll collection system in the world. By electronically collecting tolls, electronic toll collection technology was created to remove delays on toll highways. When a car uses a toll road, toll bridge, HOV lane, or toll tunnel, a wireless technology called electronic toll collection is used to collect the usage fee or toll automatically. Most systems require automated radio transponder devices to be installed in automobiles. To allow drivers without transponders to pay at the booth, electronic toll lanes may be used in addition to traditional toll booths. An increasingly common alternative to toll booths is open road tolling, which involves installing electronic readers beside or over the road to read transponders as cars pass at highway speeds. This eliminates traffic jams caused by cars slowing down to pass through a toll booth lane.
Get an overview of this study by requesting a free sample
Increasing use of electronic toll collection on highways and roads: The benefits of the nationally interoperable electronic toll collection system include increased efficiency at toll plazas and the ability for transport operators to track fleet movement. One of ETC's main advantages over other, more labour-intensive toll collection methods is its ability to speed up the collection of these fees, giving toll service providers the ability to better/more efficiently manage the road and infrastructure and, consequently, enhance traffic flow. Fuel savings are facilitated by the electronic tolling system's complete elimination of acceleration, idling, and deceleration. With the electronic toll-collecting system, cash-handling challenges are removed. ETC systems are well-liked by drivers since they can minimize or completely eradicate the delays sometimes connected to conventional toll roads.
High instalment cost: The electronic toll collection has a high capital requirement. Many developing countries can only install electronic tolls on some highways and commercial roads. Apart from the high initial cost, the maintenance cost of the electronic toll collection is also hindering the market growth. Thus, the high setting cost associated with the machine is restricting market growth.
Investment in the transportation infrastructure: Infrastructure investment includes building new transport facilities as well as making improvements to the current network. One important factor influencing performance in the transport sector is infrastructure investment. Developed and developing nations can benefit economically and socially from efficient transportation infrastructure because it increases market accessibility and productivity, ensures balanced regional economic development, encourages labour mobility, and connects communities. Although only one-third of the evaluated enterprises are involved in environmental toll schemes or the supply of infrastructure for electric vehicles, the performance of road infrastructure is primarily tied to the development of electronic toll collection.
The regions analyzed for the market include North America, Europe, South America, Asia Pacific, the Middle East, and Africa. North America emerged as the most significant Electronic Toll Collection market, with a 42.86% market revenue share in 2022.
North America region will account for the largest market share with revenue growth. Nations such as the U.S. and Canada have a tremendous demand for electronic toll collection due to the growing usage of it in urban areas and highways. Further, adopting advanced technologies is leading to the development of modern roadways, which can ease traffic. Additionally, the development of tracking and monitoring devices equipped with different technologies is leading to the growth of the electronic toll collection market.
North America region Electronic Toll Collection Market Share in 2022 - 42.86%
www.thebrainyinsights.com
Check the geographical analysis of this market by requesting a free sample
The type segment is divided into automatic vehicle identification system, automatic vehicle classification system, violation enforcement system and others. The automatic vehicle identification system segment dominated the market, with a share of around 43.02% in 2022. With an automatic vehicle identification system, it is possible to identify cars in various traffic scenarios in a safe, dependable, and economical manner. AVI is useful for various applications, including access management, speed control, and electronic toll collecting.
The technology segment is divided into DSRC, RFID, GPS, GNSS and others. The RFID segment dominated the market, with a share of around 41.19% in 2022. Rather than paying for each use of the toll road, drivers can pay for their usage on a weekly, monthly, or annual basis by using RFID technology to read account data connected with specific toll passes. Due to the necessary read range, UHF Passive or Active RFID is usually used in RFID tolling applications.
The end-users segment is divided into highway and urban areas. The urban areas segment dominated the market, with a share of around 65.93% in 2022. It is common knowledge that one of the main difficulties of living in an urban area is traffic. Smart electronic tolling systems are being introduced as a solution to this problem. Charges paid by cars entering downtown regions, particularly in city centres, can regulate the temporal and spatial distribution of traffic flows.
The offering segment is divided into hardware, back office and other services. The hardware segment dominated the market, with a share of around 59.12% in 2022. The system's numerous hardware parts allow it to accurately and securely collect tolls. To ensure that the system runs accurately and consistently, the right hardware is required.
| Attribute | Description |
|---|---|
| Market Size | Revenue (USD Billion) |
| Market size value in 2022 | USD 8.42 Billion |
| Market size value in 2032 | USD 19.76 Billion |
| CAGR (2023 to 2032) | 8.91% |
| Historical data | 2019-2021 |
| Base Year | 2022 |
| Forecast | 2023-2032 |
| Region | The regions analyzed for the market are Asia Pacific, Europe, South America, North America, and Middle East & Africa. Furthermore, the regions are further analyzed at the country level. |
| Segments | Type, Technology, End-users and Offering |
As per The Brainy Insights, the size of the electronic toll collection market was valued USD 8.42 billion in 2022 to USD 19.76 billion by 2032.
Global electronic toll collection market is growing at a CAGR of 8.91% during the forecast period 2023-2032.
The global electronic toll collection market has been segmented based on type, technology, end-users, offering and regions. The automatic vehicle identification system segment led the market in 2022 in the type segment.
North America region emerged as the largest market for the electronic toll collection.
The market's growth will be influenced by the rising usage of electronic toll collection on highways and commercial areas.
The high cost of instalment can hamper the market growth.
The increasing investment in transportation infrastructure is providing lucrative opportunities to the market.
1. Introduction
1.1. Objectives of the Study
1.2. Market Definition
1.3. Research Scope
1.4. Currency
1.5. Key Target Audience
2. Research Methodology and Assumptions
3. Executive Summary
4. Premium Insights
4.1. Porter’s Five Forces Analysis
4.2. Value Chain Analysis
4.3. Top Investment Pockets
4.3.1. Market Attractiveness Analysis by Type
4.3.2. Market Attractiveness Analysis by Technology
4.3.3. Market Attractiveness Analysis by End-users
4.3.4. Market Attractiveness Analysis by Offering
4.3.5. Market Attractiveness Analysis by Region
4.4. Industry Trends
5. Market Dynamics
5.1. Market Evaluation
5.2. Drivers
5.2.1. Increasing usage of electronic toll collection
5.3. Restraints
5.3.1. High instalment cost
5.4. Opportunities
5.4.1. Increasing investment in transport construction
5.5. Challenges
5.5.1. Complication related to interoperability
6. Global Electronic Toll Collection Market Analysis and Forecast, By Type
6.1. Segment Overview
6.2. Automatic Vehicle Identification System
6.3. Automatic Vehicle Classification System
6.4. Violation Enforcement System
6.5. Others
7. Global Electronic Toll Collection Market Analysis and Forecast, By Technology
7.1. Segment Overview
7.2. DSRC
7.3. RFID
7.4. GPS
7.5. GNSS
7.6. Others
8. Global Electronic Toll Collection Market Analysis and Forecast, By End-users
8.1. Segment Overview
8.2. Highway
8.3. Urban Areas
9. Global Electronic Toll Collection Market Analysis and Forecast, By Offering
9.1. Segment Overview
9.2. Hardware
9.3. Back Office
9.4. Other Services
10. Global Electronic Toll Collection Market Analysis and Forecast, By Regional Analysis
10.1. Segment Overview
10.2. North America
10.2.1. U.S.
10.2.2. Canada
10.2.3. Mexico
10.3. Europe
10.3.1. Germany
10.3.2. France
10.3.3. U.K.
10.3.4. Italy
10.3.5. Spain
10.4. Asia-Pacific
10.4.1. Japan
10.4.2. China
10.4.3. India
10.5. South America
10.5.1. Brazil
10.6. Middle East and Africa
10.6.1. UAE
10.6.2. South Africa
11. Global Electronic Toll Collection Market-Competitive Landscape
11.1. Overview
11.2. Market Share of Key Players in the Electronic Toll Collection Market
11.2.1. Global Company Market Share
11.2.2. North America Company Market Share
11.2.3. Europe Company Market Share
11.2.4. APAC Company Market Share
11.3. Competitive Situations and Trends
11.3.1. Product Launches and Developments
11.3.2. Partnerships, Collaborations, and Agreements
11.3.3. Mergers & Acquisitions
11.3.4. Expansions
12. Company Profiles
12.1. TransCore
12.1.1. Business Overview
12.1.2. Company Snapshot
12.1.3. Company Market Share Analysis
12.1.4. Company Product Portfolio
12.1.5. Recent Developments
12.1.6. SWOT Analysis
12.2. Kapsch TrafficCom AG
12.2.1. Business Overview
12.2.2. Company Snapshot
12.2.3. Company Market Share Analysis
12.2.4. Company Product Portfolio
12.2.5. Recent Developments
12.2.6. SWOT Analysis
12.3. Conduent Inc.
12.3.1. Business Overview
12.3.2. Company Snapshot
12.3.3. Company Market Share Analysis
12.3.4. Company Product Portfolio
12.3.5. Recent Developments
12.3.6. SWOT Analysis
12.4. Raytheon Company
12.4.1. Business Overview
12.4.2. Company Snapshot
12.4.3. Company Market Share Analysis
12.4.4. Company Product Portfolio
12.4.5. Recent Developments
12.4.6. SWOT Analysis
12.5. Thales Group
12.5.1. Business Overview
12.5.2. Company Snapshot
12.5.3. Company Market Share Analysis
12.5.4. Company Product Portfolio
12.5.5. Recent Developments
12.5.6. SWOT Analysis
12.6. Cubic Corporation
12.6.1. Business Overview
12.6.2. Company Snapshot
12.6.3. Company Market Share Analysis
12.6.4. Company Product Portfolio
12.6.5. Recent Developments
12.6.6. SWOT Analysis
12.7. Siemens AG
12.7.1. Business Overview
12.7.2. Company Snapshot
12.7.3. Company Market Share Analysis
12.7.4. Company Product Portfolio
12.7.5. Recent Developments
12.7.6. SWOT Analysis
12.8. Vinci SA
12.8.1. Business Overview
12.8.2. Company Snapshot
12.8.3. Company Market Share Analysis
12.8.4. Company Product Portfolio
12.8.5. Recent Developments
12.8.6. SWOT Analysis
12.9. EFKON
12.9.1. Business Overview
12.9.2. Company Snapshot
12.9.3. Company Market Share Analysis
12.9.4. Company Product Portfolio
12.9.5. Recent Developments
12.9.6. SWOT Analysis
12.10. TOSHIBA CORPORATION
12.10.1. Business Overview
12.10.2. Company Snapshot
12.10.3. Company Market Share Analysis
12.10.4. Company Product Portfolio
12.10.5. Recent Developments
12.10.6. SWOT Analysis
12.11. Neology Inc.
12.11.1. Business Overview
12.11.2. Company Snapshot
12.11.3. Company Market Share Analysis
12.11.4. Company Product Portfolio
12.11.5. Recent Developments
12.11.6. SWOT Analysis
12.12. MITSUBISHI HEAVY INDUSTRIES LTD
12.12.1. Business Overview
12.12.2. Company Snapshot
12.12.3. Company Market Share Analysis
12.12.4. Company Product Portfolio
12.12.5. Recent Developments
12.12.6. SWOT Analysis
12.13. Quarterhill Inc.
12.13.1. Business Overview
12.13.2. Company Snapshot
12.13.3. Company Market Share Analysis
12.13.4. Company Product Portfolio
12.13.5. Recent Developments
12.13.6. SWOT Analysis
12.14. Abertis
12.14.1. Business Overview
12.14.2. Company Snapshot
12.14.3. Company Market Share Analysis
12.14.4. Company Product Portfolio
12.14.5. Recent Developments
12.14.6. SWOT Analysis
12.15. Perceptics LLC
12.15.1. Business Overview
12.15.2. Company Snapshot
12.15.3. Company Market Share Analysis
12.15.4. Company Product Portfolio
12.15.5. Recent Developments
12.15.6. SWOT Analysis
12.16. Electronic Transaction Consultants Corporation
12.16.1. Business Overview
12.16.2. Company Snapshot
12.16.3. Company Market Share Analysis
12.16.4. Company Product Portfolio
12.16.5. Recent Developments
12.16.6. SWOT Analysis
12.17. Star Systems International
12.17.1. Business Overview
12.17.2. Company Snapshot
12.17.3. Company Market Share Analysis
12.17.4. Company Product Portfolio
12.17.5. Recent Developments
12.17.6. SWOT Analysis
12.18. ARH Inc.
12.18.1. Business Overview
12.18.2. Company Snapshot
12.18.3. Company Market Share Analysis
12.18.4. Company Product Portfolio
12.18.5. Recent Developments
12.18.6. SWOT Analysis
12.19. Autostrade per l'Italia
12.19.1. Business Overview
12.19.2. Company Snapshot
12.19.3. Company Market Share Analysis
12.19.4. Company Product Portfolio
12.19.5. Recent Developments
12.19.6. SWOT Analysis
12.20. SICE
12.20.1. Business Overview
12.20.2. Company Snapshot
12.20.3. Company Market Share Analysis
12.20.4. Company Product Portfolio
12.20.5. Recent Developments
12.20.6. SWOT Analysis
12.21. JENOPTIK AG
12.21.1. Business Overview
12.21.2. Company Snapshot
12.21.3. Company Market Share Analysis
12.21.4. Company Product Portfolio
12.21.5. Recent Developments
12.21.6. SWOT Analysis
12.22. Toll Collect GmbH
12.22.1. Business Overview
12.22.2. Company Snapshot
12.22.3. Company Market Share Analysis
12.22.4. Company Product Portfolio
12.22.5. Recent Developments
12.22.6. SWOT Analysis
12.23. Far Eastern Electronic Toll Collection Co Ltd.
12.23.1. Business Overview
12.23.2. Company Snapshot
12.23.3. Company Market Share Analysis
12.23.4. Company Product Portfolio
12.23.5. Recent Developments
12.23.6. SWOT Analysis
12.24. Kistler Group
12.24.1. Business Overview
12.24.2. Company Snapshot
12.24.3. Company Market Share Analysis
12.24.4. Company Product Portfolio
12.24.5. Recent Developments
12.24.6. SWOT Analysis
12.25. American Traffic Solutions
12.25.1. Business Overview
12.25.2. Company Snapshot
12.25.3. Company Market Share Analysis
12.25.4. Company Product Portfolio
12.25.5. Recent Developments
12.25.6. SWOT Analysis
List of Table
1. Global Electronic Toll Collection Market, By Type, 2019-2032 (USD Billion)
2. Global Automatic Vehicle Identification System, Electronic Toll Collection Market, By Region, 2019-2032 (USD Billion)
3. Global Automatic Vehicle Classification System, Electronic Toll Collection Market, By Region, 2019-2032 (USD Billion)
4. Global Violation Enforcement System, Electronic Toll Collection Market, By Region, 2019-2032 (USD Billion)
5. Global Others, Electronic Toll Collection Market, By Region, 2019-2032 (USD Billion)
6. Global Electronic Toll Collection Market, By Technology, 2019-2032 (USD Billion)
7. Global DSRC, Electronic Toll Collection Market, By Region, 2019-2032 (USD Billion)
8. Global RFID, Electronic Toll Collection Market, By Region, 2019-2032 (USD Billion)
9. Global GPS, Electronic Toll Collection Market, By Region, 2019-2032 (USD Billion)
10. Global GNSS, Electronic Toll Collection Market, By Region, 2019-2032 (USD Billion)
11. Global Others, Electronic Toll Collection Market, By Region, 2019-2032 (USD Billion)
12. Global Electronic Toll Collection Market, By End-users, 2019-2032 (USD Billion)
13. Global Highway, Electronic Toll Collection Market, By Region, 2019-2032 (USD Billion)
14. Global Urban Areas, Electronic Toll Collection Market, By Region, 2019-2032 (USD Billion)
15. Global Electronic Toll Collection Market, By Offering, 2019-2032 (USD Billion)
16. Global Hardware, Electronic Toll Collection Market, By Region, 2019-2032 (USD Billion)
17. Global Back Office, Electronic Toll Collection Market, By Region, 2019-2032 (USD Billion)
18. Global Other Services, Electronic Toll Collection Market, By Region, 2019-2032 (USD Billion)
19. Global Electronic Toll Collection Market, By Region, 2019-2032 (USD Billion)
20. North America Electronic Toll Collection Market, By Type, 2019-2032 (USD Billion)
21. North America Electronic Toll Collection Market, By Technology, 2019-2032 (USD Billion)
22. North America Electronic Toll Collection Market, By End-users, 2019-2032 (USD Billion)
23. North America Electronic Toll Collection Market, By Offering, 2019-2032 (USD Billion)
24. U.S. Electronic Toll Collection Market, By Type, 2019-2032 (USD Billion)
25. U.S. Electronic Toll Collection Market, By Technology, 2019-2032 (USD Billion)
26. U.S. Electronic Toll Collection Market, By End-users, 2019-2032 (USD Billion)
27. U.S. Electronic Toll Collection Market, By Offering, 2019-2032 (USD Billion)
28. Canada Electronic Toll Collection Market, By Type, 2019-2032 (USD Billion)
29. Canada Electronic Toll Collection Market, By Technology, 2019-2032 (USD Billion)
30. Canada Electronic Toll Collection Market, By End-users, 2019-2032 (USD Billion)
31. Canada Electronic Toll Collection Market, By Offering, 2019-2032 (USD Billion)
32. Mexico Electronic Toll Collection Market, By Type, 2019-2032 (USD Billion)
33. Mexico Electronic Toll Collection Market, By Technology, 2019-2032 (USD Billion)
34. Mexico Electronic Toll Collection Market, By End-users, 2019-2032 (USD Billion)
35. Mexico Electronic Toll Collection Market, By Offering, 2019-2032 (USD Billion)
36. Europe Electronic Toll Collection Market, By Type, 2019-2032 (USD Billion)
37. Europe Electronic Toll Collection Market, By Technology, 2019-2032 (USD Billion)
38. Europe Electronic Toll Collection Market, By End-users, 2019-2032 (USD Billion)
39. Europe Electronic Toll Collection Market, By Offering, 2019-2032 (USD Billion)
40. Germany Electronic Toll Collection Market, By Type, 2019-2032 (USD Billion)
41. Germany Electronic Toll Collection Market, By Technology, 2019-2032 (USD Billion)
42. Germany Electronic Toll Collection Market, By End-users, 2019-2032 (USD Billion)
43. Germany Electronic Toll Collection Market, By Offering, 2019-2032 (USD Billion)
44. France Electronic Toll Collection Market, By Type, 2019-2032 (USD Billion)
45. France Electronic Toll Collection Market, By Technology, 2019-2032 (USD Billion)
46. France Electronic Toll Collection Market, By End-users, 2019-2032 (USD Billion)
47. France Electronic Toll Collection Market, By Offering, 2019-2032 (USD Billion)
48. U.K. Electronic Toll Collection Market, By Type, 2019-2032 (USD Billion)
49. U.K. Electronic Toll Collection Market, By Technology, 2019-2032 (USD Billion)
50. U.K. Electronic Toll Collection Market, By End-users, 2019-2032 (USD Billion)
51. U.K. Electronic Toll Collection Market, By Offering, 2019-2032 (USD Billion)
52. Italy Electronic Toll Collection Market, By Type, 2019-2032 (USD Billion)
53. Italy Electronic Toll Collection Market, By Technology, 2019-2032 (USD Billion)
54. Italy Electronic Toll Collection Market, By End-users, 2019-2032 (USD Billion)
55. Italy Electronic Toll Collection Market, By Offering, 2019-2032 (USD Billion)
56. Spain Electronic Toll Collection Market, By Type, 2019-2032 (USD Billion)
57. Spain Electronic Toll Collection Market, By Technology, 2019-2032 (USD Billion)
58. Spain Electronic Toll Collection Market, By End-users, 2019-2032 (USD Billion)
59. Spain Electronic Toll Collection Market, By Offering, 2019-2032 (USD Billion)
60. Asia Pacific Electronic Toll Collection Market, By Type, 2019-2032 (USD Billion)
61. Asia Pacific Electronic Toll Collection Market, By Technology, 2019-2032 (USD Billion)
62. Asia Pacific Electronic Toll Collection Market, By End-users, 2019-2032 (USD Billion)
63. Asia Pacific Electronic Toll Collection Market, By Offering, 2019-2032 (USD Billion)
64. Japan Electronic Toll Collection Market, By Type, 2019-2032 (USD Billion)
65. Japan Electronic Toll Collection Market, By Technology, 2019-2032 (USD Billion)
66. Japan Electronic Toll Collection Market, By End-users, 2019-2032 (USD Billion)
67. Japan Electronic Toll Collection Market, By Offering, 2019-2032 (USD Billion)
68. China Electronic Toll Collection Market, By Type, 2019-2032 (USD Billion)
69. China Electronic Toll Collection Market, By Technology, 2019-2032 (USD Billion)
70. China Electronic Toll Collection Market, By End-users, 2019-2032 (USD Billion)
71. China Electronic Toll Collection Market, By Offering, 2019-2032 (USD Billion)
72. India Electronic Toll Collection Market, By Type, 2019-2032 (USD Billion)
73. India Electronic Toll Collection Market, By Technology, 2019-2032 (USD Billion)
74. India Electronic Toll Collection Market, By End-users, 2019-2032 (USD Billion)
75. India Electronic Toll Collection Market, By Offering, 2019-2032 (USD Billion)
76. South America Electronic Toll Collection Market, By Type, 2019-2032 (USD Billion)
77. South America Electronic Toll Collection Market, By Technology, 2019-2032 (USD Billion)
78. South America Electronic Toll Collection Market, By End-users, 2019-2032 (USD Billion)
79. South America Electronic Toll Collection Market, By Offering, 2019-2032 (USD Billion)
80. Brazil Electronic Toll Collection Market, By Type, 2019-2032 (USD Billion)
81. Brazil Electronic Toll Collection Market, By Technology, 2019-2032 (USD Billion)
82. Brazil Electronic Toll Collection Market, By End-users, 2019-2032 (USD Billion)
83. BrazilElectronic Toll Collection Market, By Offering, 2019-2032 (USD Billion)
84. Middle East and Africa Electronic Toll Collection Market, By Type, 2019-2032 (USD Billion)
85. Middle East and Africa Electronic Toll Collection Market, By Technology, 2019-2032 (USD Billion)
86. Middle East and Africa Electronic Toll Collection Market, By End-users, 2019-2032 (USD Billion)
87. Middle East and Africa Electronic Toll Collection Market, By Offering, 2019-2032 (USD Billion)
88. UAE Electronic Toll Collection Market, By Type, 2019-2032 (USD Billion)
89. UAE Electronic Toll Collection Market, By Technology, 2019-2032 (USD Billion)
90. UAE Electronic Toll Collection Market, By End-users, 2019-2032 (USD Billion)
91. UAE Electronic Toll Collection Market, By Offering, 2019-2032 (USD Billion)
92. South Africa Electronic Toll Collection Market, By Type, 2019-2032 (USD Billion)
93. South Africa Electronic Toll Collection Market, By Technology, 2019-2032 (USD Billion)
94. South Africa Electronic Toll Collection Market, By End-users, 2019-2032 (USD Billion)
95. South Africa Electronic Toll Collection Market, By Offering, 2019-2032 (USD Billion)
List of Figures
1. Global Electronic Toll Collection Market Segmentation
2. Electronic Toll Collection Market: Research Methodology
3. Market Size Estimation Methodology: Bottom-Up Approach
4. Market Size Estimation Methodology: Top-Down Approach
5. Data Triangulation
6. Porter’s Five Forces Analysis
7. Value Chain Analysis
8. Global Electronic Toll Collection Market Attractiveness Analysis by Type
9. Global Electronic Toll Collection Market Attractiveness Analysis by Technology
10. Global Electronic Toll Collection Market Attractiveness Analysis by End-users
11. Global Electronic Toll Collection Market Attractiveness Analysis by Offering
12. Global Electronic Toll Collection Market Attractiveness Analysis by Region
13. Global Electronic Toll Collection Market: Dynamics
14. Global Electronic Toll Collection Market Share by Type (2022 & 2032)
15. Global Electronic Toll Collection Market Share by Technology (2022 & 2032)
16. Global Electronic Toll Collection Market Share by End-users (2022 & 2032)
17. Global Electronic Toll Collection Market Share by Offering (2022 & 2032)
18. Global Electronic Toll Collection Market Share by Regions (2022 & 2032)
19. Global Electronic Toll Collection Market Share by Company (2022)
This study forecasts revenue at global, regional, and country levels from 2019 to 2032. The Brainy Insights has segmented the global electronic toll collection market based on below mentioned segments:
Global Electronic Toll Collection Market by Type:
Global Electronic Toll Collection Market by Technology:
Global Electronic Toll Collection Market by End-users:
Global Electronic Toll Collection Market by Offering:
Global Electronic toll collection Market by Region:
Research has its special purpose to undertake marketing efficiently. In this competitive scenario, businesses need information across all industry verticals; the information about customer wants, market demand, competition, industry trends, distribution channels etc. This information needs to be updated regularly because businesses operate in a dynamic environment. Our organization, The Brainy Insights incorporates scientific and systematic research procedures in order to get proper market insights and industry analysis for overall business success. The analysis consists of studying the market from a miniscule level wherein we implement statistical tools which helps us in examining the data with accuracy and precision.
Our research reports feature both; quantitative and qualitative aspects for any market. Qualitative information for any market research process are fundamental because they reveal the customer needs and wants, usage and consumption for any product/service related to a specific industry. This in turn aids the marketers/investors in knowing certain perceptions of the customers. Qualitative research can enlighten about the different product concepts and designs along with unique service offering that in turn, helps define marketing problems and generate opportunities. On the other hand, quantitative research engages with the data collection process through interviews, e-mail interactions, surveys and pilot studies. Quantitative aspects for the market research are useful to validate the hypotheses generated during qualitative research method, explore empirical patterns in the data with the help of statistical tools, and finally make the market estimations.
The Brainy Insights offers comprehensive research and analysis, based on a wide assortment of factual insights gained through interviews with CXOs and global experts and secondary data from reliable sources. Our analysts and industry specialist assume vital roles in building up statistical tools and analysis models, which are used to analyse the data and arrive at accurate insights with exceedingly informative research discoveries. The data provided by our organization have proven precious to a diverse range of companies, facilitating them to address issues such as determining which products/services are the most appealing, whether or not customers use the product in the manner anticipated, the purchasing intentions of the market and many others.
Our research methodology encompasses an idyllic combination of primary and secondary initiatives. Key phases involved in this process are listed below:

The phase involves the gathering and collecting of market data and its related information with the help of different sources & research procedures.

The data procurement stage involves in data gathering and collecting through various data sources.
This stage involves in extensive research. These data sources includes:
Purchased Database: Purchased databases play a crucial role in estimating the market sizes irrespective of the domain. Our purchased database includes:
Primary Research: The Brainy Insights interacts with leading companies and experts of the concerned domain to develop the analyst team’s market understanding and expertise. It improves and substantiates every single data presented in the market reports. Primary research mainly involves in telephonic interviews, E-mail interactions and face-to-face interviews with the raw material providers, manufacturers/producers, distributors, & independent consultants. The interviews that we conduct provides valuable data on market size and industry growth trends prevailing in the market. Our organization also conducts surveys with the various industry experts in order to gain overall insights of the industry/market. For instance, in healthcare industry we conduct surveys with the pharmacists, doctors, surgeons and nurses in order to gain insights and key information of a medical product/device/equipment which the customers are going to usage. Surveys are conducted in the form of questionnaire designed by our own analyst team. Surveys plays an important role in primary research because surveys helps us to identify the key target audiences of the market. Additionally, surveys helps to identify the key target audience engaged with the market. Our survey team conducts the survey by targeting the key audience, thus gaining insights from them. Based on the perspectives of the customers, this information is utilized to formulate market strategies. Moreover, market surveys helps us to understand the current competitive situation of the industry. To be precise, our survey process typically involve with the 360 analysis of the market. This analytical process begins by identifying the prospective customers for a product or service related to the market/industry to obtain data on how a product/service could fit into customers’ lives.

Secondary Research: The secondary data sources includes information published by the on-profit organizations such as World bank, WHO, company fillings, investor presentations, annual reports, national government documents, statistical databases, blogs, articles, white papers and others. From the annual report, we analyse a company’s revenue to understand the key segment and market share of that organization in a particular region. We analyse the company websites and adopt the product mapping technique which is important for deriving the segment revenue. In the product mapping method, we select and categorize the products offered by the companies catering to domain specific market, deduce the product revenue for each of the companies so as to get overall estimation of the market size. We also source data and analyses trends based on information received from supply side and demand side intermediaries in the value chain. The supply side denotes the data gathered from supplier, distributor, wholesaler and the demand side illustrates the data gathered from the end customers for respective market domain.

The supply side for a domain specific market is analysed by:
The demand side for the market is estimated through:
In-house Library: Apart from these third-party sources, we have our in-house library of qualitative and quantitative information. Our in-house database includes market data for various industry and domains. These data are updated on regular basis as per the changing market scenario. Our library includes, historic databases, internal audit reports and archives.
Sometimes there are instances where there is no metadata or raw data available for any domain specific market. For those cases, we use our expertise to forecast and estimate the market size in order to generate comprehensive data sets. Our analyst team adopt a robust research technique in order to produce the estimates:
Data Synthesis: This stage involves the analysis & mapping of all the information obtained from the previous step. It also involves in scrutinizing the data for any discrepancy observed while data gathering related to the market. The data is collected with consideration to the heterogeneity of sources. Robust scientific techniques are in place for synthesizing disparate data sets and provide the essential contextual information that can orient market strategies. The Brainy Insights has extensive experience in data synthesis where the data passes through various stages:


Market Deduction & Formulation: The final stage comprises of assigning data points at appropriate market spaces so as to deduce feasible conclusions. Analyst perspective & subject matter expert based holistic form of market sizing coupled with industry analysis also plays a crucial role in this stage.
This stage involves in finalization of the market size and numbers that we have collected from data integration step. With data interpolation, it is made sure that there is no gap in the market data. Successful trend analysis is done by our analysts using extrapolation techniques, which provide the best possible forecasts for the market.
Data Validation & Market Feedback: Validation is the most important step in the process. Validation & re-validation via an intricately designed process helps us finalize data-points to be used for final calculations.

The Brainy Insights interacts with leading companies and experts of the concerned domain to develop the analyst team’s market understanding and expertise. It improves and substantiates every single data presented in the market reports. The data validation interview and discussion panels are typically composed of the most experienced industry members. The participants include, however, are not limited to:
Moreover, we always validate our data and findings through primary respondents from all the major regions we are working on.


Free Customization
Fortune 500 Clients
Free Yearly Update On Purchase Of Multi/Corporate License
Companies Served Till Date