- +1-315-215-1633
- sales@thebrainyinsights.com

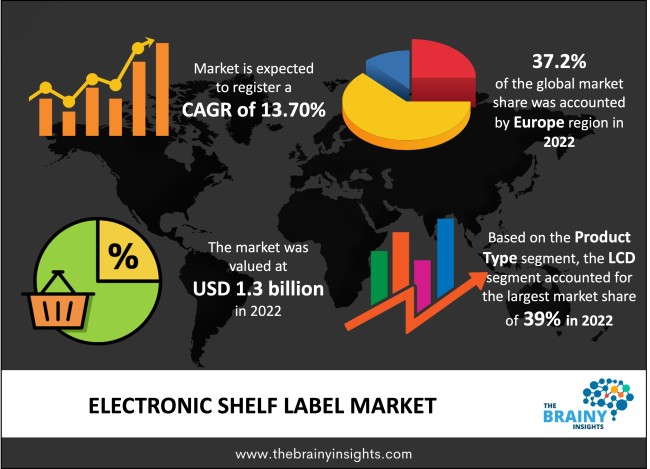
The global electronic shelf label market was valued at USD 1.3 billion in 2022 and growing at a CAGR of 13.70% from 2023 to 2032.The market is expected to reach USD 4.6 billion by 2032. The rise of the organized retail industry in developing countries is one of the essential drivers pushing industry growth due to influential macroeconomic variables and the spread of the Internet in China and India. Retailers are executing robotic technologies, such as Electronic Shelf labels, which can successfully perform the increasing middle-class consumer base.
It is a tool utilised by retailers to show the price of each product to the consumer, and the prices are automatically updated whenever the communication network changes price. Electronic shelf label allows promotion prices and guarantees that the customers see all the optimal prices. It allows to correct any pricing errors without spending more time and effort. Electronic Shelf labels exist on shelves in a fixed place; that can be stored at a certain period. Similarly, it gives high-accuracy prices that will be presented clearly, and it takes a few seconds to correct the prices on electronic shelf labels if any error happens. Electronic shelf labels allow retailers to revise prices instantly across the store, eliminating days of boring and error-prone manual work. With ESL, retailers can enhance pricing accuracy and efficiency, optimize click and collect, and promote replacement. Store operators can respond fast to market costs and sync pricing to keep up with the online competition. Electronic shelf labels allow consumers to see the accurate price and get personalized instantly, in-depth product information forming a smooth in-store and online shopping experience with price clarity. Reliable and strong wireless communications are necessary for electronic shelf labels. Generally, they work in complex RF environments, and the networks can have tens of thousands of devices or more. The price updates are also highly essential operations which must succeed every single time. Stock management will be more accessible by adopting the electronic shelf labels solution, which helps understand the stock levels. One can also choose when to run promotions on specific items, especially items about to expire can run promotions before they pass their sell-by-date.
Get an overview of this study by requesting a free sample
Real-Time In-Store Display- The real-time in-store display can help customers by delivering safe and reliable data and point-of-sale managers. Price display management is a crucial challenge for any store manager. Display control by shelf type (groceries, fresh produce, clothing, books, and toys) product type, and promotion or product is accomplished remotely and updated in real time which allows complete price control and ensures greater consumer satisfaction with price accuracy.
The Increased Installation Cost for Electronic Shelf Label- Computerization has increased ROI, but noticing a profit takes time. Resulting in retailers with tight migration budgets taking extended time to implement total automation solutions, which is expected to hinder the market's development. Further, new retailers may need help deploying electronic shelf label (ESL) technology. The development of retail stores requires the installation of more additional shelves, and the retailer must allot one electronic shelf label tag per shelf.
Provide Eco-Friendly Solution- Unlike the heavy ecological footprint of traditional paper labels, with electronic shelf labels, this problem is minor. Rather than changing and eliminating adhesive paper labels every time an update is needed, Pricer Electronic Shelf Label allows retailers to change prices fast and in real-time for at least ten years. In expansion, ESL has low power consumption with long-lasting batteries. Once the battery is used up, the old ESL are recycled, reducing the carbon footprint of retailers.
The regions analyzed for the market include North America, Europe, South America, Asia Pacific, the Middle East, and Africa. Europe emerged as the largest market for the global electronic shelf label market, with a 37.2% share of the market revenue in 2022.
The market in Europe is anticipated to dominate the market revenue share during the projection time due to increasing activities by key market players in nations in the region. For example, modern retail requirements are fast and require innovative digital solutions without compromising sustainability. In partnership with Swedish Epishine, Pricer, a leading provider of shelf-edge automation and communication solutions, will explore the potential of a new generation of cutting-edge ESL self-powered by light.
Europe Region Electronic Shelf Label Market Share in 2022 - 37.2%
www.thebrainyinsights.com
Check the geographical analysis of this market by requesting a free sample
The product type segment is divided into Segmented E-Paper, Full-Graphic E-Paper, and LCD. The LCD segment dominated the market, with a market share of around 39% in 2022. The traditional electronic shelf used liquid crystal displays (LCD), which were power intensive. Using these displays in Electronic Shelf labels is one of the latest trends in the display market.
The component segment is divided into batteries, transceiver, displays, microprocessors, and others. The display segment dominated the market, with a market share of around 25% in 2022. The display upgrades are majorly getting customers' attention to deliver real-time outcomes. Similarly, retailers are using labels created using full-graphic E-Paper display, as these energy-efficient labels can make graphical objects like callouts, logos, and others.
The application segment is divided into supermarkets, non-food retail stores, hypermarkets, specialty stores, and others. The hypermarket segment dominated the market, with a market share of around 17% in 2022. Digital technologies are expanding their use in hypermarkets as they showcase details to help customers better in-store navigation. Therefore, it is an important element anticipated to push the market development. In expansion, hypermarkets are promoting automation solutions to deliver customers with an Omni-commerce experience, which is also predicted to aid customers at a somewhat high rate.
| Attribute | Description |
|---|---|
| Market Size | Revenue (USD Billion) |
| Market size value in 2022 | USD 1.3 Billion |
| Market size value in 2032 | USD 4.6 Billion |
| CAGR (2023 to 2032) | 13.70% |
| Historical data | 2019-2021 |
| Base Year | 2022 |
| Forecast | 2023-2032 |
| Regional Segments | The regions analyzed for the market are Asia Pacific, Europe, South America, North America, and Middle East & Africa. Furthermore, the regions are further analyzed at the country level. |
| Segments | Product Type, Component, Application |
As per The Brainy Insights, the size of the electronic shelf label market was valued at USD 1.3 billion in 2022 to USD 4.6 billion by 2032.
Global electronic shelf label market is growing at a CAGR of 13.70% during the forecast period 2023-2032.
Europe region emerged as the largest market for the electronic shelf label market.
Real-time in-store display drives the market growth.
1. Introduction
1.1. Objectives of the Study
1.2. Market Definition
1.3. Research Scope
1.4. Currency
1.5. Key Target Audience
2. Research Methodology and Assumptions
3. Executive Summary
4. Premium Insights
4.1. Porter’s Five Forces Analysis
4.2. Value Chain Analysis
4.3. Top Investment Pockets
4.3.1. Market Attractiveness Analysis by Product Type
4.3.2. Market Attractiveness Analysis by Component
4.3.3. Market Attractiveness Analysis by Application
4.3.4. Market Attractiveness Analysis by Region
4.4. Industry Trends
5. Market Dynamics
5.1. Market Evaluation
5.2. Drivers
5.2.1. Real-Time In-Store Display
5.3. Restraints
5.3.1. The Increased Installation Cost for Electronic Shelf Label
5.4. Opportunities
5.4.1. Provide Eco-Friendly Solution
6. Global Electronic Shelf Label Market Analysis and Forecast, By Product Type:
6.1. Segment Overview
6.2. Segmented E-Paper
6.3. Full-Graphic E-Paper
6.4. LCD
7. Global Electronic Shelf Label Market Analysis and Forecast, By Component
7.1. Segment Overview
7.2. Batteries
7.3. Transceiver
7.4. Displays
7.5. Microprocessors
7.6. Others
8. Global Electronic Shelf Label Market Analysis and Forecast, By Application
8.1. Segment Overview
8.2. Supermarkets
8.3. Non-Food Retail Stores
8.4. Hypermarkets
8.5. Specialty Stores
8.6. Others
9. Global Electronic Shelf Label Market Analysis and Forecast, By Regional Analysis
9.1. Segment Overview
9.2. North America
9.2.1. U.S.
9.2.2. Canada
9.2.3. Mexico
9.3. Europe
9.3.1. Germany
9.3.2. France
9.3.3. U.K.
9.3.4. Italy
9.3.5. Spain
9.4. Asia-Pacific
9.4.1. Japan
9.4.2. China
9.4.3. India
9.5. South America
9.5.1. Brazil
9.6. Middle East and Africa
9.6.1. UAE
9.6.2. South Africa
10. Global Electronic Shelf Label Market-Competitive Landscape
10.1. Overview
10.2. Market Share of Key Players in the Electronic Shelf Label Market
10.2.1. Global Company Market Share
10.2.2. North America Company Market Share
10.2.3. Europe Company Market Share
10.2.4. APAC Company Market Share
10.3. Competitive Situations and Trends
10.3.1. Product Launches and Developments
10.3.2. Partnerships, Collaborations, and Agreements
10.3.3. Mergers & Acquisitions
10.3.4. Expansions
11. Company Profiles
11.1. Altieer Corporation
11.1.1. Business Overview
11.1.2. Company Snapshot
11.1.3. Company Market Share Analysis
11.1.4. Company Product Portfolio
11.1.5. Recent Developments
11.1.6. SWOT Analysis
11.2. Clearing Display.
11.2.1. Business Overview
11.2.2. Company Snapshot
11.2.3. Company Market Share Analysis
11.2.4. Company Product Portfolio
11.2.5. Recent Developments
11.2.6. SWOT Analysis
11.3. Diebold Nixdorf
11.3.1. Business Overview
11.3.2. Company Snapshot
11.3.3. Company Market Share Analysis
11.3.4. Company Product Portfolio
11.3.5. Recent Developments
11.3.6. SWOT Analysis
11.4. Displaydata Limited.
11.4.1. Business Overview
11.4.2. Company Snapshot
11.4.3. Company Market Share Analysis
11.4.4. Company Product Portfolio
11.4.5. Recent Developments
11.4.6. SWOT Analysis
11.5. E Ink Holdings Incorporation
11.5.1. Business Overview
11.5.2. Company Snapshot
11.5.3. Company Market Share Analysis
11.5.4. Company Product Portfolio
11.5.5. Recent Developments
11.5.6. SWOT Analysis
11.6. NCR Corporation.
11.6.1. Business Overview
11.6.2. Company Snapshot
11.6.3. Company Market Share Analysis
11.6.4. Company Product Portfolio
11.6.5. Recent Developments
11.6.6. SWOT Analysis
11.7. Panasonic Corporation.
11.7.1. Business Overview
11.7.2. Company Snapshot
11.7.3. Company Market Share Analysis
11.7.4. Company Product Portfolio
11.7.5. Recent Developments
11.7.6. SWOT Analysis
11.8. Pricer
11.8.1. Business Overview
11.8.2. Company Snapshot
11.8.3. Company Market Share Analysis
11.8.4. Company Product Portfolio
11.8.5. Recent Developments
11.8.6. SWOT Analysis
11.9. Samsung Electro-Mechanics
11.9.1. Business Overview
11.9.2. Company Snapshot
11.9.3. Company Market Share Analysis
11.9.4. Company Product Portfolio
11.9.5. Recent Developments
11.9.6. SWOT Analysis
11.10. SES-imagotag
11.10.1. Business Overview
11.10.2. Company Snapshot
11.10.3. Company Market Share Analysis
11.10.4. Company Product Portfolio
11.10.5. Recent Developments
11.10.6. SWOT Analysis
List of Table
1. Global Electronic Shelf Label Market, By Product Type, 2019-2032 (USD Billion)
2. Global Segmented E-Paper Electronic Shelf Label Market, By Region, 2019-2032 (USD Billion)
3. Global Full-Graphic E-Paper Electronic Shelf Label Market, By Region, 2019-2032 (USD Billion)
4. Global LCD Electronic Shelf Label Market, By Region, 2019-2032 (USD Billion)
5. Global Electronic Shelf Label Market, By Component, 2019-2032 (USD Billion)
6. Global Batteries Electronic Shelf Label Market, By Region, 2019-2032 (USD Billion)
7. Global Transceiver Electronic Shelf Label Market, By Region, 2019-2032 (USD Billion)
8. Global Displays Electronic Shelf Label Market, By Region, 2019-2032 (USD Billion)
9. Global Microprocessors Electronic Shelf Label Market, By Region, 2019-2032 (USD Billion)
10. Global Others Electronic Shelf Label Market, By Region, 2019-2032 (USD Billion)
11. Global Electronic Shelf Label Market, By Application, 2019-2032 (USD Billion)
12. Global Supermarkets Electronic Shelf Label Market, By Region, 2019-2032 (USD Billion)
13. Global Non-Food Retail Stores Electronic Shelf Label Market, By Region, 2019-2032 (USD Billion)
14. Global Hypermarkets Electronic Shelf Label Market, By Region, 2019-2032 (USD Billion)
15. Global Specialty Stores Electronic Shelf Label Market, By Region, 2019-2032 (USD Billion)
16. Global Others Electronic Shelf Label Market, By Region, 2019-2032 (USD Billion)
17. North America Electronic Shelf Label Market, By Product Type, 2019-2032 (USD Billion)
18. North America Electronic Shelf Label Market, By Component, 2019-2032 (USD Billion)
19. North America Electronic Shelf Label Market, By Application, 2019-2032 (USD Billion)
20. U.S. Electronic Shelf Label Market, By Product Type, 2019-2032 (USD Billion)
21. U.S. Electronic Shelf Label Market, By Component, 2019-2032 (USD Billion)
22. U.S. Electronic Shelf Label Market, By Application, 2019-2032 (USD Billion)
23. Canada Electronic Shelf Label Market, By Product Type, 2019-2032 (USD Billion)
24. Canada Electronic Shelf Label Market, By Component, 2019-2032 (USD Billion)
25. Canada Electronic Shelf Label Market, By Application, 2019-2032 (USD Billion)
26. Mexico Electronic Shelf Label Market, By Product Type, 2019-2032 (USD Billion)
27. Mexico Electronic Shelf Label Market, By Component, 2019-2032 (USD Billion)
28. Mexico Electronic Shelf Label Market, By Application, 2019-2032 (USD Billion)
29. Europe Electronic Shelf Label Market, By Product Type, 2019-2032 (USD Billion)
30. Europe Electronic Shelf Label Market, By Component, 2019-2032 (USD Billion)
31. Europe Electronic Shelf Label Market, By Application, 2019-2032 (USD Billion)
32. Germany Electronic Shelf Label Market, By Product Type, 2019-2032 (USD Billion)
33. Germany Electronic Shelf Label Market, By Component, 2019-2032 (USD Billion)
34. Germany Electronic Shelf Label Market, By Application, 2019-2032 (USD Billion)
35. France Electronic Shelf Label Market, By Product Type 2019-2032 (USD Billion)
36. France Electronic Shelf Label Market, By Component, 2019-2032 (USD Billion)
37. France Electronic Shelf Label Market, By Application, 2019-2032 (USD Billion)
38. U.K. Electronic Shelf Label Market, By Product Type, 2019-2032 (USD Billion)
39. U.K. Electronic Shelf Label Market, By Component, 2019-2032 (USD Billion)
40. U.K. Electronic Shelf Label Market, By Application, 2019-2032 (USD Billion)
41. Italy Electronic Shelf Label Market, By Product Type, 2019-2032 (USD Billion)
42. Italy Electronic Shelf Label Market, By Component, 2019-2032 (USD Billion)
43. Italy Electronic Shelf Label Market, By Application, 2019-2032 (USD Billion)
44. Spain Electronic Shelf Label Market, By Product Type, 2019-2032 (USD Billion)
45. Spain Electronic Shelf Label Market, By Component, 2019-2032 (USD Billion)
46. Spain Electronic Shelf Label Market, By Application, 2019-2032 (USD Billion)
47. Asia Pacific Electronic Shelf Label Market, By Product Type, 2019-2032 (USD Billion)
48. Asia Pacific Electronic Shelf Label Market, By Component, 2019-2032 (USD Billion)
49. Asia Pacific Electronic Shelf Label Market, By Application, 2019-2032 (USD Billion)
50. Japan Electronic Shelf Label Market, By Product Type, 2019-2032 (USD Billion)
51. Japan Electronic Shelf Label Market, By Component, 2019-2032 (USD Billion)
52. Japan Electronic Shelf Label Market, By Application, 2019-2032 (USD Billion)
53. China Electronic Shelf Label Market, By Product Type 2019-2032 (USD Billion)
54. China Electronic Shelf Label Market, By Component, 2019-2032 (USD Billion)
55. China Electronic Shelf Label Market, By Application, 2019-2032 (USD Billion)
56. India Electronic Shelf Label Market, By Product Type 2019-2032 (USD Billion)
57. India Electronic Shelf Label Market, By Component, 2019-2032 (USD Billion)
58. India Electronic Shelf Label Market, By Application, 2019-2032 (USD Billion)
59. South America Electronic Shelf Label Market, By Product Type, 2019-2032 (USD Billion)
60. South America Electronic Shelf Label Market, By Component, 2019-2032 (USD Billion)
61. South America Electronic Shelf Label Market, By Application, 2019-2032 (USD Billion)
62. Brazil Electronic Shelf Label Market, By Product Type 2019-2032 (USD Billion)
63. Brazil Electronic Shelf Label Market, By Component, 2019-2032 (USD Billion)
64. Brazil Electronic Shelf Label Market, By Application, 2019-2032 (USD Billion)
65. Middle East and Africa Electronic Shelf Label Market, By Product Type, 2019-2032 (USD Billion)
66. Middle East and Africa Electronic Shelf Label Market, By Component, 2019-2032 (USD Billion)
67. Middle East and Africa Electronic Shelf Label Market, By Application, 2019-2032 (USD Billion)
68. UAE Electronic Shelf Label Market, By Product Type, 2019-2032 (USD Billion)
69. UAE Electronic Shelf Label Market, By Component, 2019-2032 (USD Billion)
70. UAE Electronic Shelf Label Market, By Application, 2019-2032 (USD Billion)
71. South Africa Electronic Shelf Label Market, By Product Type 2019-2032 (USD Billion)
72. South Africa Electronic Shelf Label Market, By Component, 2019-2032 (USD Billion)
73. South Africa Electronic Shelf Label Market, By Application, 2019-2032 (USD Billion)
List of Figures
1. Global Electronic Shelf Label Market Segmentation
2. Electronic Shelf Label Market: Research Methodology
3. Market Size Estimation Methodology: Bottom-Up Approach
4. Market Size Estimation Methodology: Top-Down Approach
5. Data Triangulation
6. Porter’s Five Forces Analysis
7. Value Chain Analysis
8. Global Electronic Shelf Label Market Attractiveness Analysis by Product Type
9. Global Electronic Shelf Label Market Attractiveness Analysis by Component
10. Global Electronic Shelf Label Market Attractiveness Analysis by Application
11. Global Electronic Shelf Label Market Attractiveness Analysis by Region
12. Global Electronic Shelf Label Market: Dynamics
13. Global Electronic Shelf Label Market Share by Product Type (2022 & 2032)
14. Global Electronic Shelf Label Market Share by Component (2022 & 2032)
15. Global Electronic Shelf Label Market Share by Application (2022 & 2032)
16. Global Electronic Shelf Label Market Share by Regions (2022 & 2032)
17. Global Electronic Shelf Label Market Share by Company (2022)
This study forecasts revenue at global, regional, and country levels from 2019 to 2032. The Brainy Insights has segmented the global electronic shelf label market based on below mentioned segments:
Global Electronic Shelf Label Market Product Type:
Global Electronic Shelf Label Market Component:
Global Electronic Shelf Label Market Application:
Global Electronic Shelf Label Market by Region:
Research has its special purpose to undertake marketing efficiently. In this competitive scenario, businesses need information across all industry verticals; the information about customer wants, market demand, competition, industry trends, distribution channels etc. This information needs to be updated regularly because businesses operate in a dynamic environment. Our organization, The Brainy Insights incorporates scientific and systematic research procedures in order to get proper market insights and industry analysis for overall business success. The analysis consists of studying the market from a miniscule level wherein we implement statistical tools which helps us in examining the data with accuracy and precision.
Our research reports feature both; quantitative and qualitative aspects for any market. Qualitative information for any market research process are fundamental because they reveal the customer needs and wants, usage and consumption for any product/service related to a specific industry. This in turn aids the marketers/investors in knowing certain perceptions of the customers. Qualitative research can enlighten about the different product concepts and designs along with unique service offering that in turn, helps define marketing problems and generate opportunities. On the other hand, quantitative research engages with the data collection process through interviews, e-mail interactions, surveys and pilot studies. Quantitative aspects for the market research are useful to validate the hypotheses generated during qualitative research method, explore empirical patterns in the data with the help of statistical tools, and finally make the market estimations.
The Brainy Insights offers comprehensive research and analysis, based on a wide assortment of factual insights gained through interviews with CXOs and global experts and secondary data from reliable sources. Our analysts and industry specialist assume vital roles in building up statistical tools and analysis models, which are used to analyse the data and arrive at accurate insights with exceedingly informative research discoveries. The data provided by our organization have proven precious to a diverse range of companies, facilitating them to address issues such as determining which products/services are the most appealing, whether or not customers use the product in the manner anticipated, the purchasing intentions of the market and many others.
Our research methodology encompasses an idyllic combination of primary and secondary initiatives. Key phases involved in this process are listed below:

The phase involves the gathering and collecting of market data and its related information with the help of different sources & research procedures.

The data procurement stage involves in data gathering and collecting through various data sources.
This stage involves in extensive research. These data sources includes:
Purchased Database: Purchased databases play a crucial role in estimating the market sizes irrespective of the domain. Our purchased database includes:
Primary Research: The Brainy Insights interacts with leading companies and experts of the concerned domain to develop the analyst team’s market understanding and expertise. It improves and substantiates every single data presented in the market reports. Primary research mainly involves in telephonic interviews, E-mail interactions and face-to-face interviews with the raw material providers, manufacturers/producers, distributors, & independent consultants. The interviews that we conduct provides valuable data on market size and industry growth trends prevailing in the market. Our organization also conducts surveys with the various industry experts in order to gain overall insights of the industry/market. For instance, in healthcare industry we conduct surveys with the pharmacists, doctors, surgeons and nurses in order to gain insights and key information of a medical product/device/equipment which the customers are going to usage. Surveys are conducted in the form of questionnaire designed by our own analyst team. Surveys plays an important role in primary research because surveys helps us to identify the key target audiences of the market. Additionally, surveys helps to identify the key target audience engaged with the market. Our survey team conducts the survey by targeting the key audience, thus gaining insights from them. Based on the perspectives of the customers, this information is utilized to formulate market strategies. Moreover, market surveys helps us to understand the current competitive situation of the industry. To be precise, our survey process typically involve with the 360 analysis of the market. This analytical process begins by identifying the prospective customers for a product or service related to the market/industry to obtain data on how a product/service could fit into customers’ lives.

Secondary Research: The secondary data sources includes information published by the on-profit organizations such as World bank, WHO, company fillings, investor presentations, annual reports, national government documents, statistical databases, blogs, articles, white papers and others. From the annual report, we analyse a company’s revenue to understand the key segment and market share of that organization in a particular region. We analyse the company websites and adopt the product mapping technique which is important for deriving the segment revenue. In the product mapping method, we select and categorize the products offered by the companies catering to domain specific market, deduce the product revenue for each of the companies so as to get overall estimation of the market size. We also source data and analyses trends based on information received from supply side and demand side intermediaries in the value chain. The supply side denotes the data gathered from supplier, distributor, wholesaler and the demand side illustrates the data gathered from the end customers for respective market domain.

The supply side for a domain specific market is analysed by:
The demand side for the market is estimated through:
In-house Library: Apart from these third-party sources, we have our in-house library of qualitative and quantitative information. Our in-house database includes market data for various industry and domains. These data are updated on regular basis as per the changing market scenario. Our library includes, historic databases, internal audit reports and archives.
Sometimes there are instances where there is no metadata or raw data available for any domain specific market. For those cases, we use our expertise to forecast and estimate the market size in order to generate comprehensive data sets. Our analyst team adopt a robust research technique in order to produce the estimates:
Data Synthesis: This stage involves the analysis & mapping of all the information obtained from the previous step. It also involves in scrutinizing the data for any discrepancy observed while data gathering related to the market. The data is collected with consideration to the heterogeneity of sources. Robust scientific techniques are in place for synthesizing disparate data sets and provide the essential contextual information that can orient market strategies. The Brainy Insights has extensive experience in data synthesis where the data passes through various stages:


Market Deduction & Formulation: The final stage comprises of assigning data points at appropriate market spaces so as to deduce feasible conclusions. Analyst perspective & subject matter expert based holistic form of market sizing coupled with industry analysis also plays a crucial role in this stage.
This stage involves in finalization of the market size and numbers that we have collected from data integration step. With data interpolation, it is made sure that there is no gap in the market data. Successful trend analysis is done by our analysts using extrapolation techniques, which provide the best possible forecasts for the market.
Data Validation & Market Feedback: Validation is the most important step in the process. Validation & re-validation via an intricately designed process helps us finalize data-points to be used for final calculations.

The Brainy Insights interacts with leading companies and experts of the concerned domain to develop the analyst team’s market understanding and expertise. It improves and substantiates every single data presented in the market reports. The data validation interview and discussion panels are typically composed of the most experienced industry members. The participants include, however, are not limited to:
Moreover, we always validate our data and findings through primary respondents from all the major regions we are working on.


Free Customization
Fortune 500 Clients
Free Yearly Update On Purchase Of Multi/Corporate License
Companies Served Till Date