- +1-315-215-1633
- sales@thebrainyinsights.com

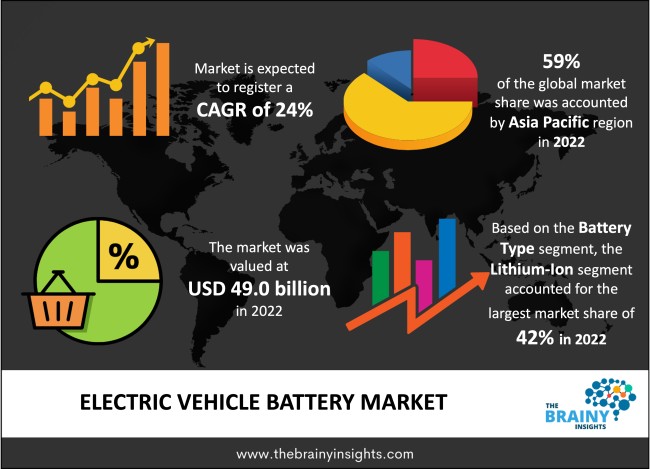
The global electric vehicle battery market was valued at USD 49.0 billion in 2022, growing at a CAGR of 24% from 2023 to 2032. The market is expected to reach USD 421.1 billion by 2032. The increasing emphasis on electric vehicles by prominent automakers such as Bayerische Motoren Werke AG, General Motors, and Ford Motors is likely to fuel market growth. The continuing rollout of Electric Vehicle Supply Equipment (EVSE) and the associated increase in electric vehicle sales bodes well for market growth. Policies that encourage establishing charging stations through direct investments and public-private partnerships, particularly in metropolitan areas, would also drive market expansion.
The battery is the most essential electric vehicle (EV) component. A battery is a device that uses an electrochemical reaction to transform chemical energy into electric energy. In an electrical circuit, an electrochemical reaction involves transferring electrons from one substance to another. The battery is frequently constructed so that all of an electric car's motor(s) and charging system requirements are met. A typical EV battery pack comprises blocks of 18-30 parallel cells connected in series to achieve the appropriate voltage for propulsion. Automobile manufacturers are currently focused on developing sophisticated electric vehicle technologies, such as smaller engines and batteries predicted to emit less pollution while costing less. The lithium-nickel-manganese-cobalt-oxide (NMC) battery is now the most often utilized material in electric car batteries. Furthermore, in the United States, lithium-nickel-cobalt-aluminium oxide (NCA) is utilized in electric vehicles (Tesla Model X, S, and 3). For example, BYD Motors Inc. released the revolutionary blade battery for electric vehicles in March 2020, which optimizes the battery pack construction by more than 50% compared to typical lithium iron phosphate batteries. It also boosts battery safety significantly.
Get an overview of this study by requesting a free sample
CATL will work with Ford on a USD 3.5 billion battery plant for electric vehicles in Michigan, USA, in February 2023. Ford will control the new CATL facility as part of the plan rather than managing it as a joint venture. CATL will also aid Ford in the development of batteries.
Clarios'Optima announced an all-new lithium-power sport battery line in November 2022, emphasizing batteries for motorcycles, personal watercraft, snowmobiles, utility task vehicles (UTV) and all-terrain vehicles (ATV).
Honda Motor Company stated in August 2022 that it would invest USD 4.4 billion in creating a lithium-ion battery plant for electric vehicles in the United States with Korean battery supplier LG Energy Solution Ltd.
CATL announced plans in August 2020 to produce new EV batteries without nickel and cobalt due to the high prices associated with cobalt.
Samsung SDI decided to commercialize its li-ion battery in November 2020 to replace liquid electrolytes and increase battery performance.
In December 2019, Samsung SDI purchased an additional 15% investment in Samsung SDI-ARN Power Battery Co. Ltd., becoming the company's largest shareholder with 65% of the shares.
Rising Need for Electric Vehicles- Electric vehicle demand is increasing due to the growing need to lessen dependency on imported oil and the rapidly depleting fossil resources. Oil production costs are rising, making imported oil more expensive. As a result, countries that rely primarily on oil imports must make significant investments, putting their economies under economic duress. Because EVs (Electric Vehicles) are powered by fuel cells, energy, and batteries, there is less dependency on foreign oil. This aspect is expected to boost the adoption of EVs in the coming years. The low emission levels of EVs are driving their acceptance, and this trend is expected to boost market revenue growth during the forecast period.
High Cost- The high cost of EV production has been a significant impediment to their broad acceptance. The anticipated decrease in battery costs and R&D spending will likely reduce the overall cost of purchasing electric hatchbacks, crossovers, or SUVs to levels comparable to ICL cars, increasing demand for EVs. Because raw materials such as cobalt, nickel, lithium, and magnesium are relatively expensive, the cathode's price significantly impacts battery prices. The cost of EV production is also substantially higher than that of ICE autos due to the costly manufacturing process.
Rising Uses of Battery Swapping- Battery swapping and battery-as-a-service (Baas) are two business models being developed to allow consumers to replace EV batteries once they have been depleted. Unlike a stationary charging station, where charging batteries takes time and expensive infrastructure, a battery-as-a-service (BaaS) model allows consumers to swap out batteries fast. BaaS is an asset-light, low-cost, and quick-to-market approach. The upfront costs of EVs may be significantly reduced due to the BaaS model; for example, expenses for two-wheelers may be reduced by up to 20%. This minimizes the time consumers must spend charging their batteries, enhancing customer satisfaction and removing one of the most significant barriers to EV adoption.
The regions analyzed for the market include North America, Europe, South America, Asia Pacific, the Middle East, and Africa. Asia Pacific emerged as the largest market for the global electric vehicle battery market, with a 59% market revenue share in 2022.
The presence of leading manufacturers in the region has helped mass production of electric vehicles and EV batteries. Countries such as China and India provide inexpensive labour and other production variables, and pro-industrial government policies attract significant investments from big MNCs. The presence of a large consumer base in the region, rising demand for electric passenger and commercial vehicles, rising investments in charging infrastructure development, and expanding government initiatives to promote electric vehicle adoption are the primary drivers of the Asia Pacific EV battery market.
Agratas Energy Storage Solutions Private Limited, a Tata Group subsidiary, signed an agreement with the Gujarat government in June 2023 to establish India's first gigafactory for lithium-ion batteries. The company will first invest USD 1,574.56 million in constructing a 20 gigatonne (GW) unit.
Amara Raja Batteries Limited (ARBL) announced plans in December 2022 to invest approximately USD 1,148.89 million over ten years in research and development and a greenfield manufacturing unit for lithium-ion battery production in Telangana's Mahabubnagar district.
IIT Madras researchers worked on a novel battery technology for electric vehicles in June 2022. Instead of the lithium-ion batteries now used in EVs, they invented mechanically rechargeable zinc-air batteries.
Asia Pacific Region Electric Vehicle Battery Market Share in 2022 - 59%
www.thebrainyinsights.com
Check the geographical analysis of this market by requesting a free sample
The battery type segment is divided into lead-acid batteries, lithium-ion batteries, and others. The lithium-ion battery segment dominated the market, with a market share of around 42% in 2022. A lithium-ion battery is a rechargeable battery used in electric vehicles with a higher energy density than nickel-cadmium and lead-acid rechargeable batteries. These lithium-ion battery capabilities will allow manufacturers to save space by lowering the battery pack size. It is one of the most lightweight metals. Even though lithium-ion batteries do not contain lithium metal, they contain ions. The lithium-ion battery is gaining prominence over other battery types owing to its favourable capacity-to-weight ratio. Other elements contributing to its popularity include improved performance (long life and little maintenance), shelf life, environmental friendliness, and fast charging.
The vehicle type segment is divided into passenger vehicles and commercial vehicles. The commercial vehicles segment dominated the market, with a market share of around 58% in 2022. Government measures to promote the use of electric passenger and commercial cars as part of efforts to reduce air pollution caused by vehicular emissions are likely to boost the growth of the electric vehicle battery market during the forecast period.
| Attribute | Description |
|---|---|
| Market Size | Revenue (USD Billion) |
| Market size value in 2022 | USD 49.0 Billion |
| Market size value in 2032 | USD 421.1 Billion |
| CAGR (2023 to 2032) | 24% |
| Historical data | 2019-2021 |
| Base Year | 2022 |
| Forecast | 2023-2032 |
| Region | The regions analyzed for the market are Asia Pacific, Europe, South America, North America, and Middle East & Africa. Furthermore, the regions are further analyzed at the country level. |
| Segments | Battery Type, Vehicle Type |
As per The Brainy Insights, the size of the electric vehicle battery market was valued at USD 49.0 billion in 2022 to USD 421.1 billion by 2032.
The global electric vehicle battery market is growing at a CAGR of 24% during the forecast period 2023-2032.
Asia Pacific emerged as the largest electric vehicle battery market.
1. Introduction
1.1. Objectives of the Study
1.2. Market Definition
1.3. Research Scope
1.4. Currency
1.5. Key Target Audience
2. Research Methodology and Assumptions
3. Executive Summary
4. Premium Insights
4.1. Porter’s Five Forces Analysis
4.2. Value Chain Analysis
4.3. Top Investment Pockets
4.3.1. Market Attractiveness Analysis by Battery Type
4.3.2. Market Attractiveness Analysis by Vehicle Type
4.3.3. Market Attractiveness Analysis by Region
4.4. Industry Trends
5. Market Dynamics
5.1. Market Evaluation
5.2. Drivers
5.2.1. Rising need for electric vehicles
5.3. Restraints
5.3.1. High cost
5.4. Opportunities
5.4.1. Rising uses of battery swapping
5.5. Challenges
5.5.1. Regulatory issues
6. Global Electric Vehicle Battery Market Analysis and Forecast, By Battery Type
6.1. Segment Overview
6.2. Lead-acid Battery
6.3. Lithium-ion Battery
6.4. Others
7. Global Electric Vehicle Battery Market Analysis and Forecast, By Vehicle Type
7.1. Segment Overview
7.2. Passenger Vehicles
7.3. Commercial Vehicles
8. Global Electric Vehicle Battery Market Analysis and Forecast, By Regional Analysis
8.1. Segment Overview
8.2. North America
8.2.1. U.S.
8.2.2. Canada
8.2.3. Mexico
8.3. Europe
8.3.1. Germany
8.3.2. France
8.3.3. U.K.
8.3.4. Italy
8.3.5. Spain
8.4. Asia-Pacific
8.4.1. Japan
8.4.2. China
8.4.3. India
8.5. South America
8.5.1. Brazil
8.6. Middle East and Africa
8.6.1. UAE
8.6.2. South Africa
9. Global Electric Vehicle Battery Market-Competitive Landscape
9.1. Overview
9.2. Market Share of Key Players in Global Electric Vehicle Battery Market
9.2.1. Global Company Market Share
9.2.2. North America Company Market Share
9.2.3. Europe Company Market Share
9.2.4. APAC Company Market Share
9.3. Competitive Situations and Trends
9.3.1. Product Launches and Developments
9.3.2. Partnerships, Collaborations, and Agreements
9.3.3. Mergers & Acquisitions
9.3.4. Expansions
10. Company Profiles
10.1. ATLASBX Co.
10.1.1. Business Overview
10.1.2. Company Snapshot
10.1.3. Company Market Share Analysis
10.1.4. Company Product Portfolio
10.1.5. Recent Developments
10.1.6. SWOT Analysis
10.2. Sony
10.2.1. Business Overview
10.2.2. Company Snapshot
10.2.3. Company Market Share Analysis
10.2.4. Company Product Portfolio
10.2.5. Recent Developments
10.2.6. SWOT Analysis
10.3. Hitachi
10.3.1. Business Overview
10.3.2. Company Snapshot
10.3.3. Company Market Share Analysis
10.3.4. Company Product Portfolio
10.3.5. Recent Developments
10.3.6. SWOT Analysis
10.4. NEC Corporation
10.4.1. Business Overview
10.4.2. Company Snapshot
10.4.3. Company Market Share Analysis
10.4.4. Company Product Portfolio
10.4.5. Recent Developments
10.4.6. SWOT Analysis
10.5. Panasonic Corporation
10.5.1. Business Overview
10.5.2. Company Snapshot
10.5.3. Company Market Share Analysis
10.5.4. Company Product Portfolio
10.5.5. Recent Developments
10.5.6. SWOT Analysis
10.6. TCL Corporation
10.6.1. Business Overview
10.6.2. Company Snapshot
10.6.3. Company Market Share Analysis
10.6.4. Company Product Portfolio
10.6.5. Recent Developments
10.6.6. SWOT Analysis
10.7. Huanyu New Energy Technology
10.7.1. Business Overview
10.7.2. Company Snapshot
10.7.3. Company Market Share Analysis
10.7.4. Company Product Portfolio
10.7.5. Recent Developments
10.7.6. SWOT Analysis
10.8. Duracell
10.8.1. Business Overview
10.8.2. Company Snapshot
10.8.3. Company Market Share Analysis
10.8.4. Company Product Portfolio
10.8.5. Recent Developments
10.8.6. SWOT Analysis
10.9. NorthStar
10.9.1. Business Overview
10.9.2. Company Snapshot
10.9.3. Company Market Share Analysis
10.9.4. Company Product Portfolio
10.9.5. Recent Developments
10.9.6. SWOT Analysis
10.10. Crown Battery Manufacturing
10.10.1. Business Overview
10.10.2. Company Snapshot
10.10.3. Company Market Share Analysis
10.10.4. Company Product Portfolio
10.10.5. Recent Developments
10.10.6. SWOT Analysis
10.11. GS Yuasa Corp
10.11.1. Business Overview
10.11.2. Company Snapshot
10.11.3. Company Market Share Analysis
10.11.4. Company Product Portfolio
10.11.5. Recent Developments
10.11.6. SWOT Analysis
10.12. East Penn Manufacturing Co.
10.12.1. Business Overview
10.12.2. Company Snapshot
10.12.3. Company Market Share Analysis
10.12.4. Company Product Portfolio
10.12.5. Recent Developments
10.12.6. SWOT Analysis
10.13. C&D Technologies, Inc.
10.13.1. Business Overview
10.13.2. Company Snapshot
10.13.3. Company Market Share Analysis
10.13.4. Company Product Portfolio
10.13.5. Recent Developments
10.13.6. SWOT Analysis
10.14. B.B. Battery Co., Ltd.
10.14.1. Business Overview
10.14.2. Company Snapshot
10.14.3. Company Market Share Analysis
10.14.4. Company Product Portfolio
10.14.5. Recent Developments
10.14.6. SWOT Analysis
10.15. Narada Power Source Co., Ltd.
10.15.1. Business Overview
10.15.2. Company Snapshot
10.15.3. Company Market Share Analysis
10.15.4. Company Product Portfolio
10.15.5. Recent Developments
10.15.6. SWOT Analysis
10.16. CSB Battery Company Ltd.
10.16.1. Business Overview
10.16.2. Company Snapshot
10.16.3. Company Market Share Analysis
10.16.4. Company Product Portfolio
10.16.5. Recent Developments
10.16.6. SWOT Analysis
10.17. EnerSys, Inc.
10.17.1. Business Overview
10.17.2. Company Snapshot
10.17.3. Company Market Share Analysis
10.17.4. Company Product Portfolio
10.17.5. Recent Developments
10.17.6. SWOT Analysis
10.18. Coslight Technology International Group Co., Ltd.
10.18.1. Business Overview
10.18.2. Company Snapshot
10.18.3. Company Market Share Analysis
10.18.4. Company Product Portfolio
10.18.5. Recent Developments
10.18.6. SWOT Analysis
10.19. Zibo Torch Energy Co., Ltd.
10.19.1. Business Overview
10.19.2. Company Snapshot
10.19.3. Company Market Share Analysis
10.19.4. Company Product Portfolio
10.19.5. Recent Developments
10.19.6. SWOT Analysis
List of Table
1. Global Electric Vehicle Battery Market, By Battery Type, 2019-2032 (USD Billion)
2. Global Lead-acid Battery, Electric Vehicle Battery Market, By Region, 2019-2032 (USD Billion)
3. Global Lithium-ion Battery, Electric Vehicle Battery Market, By Region, 2019-2032 (USD Billion)
4. Global Others, Electric Vehicle Battery Market, By Region, 2019-2032 (USD Billion)
5. Global Electric Vehicle Battery Market, By Vehicle Type, 2019-2032 (USD Billion)
6. Global Passenger Vehicles, Electric Vehicle Battery Market, By Region, 2019-2032 (USD Billion)
7. Global Commercial Vehicles, Electric Vehicle Battery Market, By Region, 2019-2032 (USD Billion)
8. North America Electric Vehicle Battery Market, By Battery Type, 2019-2032 (USD Billion)
9. North America Electric Vehicle Battery Market, By Vehicle Type, 2019-2032 (USD Billion)
10. U.S. Electric Vehicle Battery Market, By Battery Type, 2019-2032 (USD Billion)
11. U.S. Electric Vehicle Battery Market, By Vehicle Type, 2019-2032 (USD Billion)
12. Canada Electric Vehicle Battery Market, By Battery Type, 2019-2032 (USD Billion)
13. Canada Electric Vehicle Battery Market, By Vehicle Type, 2019-2032 (USD Billion)
14. Mexico Electric Vehicle Battery Market, By Battery Type, 2019-2032 (USD Billion)
15. Mexico Electric Vehicle Battery Market, By Vehicle Type, 2019-2032 (USD Billion)
16. Europe Electric Vehicle Battery Market, By Battery Type, 2019-2032 (USD Billion)
17. Europe Electric Vehicle Battery Market, By Vehicle Type, 2019-2032 (USD Billion)
18. Germany Electric Vehicle Battery Market, By Battery Type, 2019-2032 (USD Billion)
19. Germany Electric Vehicle Battery Market, By Vehicle Type, 2019-2032 (USD Billion)
20. France Electric Vehicle Battery Market, By Battery Type, 2019-2032 (USD Billion)
21. France Electric Vehicle Battery Market, By Vehicle Type, 2019-2032 (USD Billion)
22. U.K. Electric Vehicle Battery Market, By Battery Type, 2019-2032 (USD Billion)
23. U.K. Electric Vehicle Battery Market, By Vehicle Type, 2019-2032 (USD Billion)
24. Italy Electric Vehicle Battery Market, By Battery Type, 2019-2032 (USD Billion)
25. Italy Electric Vehicle Battery Market, By Vehicle Type, 2019-2032 (USD Billion)
26. Spain Electric Vehicle Battery Market, By Battery Type, 2019-2032 (USD Billion)
27. Spain Electric Vehicle Battery Market, By Vehicle Type, 2019-2032 (USD Billion)
28. Asia Pacific Electric Vehicle Battery Market, By Battery Type, 2019-2032 (USD Billion)
29. Asia Pacific Electric Vehicle Battery Market, By Vehicle Type, 2019-2032 (USD Billion)
30. Japan Electric Vehicle Battery Market, By Battery Type, 2019-2032 (USD Billion)
31. Japan Electric Vehicle Battery Market, By Vehicle Type, 2019-2032 (USD Billion)
32. China Electric Vehicle Battery Market, By Battery Type, 2019-2032 (USD Billion)
33. China Electric Vehicle Battery Market, By Vehicle Type, 2019-2032 (USD Billion)
34. India Electric Vehicle Battery Market, By Battery Type, 2019-2032 (USD Billion)
35. India Electric Vehicle Battery Market, By Vehicle Type, 2019-2032 (USD Billion)
36. South America Electric Vehicle Battery Market, By Battery Type, 2019-2032 (USD Billion)
37. South America Electric Vehicle Battery Market, By Vehicle Type, 2019-2032 (USD Billion)
38. Brazil Electric Vehicle Battery Market, By Battery Type, 2019-2032 (USD Billion)
39. Brazil Electric Vehicle Battery Market, By Vehicle Type, 2019-2032 (USD Billion)
40. Middle East and Africa Electric Vehicle Battery Market, By Battery Type, 2019-2032 (USD Billion)
41. Middle East and Africa Electric Vehicle Battery Market, By Vehicle Type, 2019-2032 (USD Billion)
42. UAE Electric Vehicle Battery Market, By Battery Type, 2019-2032 (USD Billion)
43. UAE Electric Vehicle Battery Market, By Vehicle Type, 2019-2032 (USD Billion)
44. South Africa Electric Vehicle Battery Market, By Battery Type, 2019-2032 (USD Billion)
45. South Africa Electric Vehicle Battery Market, By Vehicle Type, 2019-2032 (USD Billion)
List of Figures
1. Global Electric Vehicle Battery Market Segmentation
2. Global Electric Vehicle Battery Market: Research Methodology
3. Market Size Estimation Methodology: Bottom-Up Approach
4. Market Size Estimation Methodology: Top-Down Approach
5. Data Triangulation
6. Porter’s Five Forces Analysis
7. Value Chain Analysis
8. Global Electric Vehicle Battery Market Attractiveness Analysis by Battery Type
9. Global Electric Vehicle Battery Market Attractiveness Analysis by Vehicle Type
10. Global Electric Vehicle Battery Market Attractiveness Analysis by Region
11. Global Electric Vehicle Battery Market: Dynamics
12. Global Electric Vehicle Battery Market Share by Battery Type (2023 & 2032)
13. Global Electric Vehicle Battery Market Share by Vehicle Type (2023 & 2032)
14. Global Electric Vehicle Battery Market Share by Regions (2023 & 2032)
15. Global Electric Vehicle Battery Market Share by Company (2022)
This study forecasts global, regional, and country revenue from 2019 to 2032. The Brainy Insights has segmented the global electric vehicle battery market based on the below-mentioned segments:
Global Electric Vehicle Battery Market By Battery Type:
Global Electric Vehicle Battery Market By Vehicle Type:
Global Electric Vehicle Battery Market By Region:
Research has its special purpose to undertake marketing efficiently. In this competitive scenario, businesses need information across all industry verticals; the information about customer wants, market demand, competition, industry trends, distribution channels etc. This information needs to be updated regularly because businesses operate in a dynamic environment. Our organization, The Brainy Insights incorporates scientific and systematic research procedures in order to get proper market insights and industry analysis for overall business success. The analysis consists of studying the market from a miniscule level wherein we implement statistical tools which helps us in examining the data with accuracy and precision.
Our research reports feature both; quantitative and qualitative aspects for any market. Qualitative information for any market research process are fundamental because they reveal the customer needs and wants, usage and consumption for any product/service related to a specific industry. This in turn aids the marketers/investors in knowing certain perceptions of the customers. Qualitative research can enlighten about the different product concepts and designs along with unique service offering that in turn, helps define marketing problems and generate opportunities. On the other hand, quantitative research engages with the data collection process through interviews, e-mail interactions, surveys and pilot studies. Quantitative aspects for the market research are useful to validate the hypotheses generated during qualitative research method, explore empirical patterns in the data with the help of statistical tools, and finally make the market estimations.
The Brainy Insights offers comprehensive research and analysis, based on a wide assortment of factual insights gained through interviews with CXOs and global experts and secondary data from reliable sources. Our analysts and industry specialist assume vital roles in building up statistical tools and analysis models, which are used to analyse the data and arrive at accurate insights with exceedingly informative research discoveries. The data provided by our organization have proven precious to a diverse range of companies, facilitating them to address issues such as determining which products/services are the most appealing, whether or not customers use the product in the manner anticipated, the purchasing intentions of the market and many others.
Our research methodology encompasses an idyllic combination of primary and secondary initiatives. Key phases involved in this process are listed below:

The phase involves the gathering and collecting of market data and its related information with the help of different sources & research procedures.

The data procurement stage involves in data gathering and collecting through various data sources.
This stage involves in extensive research. These data sources includes:
Purchased Database: Purchased databases play a crucial role in estimating the market sizes irrespective of the domain. Our purchased database includes:
Primary Research: The Brainy Insights interacts with leading companies and experts of the concerned domain to develop the analyst team’s market understanding and expertise. It improves and substantiates every single data presented in the market reports. Primary research mainly involves in telephonic interviews, E-mail interactions and face-to-face interviews with the raw material providers, manufacturers/producers, distributors, & independent consultants. The interviews that we conduct provides valuable data on market size and industry growth trends prevailing in the market. Our organization also conducts surveys with the various industry experts in order to gain overall insights of the industry/market. For instance, in healthcare industry we conduct surveys with the pharmacists, doctors, surgeons and nurses in order to gain insights and key information of a medical product/device/equipment which the customers are going to usage. Surveys are conducted in the form of questionnaire designed by our own analyst team. Surveys plays an important role in primary research because surveys helps us to identify the key target audiences of the market. Additionally, surveys helps to identify the key target audience engaged with the market. Our survey team conducts the survey by targeting the key audience, thus gaining insights from them. Based on the perspectives of the customers, this information is utilized to formulate market strategies. Moreover, market surveys helps us to understand the current competitive situation of the industry. To be precise, our survey process typically involve with the 360 analysis of the market. This analytical process begins by identifying the prospective customers for a product or service related to the market/industry to obtain data on how a product/service could fit into customers’ lives.

Secondary Research: The secondary data sources includes information published by the on-profit organizations such as World bank, WHO, company fillings, investor presentations, annual reports, national government documents, statistical databases, blogs, articles, white papers and others. From the annual report, we analyse a company’s revenue to understand the key segment and market share of that organization in a particular region. We analyse the company websites and adopt the product mapping technique which is important for deriving the segment revenue. In the product mapping method, we select and categorize the products offered by the companies catering to domain specific market, deduce the product revenue for each of the companies so as to get overall estimation of the market size. We also source data and analyses trends based on information received from supply side and demand side intermediaries in the value chain. The supply side denotes the data gathered from supplier, distributor, wholesaler and the demand side illustrates the data gathered from the end customers for respective market domain.

The supply side for a domain specific market is analysed by:
The demand side for the market is estimated through:
In-house Library: Apart from these third-party sources, we have our in-house library of qualitative and quantitative information. Our in-house database includes market data for various industry and domains. These data are updated on regular basis as per the changing market scenario. Our library includes, historic databases, internal audit reports and archives.
Sometimes there are instances where there is no metadata or raw data available for any domain specific market. For those cases, we use our expertise to forecast and estimate the market size in order to generate comprehensive data sets. Our analyst team adopt a robust research technique in order to produce the estimates:
Data Synthesis: This stage involves the analysis & mapping of all the information obtained from the previous step. It also involves in scrutinizing the data for any discrepancy observed while data gathering related to the market. The data is collected with consideration to the heterogeneity of sources. Robust scientific techniques are in place for synthesizing disparate data sets and provide the essential contextual information that can orient market strategies. The Brainy Insights has extensive experience in data synthesis where the data passes through various stages:


Market Deduction & Formulation: The final stage comprises of assigning data points at appropriate market spaces so as to deduce feasible conclusions. Analyst perspective & subject matter expert based holistic form of market sizing coupled with industry analysis also plays a crucial role in this stage.
This stage involves in finalization of the market size and numbers that we have collected from data integration step. With data interpolation, it is made sure that there is no gap in the market data. Successful trend analysis is done by our analysts using extrapolation techniques, which provide the best possible forecasts for the market.
Data Validation & Market Feedback: Validation is the most important step in the process. Validation & re-validation via an intricately designed process helps us finalize data-points to be used for final calculations.

The Brainy Insights interacts with leading companies and experts of the concerned domain to develop the analyst team’s market understanding and expertise. It improves and substantiates every single data presented in the market reports. The data validation interview and discussion panels are typically composed of the most experienced industry members. The participants include, however, are not limited to:
Moreover, we always validate our data and findings through primary respondents from all the major regions we are working on.


Free Customization
Fortune 500 Clients
Free Yearly Update On Purchase Of Multi/Corporate License
Companies Served Till Date