- +1-315-215-1633
- sales@thebrainyinsights.com

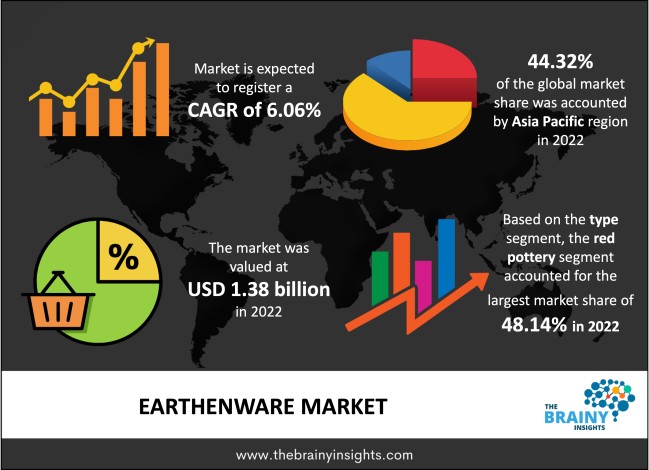
The global earthenware market was valued at USD 1.38 Billion in 2022, increasing at a CAGR of 6.06% from 2023 to 2031 and is anticipated to reach USD 2.34 Billion by 2031. Asia-Pacific is expected to grow the fastest during the forecast period. The Earthenware industry was negatively affected by the COVID-19 epidemic, as the pandemic has deeply impacted the pottery sector. There was a drop in tableware and decorative ware sales due to lockdown restrictions and the trade restrictions on the crucial supply chain for raw materials. Also, the consumer spending pattern changed, and they started focusing on essential commodities.
Earthenware is pottery fired at a low temperature, generally between 1,000 to 1,150 degrees, resulting in a hardened material that is brittle. This material is slightly porous. Hence the glaze is used for covering the object before it is fired in the kiln for the second time and made waterproof. It is broadly used for tableware and decorative ware like figurines. The earthenware body components vary significantly. Generally, the body formulation for contemporary earthenware includes 25% ball clay, 25% kaolin, 35% quartz and 15% feldspar. It has been observed that there is rapid urbanization happening, especially in emerging economies like China and India. Also, there is a surge in disposable income in developed and developing nations, fueling the growth of the earthenware market due to demand for residential and office spaces. It has been observed that handcrafted mugs are in need. Vases also sell well for decorations and to use them for flower holders. Manufacturers in the ceramic sector believe there is a promising future, especially in emerging economies like India and China, as there is increasing per capita consumption in these countries. The export market in these countries is propelling the market's future growth, and the players are expecting the government to help provide easy entry into the global market. The demand for tableware is growing due to the surge in consumers' preference for at-home entertainment. Consumers have become more sophisticated in dining practices as more focus is given to styling and food presentation as the finishing touch to culinary skills. Moreover, there is a surge in demand for vintage decoration and dinnerware as this has become more fashionable. Thus the main factors contributing to the growth of the market are a rise in living standards, growth in the consumer interest in fine dining and an increase in social dinner events, among others.
Get an overview of this study by requesting a free sample
For example, in January 2017, The Good(s) Factory, a part of Elho Group, acquired and integrated Ebertsankey to become one of the leading players in the pottery segment in the European market. The latter company was based in Germany and was into indoor and outdoor plant containers.
For example, in April 2014, Naylor, an owner of the Yorkshire Flowerpot company, acquired Limetree Ceramics, an importer of quality decorative glazed pots from Spain and Portugal. This acquisition helped the organization become the leading player in high-quality garden ware products. This acquisition allowed the organization to gain market share in the earthenware market.
Growing demand for tableware products: It has been observed that there is an increase in the hosting of social dining events. Many elegant sets are available in the market for decoration and dining. These table decorations and accessories are also in demand to add the finishing touch for celebrating a special occasion or festival. Also, there is a surge in the disposable income of the people and improved living standards, especially in the emerging economies of APAC, which is propelling the market's growth. There is a growing influence of Western cuisine. Based on one of the studies of 2014, it was found that young married couples are the leading consumers of ceramic tableware products. In Asian countries, imported tableware and foreign-branded were majorly preferred in 2013. All these factors are eventually driving the global earthenware market.
Growing demand for Flower Pots: It has been observed that there is a growing demand for a vertical gardens. There is also a surge in the expenditure for home decoration products and demand for houseplants in households. All these factors are fueling the demand for flowerpots. Consumers have a considerable inclination for interior home decorations at residences. In Western Europe, it was found that most of the consumers of garden pots have their own outdoor space, and many of them are active gardeners. In small urban housing, there is a trend for indoor gardens by placing plants around the house. All these factors are eventually driving the earthenware market.
Lack of adequate working capital: It has been observed that the pottery handcrafters are facing several problems in procuring the raw materials, like the high price, transport problems, financial problems and shortage of good quality products, among others. As there is a shortage of adequate working capital, many potters need to be able to buy sufficient raw materials. Also, the low investment is leading to low production. It has been observed that a large number of units are operating below their capacity as there is a shortage of working capital, and it also is resulting that many previous workers are leaving this profession. All these factors are acting as a restraint for the market.
The surge in the middle-class population in the emerging economies: A growing middle-class population in the emerging economies of Asia Pacific, like China and India, leads to the demand for home decorations. This trend seems promising for the future. Moreover, there is global development happening, and there is an expansion of the real estate sector, which is further supplementing the growth of the home décor market. Also, consumers prefer using and adopting eco-friendly products as they have become aware of the environment. Moreover, there is an increase in the trend for unique and vintage decorations in the house which would further propel the earthenware market. High-design decorative items would also boost market growth and development. All these factors would eventually drive the earthenware market in the forecasting period.
Availability of Substitutes: There are several alternatives available, like glassware, advanced ceramics and others. Moreover, there is a good demand for synthetic pots and disposable tableware. Disposable tableware is also in need due to outdoor parties and a surge in food ordering from restaurants. Several alternatives for this market are readily available and at an economical price. These factors are acting as critical challenges for the market.
The regions analyzed for the market include Europe, South America, Asia Pacific, North America, and Middle East & Africa. Asia Pacific emerged as the largest market for the global earthenware market, with a 44.32% share of the market revenue in 2022. The regional market growth is attributed to its use in the countries like China, Japan, South Korea and India, among others. For instance, Ceramics has a significant cultural impact in China. Many pots are made here for ceremonial use, like burial urns, tea ceremony vessels and altar pots. It is also considered less expensive than other types of dinnerware. China is quite famous for its beautiful and high-quality pottery. The situation is attributed to the vast amount of clay and stone available in China. North America has emerged as the second-largest region within the global Earthenware market. The regional market development is due to the migrating population from rural areas to the metro cities for job opportunities which provides opportunities for the real estate sector. It leads to several home décor products. These products include many ceramic tableware products and accessories, among others. There is a surge in the urbanized population in the region, and people living in the metro cities are generally considered to have a high standard of living. The consumer's spending power for products like home decor has also increased. All these factors are driving the earthenware market in North America.
Asia Pacific Region Earthenware Market Share in 2022 - 44.32%
www.thebrainyinsights.com
Check the geographical analysis of this market by requesting a free sample
The type segment is divided into black pottery, red pottery and others. The red pottery segment dominated, with a market share of around 48.14% in 2022. The segment growth is attributed to the fact that terracotta clay is broadly used as it is easy to sculpt into several products like kitchen utensils, vases, planters and sculptures. In India is used to make several religious artefacts, toys and household items.
The application segment is divided into flower pot, teapot, decorations and others. In 2022, the teapot segment dominated the market with the largest market share of 41.26% and market revenue of 569.50 Million. Earthenware is broadly used for tableware and other vessels. The more traditional drinkers vastly prefer ceramic teapots. The western-style ceramic teapot can be ideal for Ceylon, Assam and Kenyan black tea, whereas Eastern-style teapots are generally preferred for brewing green tea with more giant leaves. These ceramic teapots can be versatile and could complement any kitchen décor style.
| Attribute | Description |
|---|---|
| Market Size | Revenue (USD Billion) |
| Market size value in 2022 | USD 1.38 Billion |
| Market size value in 2032 | USD 2.34 Billion |
| CAGR (2023 to 2032) | 6.06% |
| Historical data | 2019-2021 |
| Base Year | 2022 |
| Forecast | 2023-2032 |
| Regional Segments | The key regions are South America, North America, Europe, Asia Pacific, and Middle East & Africa. |
| Segments | Key Segments are type, application and regions |
As per The Brainy Insights, the size of the earthenware market was valued at USD 1.38 billion in 2022 to USD 2.34 billion by 2031.
The global earthenware market is growing at a CAGR of 6.06% during the forecast period 2023-2031.
The Asia Pacific region emerged as the largest market for the earthenware.
The growing demand for tableware products will influence the market's growth.
1. Introduction
1.1. Objectives of the Study
1.2. Market Definition
1.3. Research Scope
1.4. Currency
1.5. Key Target Audience
2. Research Methodology and Assumptions
3. Executive Summary
4. Premium Insights
4.1. Porter’s Five Forces Analysis
4.2. Value Chain Analysis
4.3. Top Investment Pockets
4.3.1. Market Attractiveness Analysis by Type
4.3.2. Market Attractiveness Analysis by Application
4.3.3. Market Attractiveness Analysis by Region
4.4. Industry Trends
5. Market Dynamics
5.1. Market Evaluation
5.2. Drivers
5.2.1. Growing demand for tableware products
5.2.2. Growing demand for Flower Pots
5.3. Restraints
5.3.1. Lack of adequate working capital
5.4. Opportunities
5.4.1. The surge in the middle-class population in the emerging economies
5.5. Challenges
5.5.1. Several Alternatives
6. Global Earthenware Market Analysis and Forecast, By Type
6.1. Segment Overview
6.2. Black Pottery
6.3. Red Pottery
6.4. Others
7. Global Earthenware Market Analysis and Forecast, By Application
7.1. Segment Overview
7.2. Flower pot
7.3. Teapot
7.4. Decorations
7.5. Others
8. Global Earthenware Market Analysis and Forecast, By Regional Analysis
8.1. Segment Overview
8.2. North America
8.2.1. U.S.
8.2.2. Canada
8.2.3. Mexico
8.3. Europe
8.3.1. Germany
8.3.2. France
8.3.3. U.K.
8.3.4. Italy
8.3.5. Spain
8.4. Asia-Pacific
8.4.1. Japan
8.4.2. China
8.4.3. India
8.5. South America
8.5.1. Brazil
8.6. Middle East and Africa
8.6.1. UAE
8.6.2. South Africa
9. Global Earthenware Market-Competitive Landscape
9.1. Overview
9.2. Market Share of Key Players in the Earthenware Market
9.2.1. Global Company Market Share
9.2.2. North America Company Market Share
9.2.3. Europe Company Market Share
9.2.4. APAC Company Market Share
9.3. Competitive Situations and Trends
9.3.1. Product Launches and Developments
9.3.2. Partnerships, Collaborations, and Agreements
9.3.3. Mergers & Acquisitions
9.3.4. Expansions
10. Company Profiles
10.1. Qihe Longshan black pottery Technology Co., Ltd.
10.1.1. Business Overview
10.1.2. Company Snapshot
10.1.3. Company Market Share Analysis
10.1.4. Company Product Portfolio
10.1.5. Recent Developments
10.1.6. SWOT Analysis
10.2. Shanxi xianglong black pottery handicraft co., Ltd
10.2.1. Business Overview
10.2.2. Company Snapshot
10.2.3. Company Market Share Analysis
10.2.4. Company Product Portfolio
10.2.5. Recent Developments
10.2.6. SWOT Analysis
10.3. Yorkshire
10.3.1. Business Overview
10.3.2. Company Snapshot
10.3.3. Company Market Share Analysis
10.3.4. Company Product Portfolio
10.3.5. Recent Developments
10.3.6. SWOT Analysis
10.4. Jinan Longshan Longyuan Black Pottery Art Co., Ltd
10.4.1. Business Overview
10.4.2. Company Snapshot
10.4.3. Company Market Share Analysis
10.4.4. Company Product Portfolio
10.4.5. Recent Developments
10.4.6. SWOT Analysis
10.5. Hongshan Flowerpot
10.5.1. Business Overview
10.5.2. Company Snapshot
10.5.3. Company Market Share Analysis
10.5.4. Company Product Portfolio
10.5.5. Recent Developments
10.5.6. SWOT Analysis
10.6. Titisinaran
10.6.1. Business Overview
10.6.2. Company Snapshot
10.6.3. Company Market Share Analysis
10.6.4. Company Product Portfolio
10.6.5. Recent Developments
10.6.6. SWOT Analysis
10.7. QuanZheng Red Ceramics Technology Co.Ltd.
10.7.1. Business Overview
10.7.2. Company Snapshot
10.7.3. Company Market Share Analysis
10.7.4. Company Product Portfolio
10.7.5. Recent Developments
10.7.6. SWOT Analysis
10.8. Yixing Wankun
10.8.1. Business Overview
10.8.2. Company Snapshot
10.8.3. Company Market Share Analysis
10.8.4. Company Product Portfolio
10.8.5. Recent Developments
10.8.6. SWOT Analysis
10.9. Jiangsu Sheng Yixing Red Pottery Arts Factory
10.9.1. Business Overview
10.9.2. Company Snapshot
10.9.3. Company Market Share Analysis
10.9.4. Company Product Portfolio
10.9.5. Recent Developments
10.9.6. SWOT Analysis
10.10. liangzi black pottery
10.10.1. Business Overview
10.10.2. Company Snapshot
10.10.3. Company Market Share Analysis
10.10.4. Company Product Portfolio
10.10.5. Recent Developments
10.10.6. SWOT Analysis
10.11. POTTERY MFG
10.11.1. Business Overview
10.11.2. Company Snapshot
10.11.3. Company Market Share Analysis
10.11.4. Company Product Portfolio
10.11.5. Recent Developments
10.11.6. SWOT Analysis
10.12. Linyi Lijun
10.12.1. Business Overview
10.12.2. Company Snapshot
10.12.3. Company Market Share Analysis
10.12.4. Company Product Portfolio
10.12.5. Recent Developments
10.12.6. SWOT Analysis
10.13. ELHO
10.13.1. Business Overview
10.13.2. Company Snapshot
10.13.3. Company Market Share Analysis
10.13.4. Company Product Portfolio
10.13.5. Recent Developments
10.13.6. SWOT Analysis
10.14. Poterie Lorraine
10.14.1. Business Overview
10.14.2. Company Snapshot
10.14.3. Company Market Share Analysis
10.14.4. Company Product Portfolio
10.14.5. Recent Developments
10.14.6. SWOT Analysis
List of Table
1. Global Earthenware Market, By Type, 2019-2031 (USD Billion)
2. Global Black Pottery Earthenware Market, By Region, 2019-2031 (USD Billion)
3. Global Red Pottery Earthenware Market, By Region, 2019-2031 (USD Billion)
4. Global Others Earthenware Market, By Region, 2019-2031 (USD Billion)
5. Global Earthenware Market, By Application, 2019-2031 (USD Billion)
6. Global Flower pot Earthenware Market, By Region, 2019-2031 (USD Billion)
7. Global Teapot Earthenware Market, By Region, 2019-2031 (USD Billion)
8. Global Decorations Earthenware Market, By Region, 2019-2031 (USD Billion)
9. Global Others Earthenware Market, By Region, 2019-2031 (USD Billion)
10. Global Earthenware Market, By Region, 2019-2031 (USD Billion)
11. North America Earthenware Market, By Type, 2019-2031 (USD Billion)
12. North America Earthenware Market, By Application, 2019-2031 (USD Billion)
13. U.S. Earthenware Market, By Type, 2019-2031 (USD Billion)
14. U.S. Earthenware Market, By Application, 2019-2031 (USD Billion)
15. Canada Earthenware Market, By Type, 2019-2031 (USD Billion)
16. Canada Earthenware Market, By Application, 2019-2031 (USD Billion)
17. Mexico Earthenware Market, By Type, 2019-2031 (USD Billion)
18. Mexico Earthenware Market, By Application, 2019-2031 (USD Billion)
19. Europe Earthenware Market, By Type, 2019-2031 (USD Billion)
20. Europe Earthenware Market, By Application, 2019-2031 (USD Billion)
21. Germany Earthenware Market, By Type, 2019-2031 (USD Billion)
22. Germany Earthenware Market, By Application, 2019-2031 (USD Billion)
23. France Earthenware Market, By Type, 2019-2031 (USD Billion)
24. France Earthenware Market, By Application, 2019-2031 (USD Billion)
25. U.K. Earthenware Market, By Type, 2019-2031 (USD Billion)
26. U.K. Earthenware Market, By Application, 2019-2031 (USD Billion)
27. Italy Earthenware Market, By Type, 2019-2031 (USD Billion)
28. Italy Earthenware Market, By Application, 2019-2031 (USD Billion)
29. Spain Earthenware Market, By Type, 2019-2031 (USD Billion)
30. Spain Earthenware Market, By Application, 2019-2031 (USD Billion)
31. Asia Pacific Earthenware Market, By Type, 2019-2031 (USD Billion)
32. Asia Pacific Earthenware Market, By Application, 2019-2031 (USD Billion)
33. Japan Earthenware Market, By Type, 2019-2031 (USD Billion)
34. Japan Earthenware Market, By Application, 2019-2031 (USD Billion)
35. China Earthenware Market, By Type, 2019-2031 (USD Billion)
36. China Earthenware Market, By Application, 2019-2031 (USD Billion)
37. India Earthenware Market, By Type, 2019-2031 (USD Billion)
38. India Earthenware Market, By Application, 2019-2031 (USD Billion)
39. South America Earthenware Market, By Type, 2019-2031 (USD Billion)
40. South America Earthenware Market, By Application, 2019-2031 (USD Billion)
41. Brazil Earthenware Market, By Type, 2019-2031 (USD Billion)
42. Brazil Earthenware Market, By Application, 2019-2031 (USD Billion)
43. Middle East and Africa Earthenware Market, By Type, 2019-2031 (USD Billion)
44. Middle East and Africa Earthenware Market, By Application, 2019-2031 (USD Billion)
45. UAE Earthenware Market, By Type, 2019-2031 (USD Billion)
46. UAE Earthenware Market, By Application, 2019-2031 (USD Billion)
47. South Africa Earthenware Market, By Type, 2019-2031 (USD Billion)
48. South Africa Earthenware Market, By Application, 2019-2031 (USD Billion)
List of Figures
1. Global Earthenware Market Segmentation
2. Earthenware Market: Research Methodology
3. Market Size Estimation Methodology: Bottom-Up Approach
4. Market Size Estimation Methodology: Top-Down Approach
5. Data Triangulation
6. Porter’s Five Forces Analysis
7. Value Chain Analysis
8. Global Earthenware Market Attractiveness Analysis by Type
9. Global Earthenware Market Attractiveness Analysis by Application
10. Global Earthenware Market Attractiveness Analysis by Region
11. Global Earthenware Market: Dynamics
12. Global Earthenware Market Share by Type (2022 & 2031)
13. Global Earthenware Market Share by Application (2022 & 2031)
14. Global Earthenware Market Share by Regions (2022 & 2031)
15. Global Earthenware Market Share by Company (2022)
This study forecasts revenue at global, regional, and country levels from 2019 to 2031. The Brainy Insights has segmented the global earthenware market based on below-mentioned segments:
Global Earthenware Market by Type:
Global Earthenware Market by Application:
Global Earthenware Market by Region:
Research has its special purpose to undertake marketing efficiently. In this competitive scenario, businesses need information across all industry verticals; the information about customer wants, market demand, competition, industry trends, distribution channels etc. This information needs to be updated regularly because businesses operate in a dynamic environment. Our organization, The Brainy Insights incorporates scientific and systematic research procedures in order to get proper market insights and industry analysis for overall business success. The analysis consists of studying the market from a miniscule level wherein we implement statistical tools which helps us in examining the data with accuracy and precision.
Our research reports feature both; quantitative and qualitative aspects for any market. Qualitative information for any market research process are fundamental because they reveal the customer needs and wants, usage and consumption for any product/service related to a specific industry. This in turn aids the marketers/investors in knowing certain perceptions of the customers. Qualitative research can enlighten about the different product concepts and designs along with unique service offering that in turn, helps define marketing problems and generate opportunities. On the other hand, quantitative research engages with the data collection process through interviews, e-mail interactions, surveys and pilot studies. Quantitative aspects for the market research are useful to validate the hypotheses generated during qualitative research method, explore empirical patterns in the data with the help of statistical tools, and finally make the market estimations.
The Brainy Insights offers comprehensive research and analysis, based on a wide assortment of factual insights gained through interviews with CXOs and global experts and secondary data from reliable sources. Our analysts and industry specialist assume vital roles in building up statistical tools and analysis models, which are used to analyse the data and arrive at accurate insights with exceedingly informative research discoveries. The data provided by our organization have proven precious to a diverse range of companies, facilitating them to address issues such as determining which products/services are the most appealing, whether or not customers use the product in the manner anticipated, the purchasing intentions of the market and many others.
Our research methodology encompasses an idyllic combination of primary and secondary initiatives. Key phases involved in this process are listed below:

The phase involves the gathering and collecting of market data and its related information with the help of different sources & research procedures.

The data procurement stage involves in data gathering and collecting through various data sources.
This stage involves in extensive research. These data sources includes:
Purchased Database: Purchased databases play a crucial role in estimating the market sizes irrespective of the domain. Our purchased database includes:
Primary Research: The Brainy Insights interacts with leading companies and experts of the concerned domain to develop the analyst team’s market understanding and expertise. It improves and substantiates every single data presented in the market reports. Primary research mainly involves in telephonic interviews, E-mail interactions and face-to-face interviews with the raw material providers, manufacturers/producers, distributors, & independent consultants. The interviews that we conduct provides valuable data on market size and industry growth trends prevailing in the market. Our organization also conducts surveys with the various industry experts in order to gain overall insights of the industry/market. For instance, in healthcare industry we conduct surveys with the pharmacists, doctors, surgeons and nurses in order to gain insights and key information of a medical product/device/equipment which the customers are going to usage. Surveys are conducted in the form of questionnaire designed by our own analyst team. Surveys plays an important role in primary research because surveys helps us to identify the key target audiences of the market. Additionally, surveys helps to identify the key target audience engaged with the market. Our survey team conducts the survey by targeting the key audience, thus gaining insights from them. Based on the perspectives of the customers, this information is utilized to formulate market strategies. Moreover, market surveys helps us to understand the current competitive situation of the industry. To be precise, our survey process typically involve with the 360 analysis of the market. This analytical process begins by identifying the prospective customers for a product or service related to the market/industry to obtain data on how a product/service could fit into customers’ lives.

Secondary Research: The secondary data sources includes information published by the on-profit organizations such as World bank, WHO, company fillings, investor presentations, annual reports, national government documents, statistical databases, blogs, articles, white papers and others. From the annual report, we analyse a company’s revenue to understand the key segment and market share of that organization in a particular region. We analyse the company websites and adopt the product mapping technique which is important for deriving the segment revenue. In the product mapping method, we select and categorize the products offered by the companies catering to domain specific market, deduce the product revenue for each of the companies so as to get overall estimation of the market size. We also source data and analyses trends based on information received from supply side and demand side intermediaries in the value chain. The supply side denotes the data gathered from supplier, distributor, wholesaler and the demand side illustrates the data gathered from the end customers for respective market domain.

The supply side for a domain specific market is analysed by:
The demand side for the market is estimated through:
In-house Library: Apart from these third-party sources, we have our in-house library of qualitative and quantitative information. Our in-house database includes market data for various industry and domains. These data are updated on regular basis as per the changing market scenario. Our library includes, historic databases, internal audit reports and archives.
Sometimes there are instances where there is no metadata or raw data available for any domain specific market. For those cases, we use our expertise to forecast and estimate the market size in order to generate comprehensive data sets. Our analyst team adopt a robust research technique in order to produce the estimates:
Data Synthesis: This stage involves the analysis & mapping of all the information obtained from the previous step. It also involves in scrutinizing the data for any discrepancy observed while data gathering related to the market. The data is collected with consideration to the heterogeneity of sources. Robust scientific techniques are in place for synthesizing disparate data sets and provide the essential contextual information that can orient market strategies. The Brainy Insights has extensive experience in data synthesis where the data passes through various stages:


Market Deduction & Formulation: The final stage comprises of assigning data points at appropriate market spaces so as to deduce feasible conclusions. Analyst perspective & subject matter expert based holistic form of market sizing coupled with industry analysis also plays a crucial role in this stage.
This stage involves in finalization of the market size and numbers that we have collected from data integration step. With data interpolation, it is made sure that there is no gap in the market data. Successful trend analysis is done by our analysts using extrapolation techniques, which provide the best possible forecasts for the market.
Data Validation & Market Feedback: Validation is the most important step in the process. Validation & re-validation via an intricately designed process helps us finalize data-points to be used for final calculations.

The Brainy Insights interacts with leading companies and experts of the concerned domain to develop the analyst team’s market understanding and expertise. It improves and substantiates every single data presented in the market reports. The data validation interview and discussion panels are typically composed of the most experienced industry members. The participants include, however, are not limited to:
Moreover, we always validate our data and findings through primary respondents from all the major regions we are working on.


Free Customization
Fortune 500 Clients
Free Yearly Update On Purchase Of Multi/Corporate License
Companies Served Till Date