- +1-315-215-1633
- sales@thebrainyinsights.com

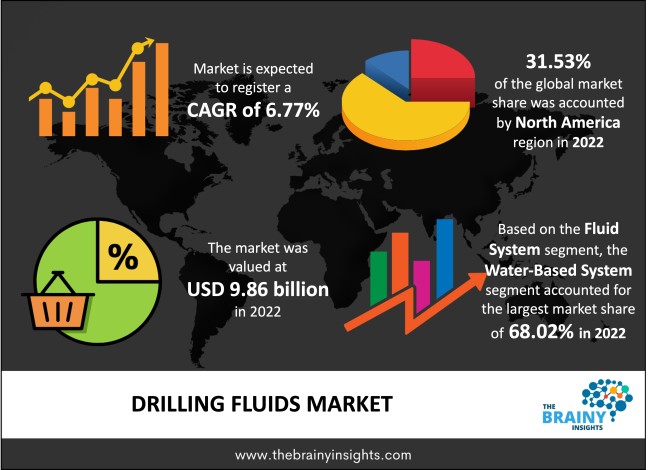
The global drilling fluids market was valued at USD 9.86 Billion in 2022 and grew at a CAGR of 6.77% from 2023 to 2032. The market is expected to reach USD 18.98 Billion by 2032. The demand for drilling fluids is increasing due to the number of exploration operations in different regions. Further, increasing investment in the sustainable energy sector will provide lucrative opportunities to the market.
Drilling fluid, commonly referred to as drilling mud, is used in geotechnical engineering to facilitate drilling boreholes into the earth. Drilling fluids are frequently employed for drilling water wells, natural gas and oil wells, and exploration of drilling rigs. Drilling fluids have a variety of uses, including regulating formation pressures, clearing drilling debris from the well, lubricating and cooling the bit, transferring hydraulic energy in the bit, and maintaining well control and stability. Drilling fluids must exert hydrostatic pressure to prevent the formulation fluids from blocking the wellbore. Although drilling fluid chemistry and technique have advanced significantly, the fundamental idea has remained the same. Drilling fluids helps in attaining maximize recovery and simultaneously reduces the time required for production of oil.
Get an overview of this study by requesting a free sample
Increasing use of drilling fluids in different applications: Drilling fluids play crucial roles in the well-building process by carrying cuttings to the surface, preventing well-control problems and wellbore instability, minimizing formation damage, cooling and lubricating the drill string, and providing information about the wellbore, among other tasks. The drill bit and drill string rotate at a reasonably high speed per minute throughout or for a portion of the duration of the actual drilling operation. Drilling fluid travels upward through the wellbore annulus while passing through the drill string, cooling the drill string and reducing friction with the well wall or casing. The main application of the drilling fluid formula is to smooth the operation of the drilling project inside the wellbore for carrying out different explorations.
Fluctuating cost of raw materials: The demand in the oil and gas industry has always been unstable as the industry is vulnerable to market sentiments. Due to continuous fluctuating demand and prices in the industry, the demand for drilling fluids is hindered. The disturbed demand and supply chain has greatly affected the production capacity. With less production, the drilling fluids market faces challenges in terms of sales volume. Therefore, raw material price fluctuation is one of the key factors that may hamper the market's growth.
Rising number of deepwater drilling activities: Many resources in the deep sea still need to be discovered. These resources are crucial to the energy sector. Over the years, the increase in energy consumption in many regions has resulted in a rise in resource demand. Energy exploration and production activities have increased, increasing the demand for well-completion equipment. With increased discoveries of such resources, demand for oilfield services has also increased. This has led to an increase in the number of oil fields and drilling of uncompleted oil wells. The expanding economies have an increased demand for raw materials used in different industries. Thus, exploring unconventional resources serves the demand for drilling fluids.
The regions analyzed for the market include North America, Europe, South America, Asia Pacific, the Middle East, and Africa. North America emerged as the most significant drilling fluids market, with a 31.53% market revenue share in 2022.
North America region will account for the largest market share with revenue growth. There is tremendous demand for drilling fluids due to growing investment in oil and gas production in the U.S. Further, increasing investment for exploring potential reserves in the region is fueling the growth of drilling fluids. Many regional agencies are promoting the use of drilling fluids to increase efficiency at the exploration site and reduce production costs.
North America region Drilling Fluids Market Share in 2022 - 31.53%
www.thebrainyinsights.com
Check the geographical analysis of this market by requesting a free sample
The fluid system segment is divided into synthetic-based, oil-based, water-based, and others. The water-based system segment dominated the market, with a share of around 68.02% in 2022. Due to economics and environmental considerations, water-based systems are more practical and desirable for drilling than synthetic and oil-based systems. These drilling fluids are widely used because they are less expensive and simpler to make than other varieties.
The application segment is divided into offshore and onshore. The onshore segment dominated the market, with a share of around 62.19% in 2022. Onshore wells are the common types used in the oil and gas industries. Simpler and conventional equipment can be used in onshore wells as drilling is much easier than in offshore wells. Also, more storage and transportation options are available in the onshore wells.
The well-type segment is divided into conventional and HPHT. The conventional segment dominated the market, with a share of around 68.16% in 2022. The drilling fluids are widely used in the conventional walls to restrict the entry of formulation fluids. Conventional wells are typical in that they are vertically drilled downward from a place above the reservoir.
Report Description:
| Attribute | Description |
|---|---|
| Market Size | Revenue (USD Billion) |
| Market size value in 2022 | USD 9.86 Billion |
| Market size value in 2032 | USD 18.98 Billion |
| CAGR (2023 to 2032) | 6.77% |
| Historical data | 2019-2021 |
| Base Year | 2022 |
| Forecast | 2023-2032 |
| Region | The regions analyzed for the market are Asia Pacific, Europe, South America, North America, and Middle East & Africa. Furthermore, the regions are further analyzed at the country level. |
| Segments | Fluid System, Application and Well Type |
As per The Brainy Insights, the size of the drilling fluids market was valued USD 9.86 billion in 2022 to USD 18.98 billion by 2032.
Global drilling fluids market is growing at a CAGR of 6.77% during the forecast period 2023-2032.
North America region emerged as the largest market for the drilling fluids.
The market's growth will be influenced by the rising usage of drilling fluids among different applications.
The fluctuating cost of raw materials can hamper the market growth.
The rising number of deep water drilling activities is providing lucrative opportunities to the market.
Key players are Baker Hughes, Inc., Halliburton, Inc., CES Energy Solutions Corp., Newpark Resources, Inc., Petrochem Performance Chemical Ltd. LLC, Scomi Group Bhd, Schlumberger Ltd., Weatherford International among others.
1. Introduction
1.1. Objectives of the Study
1.2. Market Definition
1.3. Research Scope
1.4. Currency
1.5. Key Target Audience
2. Research Methodology and Assumptions
3. Executive Summary
4. Premium Insights
4.1. Porter’s Five Forces Analysis
4.2. Value Chain Analysis
4.3. Top Investment Pockets
4.3.1. Market Attractiveness Analysis by Fluid System
4.3.2. Market Attractiveness Analysis by Application
4.3.3. Market Attractiveness Analysis by Well Type
4.3.4. Market Attractiveness Analysis by Region
4.4. Industry Trends
5. Market Dynamics
5.1. Market Evaluation
5.2. Drivers
5.2.1. Increasing use of drilling fluids in different applications
5.3. Restraints
5.3.1. Fluctuating cost of raw materials
5.4. Opportunities
5.4.1. Increasing investment in deepwater activities
5.5. Challenges
5.5.1. Negative effect on the environment
6. Global Drilling Fluids Market Analysis and Forecast, By Fluid System
6.1. Segment Overview
6.2. Synthetic Based System
6.3. Oil Based System
6.4. Water-Based System
6.5. Others
7. Global Drilling Fluids Market Analysis and Forecast, By Application
7.1. Segment Overview
7.2. Offshore
7.3. Onshore
8. Global Drilling Fluids Market Analysis and Forecast, By Well Type
8.1. Segment Overview
8.2. Conventional
8.3. HPHT
9. Global Drilling Fluids Market Analysis and Forecast, By Regional Analysis
9.1. Segment Overview
9.2. North America
9.2.1. U.S.
9.2.2. Canada
9.2.3. Mexico
9.3. Europe
9.3.1. Germany
9.3.2. France
9.3.3. U.K.
9.3.4. Italy
9.3.5. Spain
9.4. Asia-Pacific
9.4.1. Japan
9.4.2. China
9.4.3. India
9.5. South America
9.5.1. Brazil
9.6. Middle East and Africa
9.6.1. UAE
9.6.2. South Africa
10. Global Drilling Fluids Market-Competitive Landscape
10.1. Overview
10.2. Market Share of Key Players in the Drilling Fluids Market
10.2.1. Global Company Market Share
10.2.2. North America Company Market Share
10.2.3. Europe Company Market Share
10.2.4. APAC Company Market Share
10.3. Competitive Situations and Trends
10.3.1. Product Launches and Developments
10.3.2. Partnerships, Collaborations, and Agreements
10.3.3. Mergers & Acquisitions
10.3.4. Expansions
11. Company Profiles
11.1. Baker Hughes, Inc.
11.1.1. Business Overview
11.1.2. Company Snapshot
11.1.3. Company Market Share Analysis
11.1.4. Company Product Portfolio
11.1.5. Recent Developments
11.1.6. SWOT Analysis
11.2. Halliburton, Inc.
11.2.1. Business Overview
11.2.2. Company Snapshot
11.2.3. Company Market Share Analysis
11.2.4. Company Product Portfolio
11.2.5. Recent Developments
11.2.6. SWOT Analysis
11.3. CES Energy Solutions Corp.
11.3.1. Business Overview
11.3.2. Company Snapshot
11.3.3. Company Market Share Analysis
11.3.4. Company Product Portfolio
11.3.5. Recent Developments
11.3.6. SWOT Analysis
11.4. Newpark Resources, Inc.
11.4.1. Business Overview
11.4.2. Company Snapshot
11.4.3. Company Market Share Analysis
11.4.4. Company Product Portfolio
11.4.5. Recent Developments
11.4.6. SWOT Analysis
11.5. Petrochem Performance Chemical Ltd. LLC
11.5.1. Business Overview
11.5.2. Company Snapshot
11.5.3. Company Market Share Analysis
11.5.4. Company Product Portfolio
11.5.5. Recent Developments
11.5.6. SWOT Analysis
11.6. Scomi Group Bhd
11.6.1. Business Overview
11.6.2. Company Snapshot
11.6.3. Company Market Share Analysis
11.6.4. Company Product Portfolio
11.6.5. Recent Developments
11.6.6. SWOT Analysis
11.7. Schlumberger Ltd.
11.7.1. Business Overview
11.7.2. Company Snapshot
11.7.3. Company Market Share Analysis
11.7.4. Company Product Portfolio
11.7.5. Recent Developments
11.7.6. SWOT Analysis
11.8. Weatherford International
11.8.1. Business Overview
11.8.2. Company Snapshot
11.8.3. Company Market Share Analysis
11.8.4. Company Product Portfolio
11.8.5. Recent Developments
11.8.6. SWOT Analysis
List of Table
1. Global Drilling Fluids Market, By Fluid System, 2019-2032 (USD Billion)
2. Global Synthetic-Based, Drilling Fluids Market, By Region, 2019-2032 (USD Billion)
3. Global Oil-Based, Drilling Fluids Market, By Region, 2019-2032 (USD Billion)
4. Global Water-Based, Drilling Fluids Market, By Region, 2019-2032 (USD Billion)
5. Global Others, Drilling Fluids Market, By Region, 2019-2032 (USD Billion)
6. Global Drilling Fluids Market, By Application , 2019-2032 (USD Billion)
7. Global Offshore, Drilling Fluids Market, By Region, 2019-2032 (USD Billion)
8. Global Onshore, Drilling Fluids Market, By Region, 2019-2032 (USD Billion)
9. Global Drilling Fluids Market, By Well Type, 2019-2032 (USD Billion)
10. Global Conventional, Drilling Fluids Market, By Region, 2019-2032 (USD Billion)
11. Global HPHT, Drilling Fluids Market, By Region, 2019-2032 (USD Billion)
12. Global Drilling Fluids Market, By Region, 2019-2032 (USD Billion)
13. North America Drilling Fluids Market, By Fluid System, 2019-2032 (USD Billion)
14. North America Drilling Fluids Market, By Application , 2019-2032 (USD Billion)
15. North America Drilling Fluids Market, By Well Type, 2019-2032 (USD Billion)
16. U.S. Drilling Fluids Market, By Fluid System, 2019-2032 (USD Billion)
17. U.S. Drilling Fluids Market, By Application , 2019-2032 (USD Billion)
18. U.S. Drilling Fluids Market, By Well Type, 2019-2032 (USD Billion)
19. Canada Drilling Fluids Market, By Fluid System, 2019-2032 (USD Billion)
20. Canada Drilling Fluids Market, By Application , 2019-2032 (USD Billion)
21. Canada Drilling Fluids Market, By Well Type, 2019-2032 (USD Billion)
22. Mexico Drilling Fluids Market, By Fluid System, 2019-2032 (USD Billion)
23. Mexico Drilling Fluids Market, By Application , 2019-2032 (USD Billion)
24. Mexico Drilling Fluids Market, By Well Type, 2019-2032 (USD Billion)
25. Europe Drilling Fluids Market, By Fluid System, 2019-2032 (USD Billion)
26. Europe Drilling Fluids Market, By Application , 2019-2032 (USD Billion)
27. Europe Drilling Fluids Market, By Well Type, 2019-2032 (USD Billion)
28. Germany Drilling Fluids Market, By Fluid System, 2019-2032 (USD Billion)
29. Germany Drilling Fluids Market, By Application , 2019-2032 (USD Billion)
30. Germany Drilling Fluids Market, By Well Type, 2019-2032 (USD Billion)
31. France Drilling Fluids Market, By Fluid System, 2019-2032 (USD Billion)
32. France Drilling Fluids Market, By Application , 2019-2032 (USD Billion)
33. France Drilling Fluids Market, By Well Type, 2019-2032 (USD Billion)
34. U.K. Drilling Fluids Market, By Fluid System, 2019-2032 (USD Billion)
35. U.K. Drilling Fluids Market, By Application , 2019-2032 (USD Billion)
36. U.K. Drilling Fluids Market, By Well Type, 2019-2032 (USD Billion)
37. Italy Drilling Fluids Market, By Fluid System, 2019-2032 (USD Billion)
38. Italy Drilling Fluids Market, By Application , 2019-2032 (USD Billion)
39. Italy Drilling Fluids Market, By Well Type, 2019-2032 (USD Billion)
40. Spain Drilling Fluids Market, By Fluid System, 2019-2032 (USD Billion)
41. Spain Drilling Fluids Market, By Application , 2019-2032 (USD Billion)
42. Spain Drilling Fluids Market, By Well Type, 2019-2032 (USD Billion)
43. Asia Pacific Drilling Fluids Market, By Fluid System, 2019-2032 (USD Billion)
44. Asia Pacific Drilling Fluids Market, By Application , 2019-2032 (USD Billion)
45. Asia Pacific Drilling Fluids Market, By Well Type, 2019-2032 (USD Billion)
46. Japan Drilling Fluids Market, By Fluid System, 2019-2032 (USD Billion)
47. Japan Drilling Fluids Market, By Application , 2019-2032 (USD Billion)
48. Japan Drilling Fluids Market, By Well Type, 2019-2032 (USD Billion)
49. China Drilling Fluids Market, By Fluid System, 2019-2032 (USD Billion)
50. China Drilling Fluids Market, By Application , 2019-2032 (USD Billion)
51. China Drilling Fluids Market, By Well Type, 2019-2032 (USD Billion)
52. India Drilling Fluids Market, By Fluid System, 2019-2032 (USD Billion)
53. India Drilling Fluids Market, By Application , 2019-2032 (USD Billion)
54. India Drilling Fluids Market, By Well Type, 2019-2032 (USD Billion)
55. South America Drilling Fluids Market, By Fluid System, 2019-2032 (USD Billion)
56. South America Drilling Fluids Market, By Application , 2019-2032 (USD Billion)
57. South America Drilling Fluids Market, By Well Type, 2019-2032 (USD Billion)
58. Brazil Drilling Fluids Market, By Fluid System, 2019-2032 (USD Billion)
59. Brazil Drilling Fluids Market, By Application , 2019-2032 (USD Billion)
60. Brazil Drilling Fluids Market, By Well Type, 2019-2032 (USD Billion)
61. Middle East and Africa Drilling Fluids Market, By Fluid System, 2019-2032 (USD Billion)
62. Middle East and Africa Drilling Fluids Market, By Application , 2019-2032 (USD Billion)
63. Middle East and Africa Drilling Fluids Market, By Well Type, 2019-2032 (USD Billion)
64. UAE Drilling Fluids Market, By Fluid System, 2019-2032 (USD Billion)
65. UAE Drilling Fluids Market, By Application , 2019-2032 (USD Billion)
66. UAE Drilling Fluids Market, By Well Type, 2019-2032 (USD Billion)
67. South Africa Drilling Fluids Market, By Fluid System, 2019-2032 (USD Billion)
68. South Africa Drilling Fluids Market, By Application , 2019-2032 (USD Billion)
69. South Africa Drilling Fluids Market, By Well Type, 2019-2032 (USD Billion)
List of Figures
1. Global Drilling Fluids Market Segmentation
2. Drilling Fluids Market: Research Methodology
3. Market Size Estimation Methodology: Bottom-Up Approach
4. Market Size Estimation Methodology: Top-Down Approach
5. Data Triangulation
6. Porter’s Five Forces Analysis
7. Value Chain Analysis
8. Global Drilling Fluids Market Attractiveness Analysis by Fluid System
9. Global Drilling Fluids Market Attractiveness Analysis by Application
10. Global Drilling Fluids Market Attractiveness Analysis by Well Type
11. Global Drilling Fluids Market Attractiveness Analysis by Region
12. Global Drilling Fluids Market: Dynamics
13. Global Drilling Fluids Market Share by Fluid System (2022 & 2032)
14. Global Drilling Fluids Market Share by Application (2022 & 2032)
15. Global Drilling Fluids Market Share by Well Type (2022 & 2032)
16. Global Drilling Fluids Market Share by Regions (2022 & 2032)
17. Global Drilling Fluids Market Share by Company (2022)
This study forecasts revenue at global, regional, and country levels from 2019 to 2032. The Brainy Insights has segmented the global drilling fluids market based on below mentioned segments:
Global Drilling Fluids Market by Fluid System:
Global Drilling Fluids Market by Application:
Global Drilling Fluids Market by Well Type:
Global Drilling Fluids Market by Region:
Research has its special purpose to undertake marketing efficiently. In this competitive scenario, businesses need information across all industry verticals; the information about customer wants, market demand, competition, industry trends, distribution channels etc. This information needs to be updated regularly because businesses operate in a dynamic environment. Our organization, The Brainy Insights incorporates scientific and systematic research procedures in order to get proper market insights and industry analysis for overall business success. The analysis consists of studying the market from a miniscule level wherein we implement statistical tools which helps us in examining the data with accuracy and precision.
Our research reports feature both; quantitative and qualitative aspects for any market. Qualitative information for any market research process are fundamental because they reveal the customer needs and wants, usage and consumption for any product/service related to a specific industry. This in turn aids the marketers/investors in knowing certain perceptions of the customers. Qualitative research can enlighten about the different product concepts and designs along with unique service offering that in turn, helps define marketing problems and generate opportunities. On the other hand, quantitative research engages with the data collection process through interviews, e-mail interactions, surveys and pilot studies. Quantitative aspects for the market research are useful to validate the hypotheses generated during qualitative research method, explore empirical patterns in the data with the help of statistical tools, and finally make the market estimations.
The Brainy Insights offers comprehensive research and analysis, based on a wide assortment of factual insights gained through interviews with CXOs and global experts and secondary data from reliable sources. Our analysts and industry specialist assume vital roles in building up statistical tools and analysis models, which are used to analyse the data and arrive at accurate insights with exceedingly informative research discoveries. The data provided by our organization have proven precious to a diverse range of companies, facilitating them to address issues such as determining which products/services are the most appealing, whether or not customers use the product in the manner anticipated, the purchasing intentions of the market and many others.
Our research methodology encompasses an idyllic combination of primary and secondary initiatives. Key phases involved in this process are listed below:

The phase involves the gathering and collecting of market data and its related information with the help of different sources & research procedures.

The data procurement stage involves in data gathering and collecting through various data sources.
This stage involves in extensive research. These data sources includes:
Purchased Database: Purchased databases play a crucial role in estimating the market sizes irrespective of the domain. Our purchased database includes:
Primary Research: The Brainy Insights interacts with leading companies and experts of the concerned domain to develop the analyst team’s market understanding and expertise. It improves and substantiates every single data presented in the market reports. Primary research mainly involves in telephonic interviews, E-mail interactions and face-to-face interviews with the raw material providers, manufacturers/producers, distributors, & independent consultants. The interviews that we conduct provides valuable data on market size and industry growth trends prevailing in the market. Our organization also conducts surveys with the various industry experts in order to gain overall insights of the industry/market. For instance, in healthcare industry we conduct surveys with the pharmacists, doctors, surgeons and nurses in order to gain insights and key information of a medical product/device/equipment which the customers are going to usage. Surveys are conducted in the form of questionnaire designed by our own analyst team. Surveys plays an important role in primary research because surveys helps us to identify the key target audiences of the market. Additionally, surveys helps to identify the key target audience engaged with the market. Our survey team conducts the survey by targeting the key audience, thus gaining insights from them. Based on the perspectives of the customers, this information is utilized to formulate market strategies. Moreover, market surveys helps us to understand the current competitive situation of the industry. To be precise, our survey process typically involve with the 360 analysis of the market. This analytical process begins by identifying the prospective customers for a product or service related to the market/industry to obtain data on how a product/service could fit into customers’ lives.

Secondary Research: The secondary data sources includes information published by the on-profit organizations such as World bank, WHO, company fillings, investor presentations, annual reports, national government documents, statistical databases, blogs, articles, white papers and others. From the annual report, we analyse a company’s revenue to understand the key segment and market share of that organization in a particular region. We analyse the company websites and adopt the product mapping technique which is important for deriving the segment revenue. In the product mapping method, we select and categorize the products offered by the companies catering to domain specific market, deduce the product revenue for each of the companies so as to get overall estimation of the market size. We also source data and analyses trends based on information received from supply side and demand side intermediaries in the value chain. The supply side denotes the data gathered from supplier, distributor, wholesaler and the demand side illustrates the data gathered from the end customers for respective market domain.

The supply side for a domain specific market is analysed by:
The demand side for the market is estimated through:
In-house Library: Apart from these third-party sources, we have our in-house library of qualitative and quantitative information. Our in-house database includes market data for various industry and domains. These data are updated on regular basis as per the changing market scenario. Our library includes, historic databases, internal audit reports and archives.
Sometimes there are instances where there is no metadata or raw data available for any domain specific market. For those cases, we use our expertise to forecast and estimate the market size in order to generate comprehensive data sets. Our analyst team adopt a robust research technique in order to produce the estimates:
Data Synthesis: This stage involves the analysis & mapping of all the information obtained from the previous step. It also involves in scrutinizing the data for any discrepancy observed while data gathering related to the market. The data is collected with consideration to the heterogeneity of sources. Robust scientific techniques are in place for synthesizing disparate data sets and provide the essential contextual information that can orient market strategies. The Brainy Insights has extensive experience in data synthesis where the data passes through various stages:


Market Deduction & Formulation: The final stage comprises of assigning data points at appropriate market spaces so as to deduce feasible conclusions. Analyst perspective & subject matter expert based holistic form of market sizing coupled with industry analysis also plays a crucial role in this stage.
This stage involves in finalization of the market size and numbers that we have collected from data integration step. With data interpolation, it is made sure that there is no gap in the market data. Successful trend analysis is done by our analysts using extrapolation techniques, which provide the best possible forecasts for the market.
Data Validation & Market Feedback: Validation is the most important step in the process. Validation & re-validation via an intricately designed process helps us finalize data-points to be used for final calculations.

The Brainy Insights interacts with leading companies and experts of the concerned domain to develop the analyst team’s market understanding and expertise. It improves and substantiates every single data presented in the market reports. The data validation interview and discussion panels are typically composed of the most experienced industry members. The participants include, however, are not limited to:
Moreover, we always validate our data and findings through primary respondents from all the major regions we are working on.


Free Customization
Fortune 500 Clients
Free Yearly Update On Purchase Of Multi/Corporate License
Companies Served Till Date