- +1-315-215-1633
- sales@thebrainyinsights.com

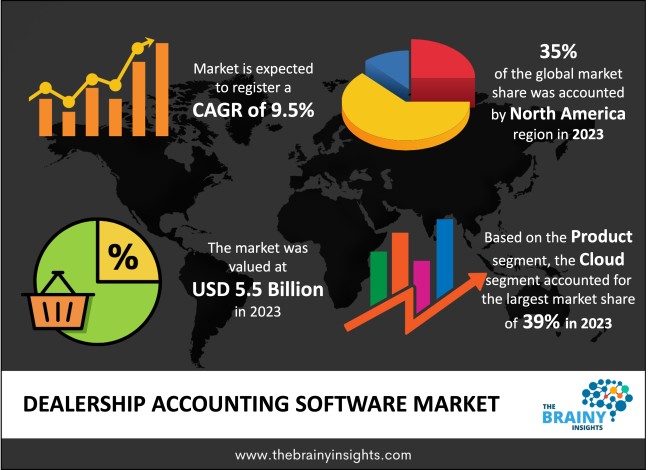
The global Dealership Accounting Software market was valued at USD 5.5 billion in 2023 and growing at a CAGR of 9.5% from 2024 to 2033. The market is expected to reach USD 13.63 billion by 2033. Compliance standards suiting to the needs of the market and integration with the other systems will potentially drive the growth of the Dealership Accounting Software Market. Whereas, increasing awareness towards digital transformation and increased efficiency and cost-reduction may drive the growth of the Dealership Accounting Software Market in the period forecasted.
Dealership accounting software is tailor-made to meet the unique needs of automotive dealerships, assisting in managing financial transactions, reporting, and compliance tasks. It includes specialized features such as inventory management, tracking vehicle sales, handling service department finances, and integrating with manufacturer incentives and rebates.
Get an overview of this study by requesting a free sample
Compliance standards suiting to the needs of the market– Given the multitude of legal and regulatory obligations in the automobile sector, there's a strong demand for accounting software customized for auto dealerships. This software assists companies in meeting regulatory requirements, adhering to financial reporting standards, and complying with tax laws.
Opposition to change– The automobile sector, akin to various industries, may encounter resistance when attempting to alter entrenched practices. Persuading certain auto dealerships to embrace modern accounting software can prove challenging, particularly if they are accustomed to manual accounting processes or outdated systems.
Increasing awareness towards digital transformation- Similar to numerous other sectors, the automobile industry is undergoing a digital transformation. Auto dealerships are increasingly leveraging technology to enhance customer experiences, streamline processes, and derive insights from data. There is likely significant demand for accounting software that facilitates these digital endeavors.
The regions analyzed for the market include North America, Europe, South America, Asia Pacific, the Middle East, and Africa. North America emerged as the largest global Dealership Accounting Software market, accounting for 35% of the total market. Owing to rapid technological advancements in the region. Whereas Asia Pacific exhibits the highest growth rate in the market owing to automated technology for data entry, reconciliation, and reporting in the region.
North America Region Dealership Accounting Software Market Share in 2023 - 35%
www.thebrainyinsights.com
Check the geographical analysis of this market by requesting a free sample
In 2023, the cloud segment accounted for approximately 39% of the market share. Cloud-based solutions offer cost-saving benefits by reducing the necessity for dealerships to invest in expensive hardware and software licensing, which is particularly advantageous for smaller dealerships with limited budgets. These solutions are easily scalable, enabling dealerships to adjust resources according to their needs without incurring significant additional expenses. Additionally, cloud accessibility from any internet-connected device allows for convenient remote access to crucial financial data. Moreover, cloud providers handle software maintenance, upgrades, and security measures, alleviating the burden on dealership IT staff and reducing overall operational and IT expenses.
In 2023, large organizations dominated the auto dealership accounting software market, accounting for over 74% of its share. These large dealerships, often equipped with substantial financial resources, can afford to invest in sophisticated and comprehensive accounting systems, despite their higher upfront costs or ongoing subscription fees. With multiple locations, diverse inventories, and significant sales volumes, these dealerships require software that offers extensive features and functionalities to manage complex accounting tasks efficiently. They are usually among the first to adopt new technologies and are more likely to recognize the benefits of specialized accounting software tailored for car dealerships.
| Attribute | Description |
|---|---|
| Market Size | Revenue (USD Billion) |
| Market size value in 2023 | USD 5.5 Billion |
| Market size value in 2033 | USD 13.63 Billion |
| CAGR (2024 to 2033) | 9.5% |
| Historical data | 2020-2022 |
| Base Year | 2023 |
| Forecast | 2024-2033 |
| Region | The regions analyzed for the market are Asia Pacific, Europe, South America, North America, and Middle East & Africa. Furthermore, the regions are further analyzed at the country level. |
| Segments | Product, End-User |
As per The Brainy Insights, the size of the dealership accounting software market was valued at USD 5.5 billion in 2023 to 13.63 billion by 2033.
The global dealership accounting software market is growing at a CAGR of 9.5% during the forecast period 2024-2033.
The North America region emerged as the largest market for the dealership accounting software.
The compliance standards suiting to the needs of the market will influence the market's growth.
1. Introduction
1.1. Objectives of the Study
1.2. Market Definition
1.3. Research Scope
1.4. Currency
1.5. Key Target Audience
2. Research Methodology and Assumptions
3. Executive Summary
4. Premium Insights
4.1. Porter’s Five Forces Analysis
4.2. Value Chain Analysis
4.3. Top Investment Pockets
4.3.1. Market Attractiveness Analysis by Product
4.3.2. Market Attractiveness Analysis by End-User
4.3.3. Market Attractiveness Analysis by Region
4.4. Industry Trends
5. Market Dynamics
5.1. Market Evaluation
5.2. Drivers
5.2.1. Compliance standards suiting to the needs of the market
5.2.2. Integration with the other systems
5.3. Restraints
5.3.1. Opposition to change
5.4. Opportunities
5.4.1. Increasing awareness towards digital transformation
5.4.2. Increased efficiency and cost-reduction
5.5. Challenges
5.5.1. Rising cost of implementation in the global market
6. Global Dealership Accounting Software Market Analysis and Forecast, By Product
6.1. Segment Overview
6.2. Cloud-Based
6.3. On-Premises
7. Global Dealership Accounting Software Market Analysis and Forecast, By End-User
7.1. Segment Overview
7.2. Small and Medium Enterprises (SMEs)
7.3. Large Enterprises
8. Global Dealership Accounting Software Market Analysis and Forecast, By Regional Analysis
8.1. Segment Overview
8.2. North America
8.2.1. U.S.
8.2.2. Canada
8.2.3. Mexico
8.3. Europe
8.3.1. Germany
8.3.2. France
8.3.3. U.K.
8.3.4. Italy
8.3.5. Spain
8.4. Asia-Pacific
8.4.1. Japan
8.4.2. China
8.4.3. India
8.5. South America
8.5.1. Brazil
8.6. Middle East and Africa
8.6.1. UAE
8.6.2. South Africa
9. Global Dealership Accounting Software Market-Competitive Landscape
9.1. Overview
9.2. Market Share of Key Players in Global Dealership Accounting Software Market
9.2.1. Global Company Market Share
9.2.2. North America Company Market Share
9.2.3. Europe Company Market Share
9.2.4. APAC Company Market Share
9.3. Competitive Situations and Trends
9.3.1. Product Launches and Developments
9.3.2. Partnerships, Collaborations, and Agreements
9.3.3. Mergers & Acquisitions
9.3.4. Expansions
10. Company Profiles
10.1. Intuit
10.1.1. Business Overview
10.1.2. Company Snapshot
10.1.3. Company Market Share Analysis
10.1.4. Company Product Portfolio
10.1.5. Recent Developments
10.1.6. SWOT Analysis
10.2. Advanced Business Computers of America
10.2.1. Business Overview
10.2.2. Company Snapshot
10.2.3. Company Market Share Analysis
10.2.4. Company Product Portfolio
10.2.5. Recent Developments
10.2.6. SWOT Analysis
10.3. Autosoft DMS
10.3.1. Business Overview
10.3.2. Company Snapshot
10.3.3. Company Market Share Analysis
10.3.4. Company Product Portfolio
10.3.5. Recent Developments
10.3.6. SWOT Analysis
10.4. Autostar Solutions
10.4.1. Business Overview
10.4.2. Company Snapshot
10.4.3. Company Market Share Analysis
10.4.4. Company Product Portfolio
10.4.5. Recent Developments
10.4.6. SWOT Analysis
10.5. Palmer Products
10.5.1. Business Overview
10.5.2. Company Snapshot
10.5.3. Company Market Share Analysis
10.5.4. Company Product Portfolio
10.5.5. Recent Developments
10.5.6. SWOT Analysis
10.6. Eagle Business Software
10.6.1. Business Overview
10.6.2. Company Snapshot
10.6.3. Company Market Share Analysis
10.6.4. Company Product Portfolio
10.6.5. Recent Developments
10.6.6. SWOT Analysis
10.7. AutoAps
10.7.1. Business Overview
10.7.2. Company Snapshot
10.7.3. Company Market Share Analysis
10.7.4. Company Product Portfolio
10.7.5. Recent Developments
10.7.6. SWOT Analysis
10.8. Centra Technologies DMCC
10.8.1. Business Overview
10.8.2. Company Snapshot
10.8.3. Company Market Share Analysis
10.8.4. Company Product Portfolio
10.8.5. Recent Developments
10.8.6. SWOT Analysis
10.9. Dealer Gears
10.9.1. Business Overview
10.9.2. Company Snapshot
10.9.3. Company Market Share Analysis
10.9.4. Company Product Portfolio
10.9.5. Recent Developments
10.9.6. SWOT Analysis
10.10. Dealer-Mate
10.10.1. Business Overview
10.10.2. Company Snapshot
10.10.3. Company Market Share Analysis
10.10.4. Company Product Portfolio
10.10.5. Recent Developments
10.10.6. SWOT Analysis
List of Table
1. Global Dealership Accounting Software Market, By Product, 2020-2033 (USD Billion)
2. Global Cloud-Based, Dealership Accounting Software Market, By Region, 2020-2033 (USD Billion)
3. Global On-Premises, Dealership Accounting Software Market, By Region, 2020-2033 (USD Billion)
4. Global Dealership Accounting Software Market, By End-User, 2020-2033 (USD Billion)
5. Global Small and Medium Enterprises (SMEs), Dealership Accounting Software Market, By Region, 2020-2033 (USD Billion)
6. Global Large Enterprises, Dealership Accounting Software Market, By Region, 2020-2033 (USD Billion)
7. Global Dealership Accounting Software Market, By Region, 2020-2033 (USD Billion)
8. North America Dealership Accounting Software Market, By Product, 2020-2033 (USD Billion)
9. North America Dealership Accounting Software Market, By End-User, 2020-2033 (USD Billion)
10. U.S. Dealership Accounting Software Market, By Product, 2020-2033 (USD Billion)
11. U.S. Dealership Accounting Software Market, By End-User, 2020-2033 (USD Billion)
12. Canada Dealership Accounting Software Market, By Product, 2020-2033 (USD Billion)
13. Canada Dealership Accounting Software Market, By End-User, 2020-2033 (USD Billion)
14. Mexico Dealership Accounting Software Market, By Product, 2020-2033 (USD Billion)
15. Mexico Dealership Accounting Software Market, By End-User, 2020-2033 (USD Billion)
16. Europe Dealership Accounting Software Market, By Product, 2020-2033 (USD Billion)
17. Europe Dealership Accounting Software Market, By End-User, 2020-2033 (USD Billion)
18. Germany Dealership Accounting Software Market, By Product, 2020-2033 (USD Billion)
19. Germany Dealership Accounting Software Market, By End-User, 2020-2033 (USD Billion)
20. France Dealership Accounting Software Market, By Product, 2020-2033 (USD Billion)
21. France Dealership Accounting Software Market, By End-User, 2020-2033 (USD Billion)
22. U.K. Dealership Accounting Software Market, By Product, 2020-2033 (USD Billion)
23. U.K. Dealership Accounting Software Market, By End-User, 2020-2033 (USD Billion)
24. Italy Dealership Accounting Software Market, By Product, 2020-2033 (USD Billion)
25. Italy Dealership Accounting Software Market, By End-User, 2020-2033 (USD Billion)
26. Spain Dealership Accounting Software Market, By Product, 2020-2033 (USD Billion)
27. Spain Dealership Accounting Software Market, By End-User, 2020-2033 (USD Billion)
28. Asia Pacific Dealership Accounting Software Market, By Product, 2020-2033 (USD Billion)
29. Asia Pacific Dealership Accounting Software Market, By End-User, 2020-2033 (USD Billion)
30. Japan Dealership Accounting Software Market, By Product, 2020-2033 (USD Billion)
31. Japan Dealership Accounting Software Market, By End-User, 2020-2033 (USD Billion)
32. China Dealership Accounting Software Market, By Product, 2020-2033 (USD Billion)
33. China Dealership Accounting Software Market, By End-User, 2020-2033 (USD Billion)
34. India Dealership Accounting Software Market, By Product, 2020-2033 (USD Billion)
35. India Dealership Accounting Software Market, By End-User, 2020-2033 (USD Billion)
36. South America Dealership Accounting Software Market, By Product, 2020-2033 (USD Billion)
37. South America Dealership Accounting Software Market, By End-User, 2020-2033 (USD Billion)
38. Brazil Dealership Accounting Software Market, By Product, 2020-2033 (USD Billion)
39. Brazil Dealership Accounting Software Market, By End-User, 2020-2033 (USD Billion)
40. Middle East and Africa Dealership Accounting Software Market, By Product, 2020-2033 (USD Billion)
41. Middle East and Africa Dealership Accounting Software Market, By End-User, 2020-2033 (USD Billion)
42. UAE Dealership Accounting Software Market, By Product, 2020-2033 (USD Billion)
43. UAE Dealership Accounting Software Market, By End-User, 2020-2033 (USD Billion)
44. South Africa Dealership Accounting Software Market, By Product, 2020-2033 (USD Billion)
45. South Africa Dealership Accounting Software Market, By End-User, 2020-2033 (USD Billion)
List of Figures
1. Global Dealership Accounting Software Market Segmentation
2. Global Dealership Accounting Software Market: Research Methodology
3. Market Size Estimation Methodology: Bottom-Up Approach
4. Market Size Estimation Methodology: Top-Down Approach
5. Data Triangulation
6. Porter’s Five Forces Analysis
7. Value Chain Analysis
8. Global Dealership Accounting Software Market Attractiveness Analysis by Product
9. Global Dealership Accounting Software Market Attractiveness Analysis by End-User
10. Global Dealership Accounting Software Market Attractiveness Analysis by Region
11. Global Dealership Accounting Software Market: Dynamics
12. Global Dealership Accounting Software Market Share by Product (2023 & 2033)
13. Global Dealership Accounting Software Market Share by End-User (2023 & 2033)
14. Global Dealership Accounting Software Market Share by Regions (2023 & 2033)
15. Global Dealership Accounting Software Market Share by Company (2023)
This study forecasts revenue at global, regional, and country levels from 2020 to 2033. The Brainy Insights has segmented the global dealership accounting software market based on below-mentioned segments:
Global Dealership Accounting Software Market by Product:
Global Dealership Accounting Software Market by End User:
Global Dealership Accounting Software Market by Region:
Research has its special purpose to undertake marketing efficiently. In this competitive scenario, businesses need information across all industry verticals; the information about customer wants, market demand, competition, industry trends, distribution channels etc. This information needs to be updated regularly because businesses operate in a dynamic environment. Our organization, The Brainy Insights incorporates scientific and systematic research procedures in order to get proper market insights and industry analysis for overall business success. The analysis consists of studying the market from a miniscule level wherein we implement statistical tools which helps us in examining the data with accuracy and precision.
Our research reports feature both; quantitative and qualitative aspects for any market. Qualitative information for any market research process are fundamental because they reveal the customer needs and wants, usage and consumption for any product/service related to a specific industry. This in turn aids the marketers/investors in knowing certain perceptions of the customers. Qualitative research can enlighten about the different product concepts and designs along with unique service offering that in turn, helps define marketing problems and generate opportunities. On the other hand, quantitative research engages with the data collection process through interviews, e-mail interactions, surveys and pilot studies. Quantitative aspects for the market research are useful to validate the hypotheses generated during qualitative research method, explore empirical patterns in the data with the help of statistical tools, and finally make the market estimations.
The Brainy Insights offers comprehensive research and analysis, based on a wide assortment of factual insights gained through interviews with CXOs and global experts and secondary data from reliable sources. Our analysts and industry specialist assume vital roles in building up statistical tools and analysis models, which are used to analyse the data and arrive at accurate insights with exceedingly informative research discoveries. The data provided by our organization have proven precious to a diverse range of companies, facilitating them to address issues such as determining which products/services are the most appealing, whether or not customers use the product in the manner anticipated, the purchasing intentions of the market and many others.
Our research methodology encompasses an idyllic combination of primary and secondary initiatives. Key phases involved in this process are listed below:

The phase involves the gathering and collecting of market data and its related information with the help of different sources & research procedures.

The data procurement stage involves in data gathering and collecting through various data sources.
This stage involves in extensive research. These data sources includes:
Purchased Database: Purchased databases play a crucial role in estimating the market sizes irrespective of the domain. Our purchased database includes:
Primary Research: The Brainy Insights interacts with leading companies and experts of the concerned domain to develop the analyst team’s market understanding and expertise. It improves and substantiates every single data presented in the market reports. Primary research mainly involves in telephonic interviews, E-mail interactions and face-to-face interviews with the raw material providers, manufacturers/producers, distributors, & independent consultants. The interviews that we conduct provides valuable data on market size and industry growth trends prevailing in the market. Our organization also conducts surveys with the various industry experts in order to gain overall insights of the industry/market. For instance, in healthcare industry we conduct surveys with the pharmacists, doctors, surgeons and nurses in order to gain insights and key information of a medical product/device/equipment which the customers are going to usage. Surveys are conducted in the form of questionnaire designed by our own analyst team. Surveys plays an important role in primary research because surveys helps us to identify the key target audiences of the market. Additionally, surveys helps to identify the key target audience engaged with the market. Our survey team conducts the survey by targeting the key audience, thus gaining insights from them. Based on the perspectives of the customers, this information is utilized to formulate market strategies. Moreover, market surveys helps us to understand the current competitive situation of the industry. To be precise, our survey process typically involve with the 360 analysis of the market. This analytical process begins by identifying the prospective customers for a product or service related to the market/industry to obtain data on how a product/service could fit into customers’ lives.

Secondary Research: The secondary data sources includes information published by the on-profit organizations such as World bank, WHO, company fillings, investor presentations, annual reports, national government documents, statistical databases, blogs, articles, white papers and others. From the annual report, we analyse a company’s revenue to understand the key segment and market share of that organization in a particular region. We analyse the company websites and adopt the product mapping technique which is important for deriving the segment revenue. In the product mapping method, we select and categorize the products offered by the companies catering to domain specific market, deduce the product revenue for each of the companies so as to get overall estimation of the market size. We also source data and analyses trends based on information received from supply side and demand side intermediaries in the value chain. The supply side denotes the data gathered from supplier, distributor, wholesaler and the demand side illustrates the data gathered from the end customers for respective market domain.

The supply side for a domain specific market is analysed by:
The demand side for the market is estimated through:
In-house Library: Apart from these third-party sources, we have our in-house library of qualitative and quantitative information. Our in-house database includes market data for various industry and domains. These data are updated on regular basis as per the changing market scenario. Our library includes, historic databases, internal audit reports and archives.
Sometimes there are instances where there is no metadata or raw data available for any domain specific market. For those cases, we use our expertise to forecast and estimate the market size in order to generate comprehensive data sets. Our analyst team adopt a robust research technique in order to produce the estimates:
Data Synthesis: This stage involves the analysis & mapping of all the information obtained from the previous step. It also involves in scrutinizing the data for any discrepancy observed while data gathering related to the market. The data is collected with consideration to the heterogeneity of sources. Robust scientific techniques are in place for synthesizing disparate data sets and provide the essential contextual information that can orient market strategies. The Brainy Insights has extensive experience in data synthesis where the data passes through various stages:


Market Deduction & Formulation: The final stage comprises of assigning data points at appropriate market spaces so as to deduce feasible conclusions. Analyst perspective & subject matter expert based holistic form of market sizing coupled with industry analysis also plays a crucial role in this stage.
This stage involves in finalization of the market size and numbers that we have collected from data integration step. With data interpolation, it is made sure that there is no gap in the market data. Successful trend analysis is done by our analysts using extrapolation techniques, which provide the best possible forecasts for the market.
Data Validation & Market Feedback: Validation is the most important step in the process. Validation & re-validation via an intricately designed process helps us finalize data-points to be used for final calculations.

The Brainy Insights interacts with leading companies and experts of the concerned domain to develop the analyst team’s market understanding and expertise. It improves and substantiates every single data presented in the market reports. The data validation interview and discussion panels are typically composed of the most experienced industry members. The participants include, however, are not limited to:
Moreover, we always validate our data and findings through primary respondents from all the major regions we are working on.


Free Customization
Fortune 500 Clients
Free Yearly Update On Purchase Of Multi/Corporate License
Companies Served Till Date