- +1-315-215-1633
- sales@thebrainyinsights.com

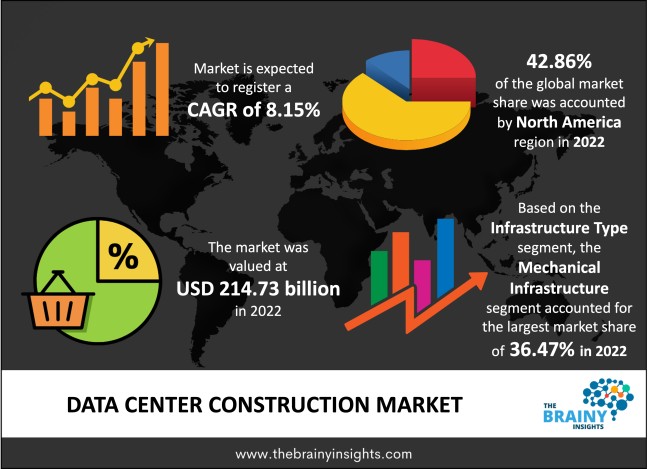
The global data center construction market was valued at USD 214.73 billion in 2022 and is anticipated to grow at a CAGR of 8.15% from 2023 to 2032. The market is expected to reach USD 470.07 billion by 2032. Multiple elements contribute to the expansion of the market, encompassing heightened investments in data centers, a surge in the embrace of colocation services, elevated data consumption, and robust demand for cloud-based services. Moreover, the infiltration of interconnected devices and convenient internet accessibility provide lucrative prospects for market participants throughout the forecast period.
Data center construction refers to the development and establishment of physical facilities that are purposefully designed to house and support a range of information technology components. These components may include servers, networking devices, storage systems, and other critical hardware necessary for data storage, processing, and management tasks. Data center construction involves careful planning, design, and implementation to create a controlled and efficient environment that facilitates the reliable operation of these IT systems. It also encompasses layout optimization, cooling mechanisms, power distribution solutions, security protocols, and the ability to accommodate future growth and expansion. Establishing a data center requires meticulous preparation involving storage allocation, site selection, and material choices. This meticulous planning aims to manage and regulate the internal data center environment effectively. The selection of the data center's location is particularly vital, as maintaining a conducive temperature within the facility is imperative.
Get an overview of this study by requesting a free sample
Increasing Data Consumption - The proliferation of digital services, cloud computing, IoT devices, and streaming media has led to exponential data generation and consumption growth. This surge in data necessitates the construction of more data centers to handle and process vast amounts of information.
Rising Trend of Cloud Computing - The shift towards cloud-based services, including IaaS, PaaS, and SaaS, has increased the need for data centers. Cloud providers require robust and scalable infrastructure to support their services, driving the need for new data center construction.
High Capital Costs - Establishing a data center involves substantial upfront land, infrastructure, equipment, and cooling systems investments. These capital costs can deter smaller organizations from entering the market and may lead to financial challenges for those embarking on large-scale data center projects.
High Operational Costs - Beyond initial construction, data centers have ongoing operational costs related to energy consumption, cooling, maintenance, and staffing. These costs can be high and impact the overall profitability of data center operations.
Increasing Edge Data Centers - The rise of edge computing presents an opportunity for constructing smaller data centers closer to end-users, reducing latency and improving performance for real-time applications like IoT and AI. The demand for edge data centers is rising as more devices and applications require immediate processing.
Renewable Energy Integration - Integrating renewable energy sources like wind power and solar into data center designs presents an opportunity to reduce operational costs and carbon footprint. Green energy initiatives are gaining traction, and data centers can significantly support sustainability goals.
Rapid Technological Evolution - The pace of technological advancement often results in challenges related to future-proofing data center infrastructure. Construction companies must ensure their facilities can accommodate changing hardware and software requirements.
Energy Efficiency and Sustainability - Data centers are infamous for their high energy consumption, leading to concerns about carbon emissions and environmental impact. Balancing energy efficiency with operational demands is a continual challenge in data center construction.
The regions analyzed for the market include North America, Europe, South America, Asia Pacific, the Middle East, and Africa. North American region emerged as the most prominent global data center construction market, with a 42.86% market revenue share in 2022.
North America, particularly the United States, has been a hub for technological innovation and the birthplace of many major tech companies. The region's early IT infrastructure adoption and development have contributed to a strong demand for data centers to support various digital services and applications. Additionally, North America has one of the largest and most developed economies globally, providing a fertile ground for the growth of various industries that rely heavily on data centers, such as finance, healthcare, e-commerce, and entertainment. Furthermore, the region's large population and urbanization trends have increased the demand for digital services, driving the need for data centers to process and store the resulting data. The Asia Pacific region is anticipated to experience the fastest market growth in the data center construction industry over the forecast period. Many countries in the Asia Pacific region are undergoing rapid digital transformation, with increasing adoption of cloud computing, e-commerce, IoT, and AI. This surge in digital services and data-driven applications drives the demand for data center infrastructure.
North America Region Data Center Construction Market Share in 2022 - 42.86%
www.thebrainyinsights.com
Check the geographical analysis of this market by requesting a free sample
The infrastructure type segment includes electrical infrastructure, mechanical infrastructure and general infrastructure. The mechanical infrastructure segment accounted for the largest market share of around 36.47% in 2022. Data centers generate significant heat due to the operation of servers and other equipment. Effective cooling systems maintain optimal operating temperatures and prevent equipment from overheating. The mechanical infrastructure, including HVAC (Heating, Ventilation, and Air Conditioning) systems and advanced cooling technologies, is pivotal in managing this heat load. In addition, cooling accounts for a substantial portion of a data center's energy consumption. The mechanical infrastructure is essential for implementing energy-efficient cooling solutions that help minimize operational costs and environmental impact. Innovations like hot/cold aisle containment and liquid cooling contribute to energy savings.
The tier type segment is classified into tier I & II, tier III and tier IV. The tier III segment dominated the market, with a share of around 52.14% in 2022. Tier III data centers are designed with redundant components and systems to ensure high availability. The N+1 redundancy in power and cooling systems minimizes the risk of downtime, making Tier III facilities reliable for businesses that require consistent IT operations. Furthermore, tier III facilities strike a balance between redundancy and cost. While not as complex and costly as Tier IV data centers, Tier III offers sufficient redundancy to protect against single points of failure and unexpected downtime.
The organization size segment is classified into small organization, medium organization and large organization. The large organization segment dominated the market, with a share of around 41.83% in 2022. Large organizations often offer diverse services, including cloud computing, e-commerce, financial services, etc. These services require robust data center infrastructure to deliver high availability and optimal performance. Additionally, due to their extensive operations and complex IT infrastructure, large organizations require substantial data center capacity to manage and process the vast amounts of data generated by their activities. Besides, many large organizations operate globally, necessitating data center facilities strategically located in different regions to ensure efficient data processing, reduce latency, and comply with local regulations.
The end user segment is divided into BFSI, energy, government & defense, healthcare, IT & telecom, and others. The IT & telecom segment dominated the market, with a share of around 40.72% in 2022. The growth of cloud computing within the IT & Telecom sector has led to increased demand for data center facilities to host cloud infrastructure and offer cloud services to customers. Telecom companies require robust data centers to manage their network infrastructure, including routing, switching, and data transmission. Data centers ensure efficient communication and connectivity for their services.
| Attribute | Description |
|---|---|
| Market Size | Revenue (USD Billion) |
| Market size value in 2022 | USD 214.73 Billion |
| Market size value in 2032 | USD 470.07 Billion |
| CAGR (2023 to 2032) | 8.15% |
| Historical data | 2019-2021 |
| Base Year | 2022 |
| Forecast | 2023-2032 |
| Region | The regions analyzed for the market are Asia Pacific, Europe, South America, North America, and Middle East & Africa. Furthermore, the regions are further analyzed at the country level. |
| Segments | Infrastructure Type, Tier Type, Organization Size Channel and End User |
As per The Brainy Insights, the size of the data center construction market was valued at USD 214.73 billion in 2022 to USD 470.07 billion by 2032.
The global data center construction market is growing at a CAGR of 8.15% during the forecast period 2023-2032.
The North American region became the largest market for data center construction.
Increasing data consumption and rising trend of cloud computing are influencing the market's growth.
1. Introduction
1.1. Objectives of the Study
1.2. Market Definition
1.3. Research Scope
1.4. Currency
1.5. Key Target Audience
2. Research Methodology and Assumptions
3. Executive Summary
4. Premium Insights
4.1. Porter’s Five Forces Analysis
4.2. Value Chain Analysis
4.3. Top Investment Pockets
4.3.1. Market Attractiveness Analysis by Infrastructure Type
4.3.2. Market Attractiveness Analysis by Tier Type
4.3.3. Market Attractiveness Analysis by Organization Size
4.3.4. Market Attractiveness Analysis by End User
4.3.5. Market Attractiveness Analysis by Region
4.4. Industry Trends
5. Market Dynamics
5.1. Market Evaluation
5.2. Drivers
5.2.1. Increasing Data Consumption
5.2.2. Rising Trend of Cloud Computing
5.3. Restraints
5.3.1. High Capital Costs
5.3.2. High Operational Costs
5.4. Opportunities
5.4.1. Increasing Edge Data Centers
5.4.2. Renewable Energy Integration
5.5. Challenges
5.5.1. Rapid Technological Evolution
5.5.2. Energy Efficiency and Sustainability
6. Global Data Center Construction Market Analysis and Forecast, By Infrastructure Type
6.1. Segment Overview
6.2. Electrical Infrastructure
6.3. Mechanical Infrastructure
6.4. General Infrastructure
7. Global Data Center Construction Market Analysis and Forecast, By Tier Type
7.1. Segment Overview
7.2. Tier I & II
7.3. Tier III
7.4. Tier IV
8. Global Data Center Construction Market Analysis and Forecast, By Organization Size
8.1. Segment Overview
8.2. Small Organization
8.3. Medium Organization
8.4. Large Organization
9. Global Data Center Construction Market Analysis and Forecast, By End User
9.1. Segment Overview
9.2. BFSI
9.3. Energy
9.4. Government & Defense
9.5. Healthcare
9.6. IT & Telecom
9.7. Others
10. Global Data Center Construction Market Analysis and Forecast, By Regional Analysis
10.1. Segment Overview
10.2. North America
10.2.1. U.S.
10.2.2. Canada
10.2.3. Mexico
10.3. Europe
10.3.1. Germany
10.3.2. France
10.3.3. U.K.
10.3.4. Italy
10.3.5. Spain
10.4. Asia-Pacific
10.4.1. Japan
10.4.2. China
10.4.3. India
10.5. South America
10.5.1. Brazil
10.6. Middle East and Africa
10.6.1. UAE
10.6.2. South Africa
11. Global Data Center Construction Market-Competitive Landscape
11.1. Overview
11.2. Market Share of Key Players in the Data Center Construction Market
11.2.1. Global Company Market Share
11.2.2. North America Company Market Share
11.2.3. Europe Company Market Share
11.2.4. APAC Company Market Share
11.3. Competitive Situations and Trends
11.3.1. Product Launches and Developments
11.3.2. Partnerships, Collaborations, and Agreements
11.3.3. Mergers & Acquisitions
11.3.4. Expansions
12. Company Profiles
12.1. ABB
12.1.1. Business Overview
12.1.2. Company Snapshot
12.1.3. Company Market Share Analysis
12.1.4. Company Product Portfolio
12.1.5. Recent Developments
12.1.6. SWOT Analysis
12.2. Acer Inc.
12.2.1. Business Overview
12.2.2. Company Snapshot
12.2.3. Company Market Share Analysis
12.2.4. Company Product Portfolio
12.2.5. Recent Developments
12.2.6. SWOT Analysis
12.3. AECOM
12.3.1. Business Overview
12.3.2. Company Snapshot
12.3.3. Company Market Share Analysis
12.3.4. Company Product Portfolio
12.3.5. Recent Developments
12.3.6. SWOT Analysis
12.4. Ascenty
12.4.1. Business Overview
12.4.2. Company Snapshot
12.4.3. Company Market Share Analysis
12.4.4. Company Product Portfolio
12.4.5. Recent Developments
12.4.6. SWOT Analysis
12.5. Arup Group Ltd.
12.5.1. Business Overview
12.5.2. Company Snapshot
12.5.3. Company Market Share Analysis
12.5.4. Company Product Portfolio
12.5.5. Recent Developments
12.5.6. SWOT Analysis
12.6. Cisco Systems, Inc.
12.6.1. Business Overview
12.6.2. Company Snapshot
12.6.3. Company Market Share Analysis
12.6.4. Company Product Portfolio
12.6.5. Recent Developments
12.6.6. SWOT Analysis
12.7. CORGAN
12.7.1. Business Overview
12.7.2. Company Snapshot
12.7.3. Company Market Share Analysis
12.7.4. Company Product Portfolio
12.7.5. Recent Developments
12.7.6. SWOT Analysis
12.8. CyrusOne Inc.
12.8.1. Business Overview
12.8.2. Company Snapshot
12.8.3. Company Market Share Analysis
12.8.4. Company Product Portfolio
12.8.5. Recent Developments
12.8.6. SWOT Analysis
12.9. Clune Construction Company, L.P.
12.9.1. Business Overview
12.9.2. Company Snapshot
12.9.3. Company Market Share Analysis
12.9.4. Company Product Portfolio
12.9.5. Recent Developments
12.9.6. SWOT Analysis
12.10. Dell Inc.
12.10.1. Business Overview
12.10.2. Company Snapshot
12.10.3. Company Market Share Analysis
12.10.4. Company Product Portfolio
12.10.5. Recent Developments
12.10.6. SWOT Analysis
12.11. Digital Realty Trust Inc.
12.11.1. Business Overview
12.11.2. Company Snapshot
12.11.3. Company Market Share Analysis
12.11.4. Company Product Portfolio
12.11.5. Recent Developments
12.11.6. SWOT Analysis
12.12. DPR Construction Inc.
12.12.1. Business Overview
12.12.2. Company Snapshot
12.12.3. Company Market Share Analysis
12.12.4. Company Product Portfolio
12.12.5. Recent Developments
12.12.6. SWOT Analysis
12.13. Equinix, Inc.
12.13.1. Business Overview
12.13.2. Company Snapshot
12.13.3. Company Market Share Analysis
12.13.4. Company Product Portfolio
12.13.5. Recent Developments
12.13.6. SWOT Analysis
12.14. Fujitsu
12.14.1. Business Overview
12.14.2. Company Snapshot
12.14.3. Company Market Share Analysis
12.14.4. Company Product Portfolio
12.14.5. Recent Developments
12.14.6. SWOT Analysis
12.15. Fortis Construction Inc.
12.15.1. Business Overview
12.15.2. Company Snapshot
12.15.3. Company Market Share Analysis
12.15.4. Company Product Portfolio
12.15.5. Recent Developments
12.15.6. SWOT Analysis
12.16. Gensler
12.16.1. Business Overview
12.16.2. Company Snapshot
12.16.3. Company Market Share Analysis
12.16.4. Company Product Portfolio
12.16.5. Recent Developments
12.16.6. SWOT Analysis
12.17. Gilbane Building Company Inc.
12.17.1. Business Overview
12.17.2. Company Snapshot
12.17.3. Company Market Share Analysis
12.17.4. Company Product Portfolio
12.17.5. Recent Developments
12.17.6. SWOT Analysis
12.18. Hitachi, Ltd.
12.18.1. Business Overview
12.18.2. Company Snapshot
12.18.3. Company Market Share Analysis
12.18.4. Company Product Portfolio
12.18.5. Recent Developments
12.18.6. SWOT Analysis
12.19. HostDime Global Corp.
12.19.1. Business Overview
12.19.2. Company Snapshot
12.19.3. Company Market Share Analysis
12.19.4. Company Product Portfolio
12.19.5. Recent Developments
12.19.6. SWOT Analysis
12.20. Hewlett Packard Enterprise Development LP
12.20.1. Business Overview
12.20.2. Company Snapshot
12.20.3. Company Market Share Analysis
12.20.4. Company Product Portfolio
12.20.5. Recent Developments
12.20.6. SWOT Analysis
12.21. Huawei Technologies Co., Ltd.
12.21.1. Business Overview
12.21.2. Company Snapshot
12.21.3. Company Market Share Analysis
12.21.4. Company Product Portfolio
12.21.5. Recent Developments
12.21.6. SWOT Analysis
12.22. Hensel Phelps Construction Co. Inc.
12.22.1. Business Overview
12.22.2. Company Snapshot
12.22.3. Company Market Share Analysis
12.22.4. Company Product Portfolio
12.22.5. Recent Developments
12.22.6. SWOT Analysis
12.23. HITT Contracting Inc.
12.23.1. Business Overview
12.23.2. Company Snapshot
12.23.3. Company Market Share Analysis
12.23.4. Company Product Portfolio
12.23.5. Recent Developments
12.23.6. SWOT Analysis
12.24. IBM
12.24.1. Business Overview
12.24.2. Company Snapshot
12.24.3. Company Market Share Analysis
12.24.4. Company Product Portfolio
12.24.5. Recent Developments
12.24.6. SWOT Analysis
12.25. Inspur
12.25.1. Business Overview
12.25.2. Company Snapshot
12.25.3. Company Market Share Analysis
12.25.4. Company Product Portfolio
12.25.5. Recent Developments
12.25.6. SWOT Analysis
12.26. IPXON Networks
12.26.1. Business Overview
12.26.2. Company Snapshot
12.26.3. Company Market Share Analysis
12.26.4. Company Product Portfolio
12.26.5. Recent Developments
12.26.6. SWOT Analysis
12.27. JE Dunn Construction Group Inc.
12.27.1. Business Overview
12.27.2. Company Snapshot
12.27.3. Company Market Share Analysis
12.27.4. Company Product Portfolio
12.27.5. Recent Developments
12.27.6. SWOT Analysis
12.28. KIO Networks
12.28.1. Business Overview
12.28.2. Company Snapshot
12.28.3. Company Market Share Analysis
12.28.4. Company Product Portfolio
12.28.5. Recent Developments
12.28.6. SWOT Analysis
12.29. Lenovo
12.29.1. Business Overview
12.29.2. Company Snapshot
12.29.3. Company Market Share Analysis
12.29.4. Company Product Portfolio
12.29.5. Recent Developments
12.29.6. SWOT Analysis
12.30. Legrand SA
12.30.1. Business Overview
12.30.2. Company Snapshot
12.30.3. Company Market Share Analysis
12.30.4. Company Product Portfolio
12.30.5. Recent Developments
12.30.6. SWOT Analysis
12.31. MA Mortenson Company Inc.
12.31.1. Business Overview
12.31.2. Company Snapshot
12.31.3. Company Market Share Analysis
12.31.4. Company Product Portfolio
12.31.5. Recent Developments
12.31.6. SWOT Analysis
12.32. Nabholz Corporation
12.32.1. Business Overview
12.32.2. Company Snapshot
12.32.3. Company Market Share Analysis
12.32.4. Company Product Portfolio
12.32.5. Recent Developments
12.32.6. SWOT Analysis
12.33. NTT Global Data Centers
12.33.1. Business Overview
12.33.2. Company Snapshot
12.33.3. Company Market Share Analysis
12.33.4. Company Product Portfolio
12.33.5. Recent Developments
12.33.6. SWOT Analysis
12.34. Oracle
12.34.1. Business Overview
12.34.2. Company Snapshot
12.34.3. Company Market Share Analysis
12.34.4. Company Product Portfolio
12.34.5. Recent Developments
12.34.6. SWOT Analysis
12.35. Schneider Electric
12.35.1. Business Overview
12.35.2. Company Snapshot
12.35.3. Company Market Share Analysis
12.35.4. Company Product Portfolio
12.35.5. Recent Developments
12.35.6. SWOT Analysis
12.36. SAS Institute Inc.
12.36.1. Business Overview
12.36.2. Company Snapshot
12.36.3. Company Market Share Analysis
12.36.4. Company Product Portfolio
12.36.5. Recent Developments
12.36.6. SWOT Analysis
12.37. Turner Construction
12.37.1. Business Overview
12.37.2. Company Snapshot
12.37.3. Company Market Share Analysis
12.37.4. Company Product Portfolio
12.37.5. Recent Developments
12.37.6. SWOT Analysis
12.38. The Walsh Group
12.38.1. Business Overview
12.38.2. Company Snapshot
12.38.3. Company Market Share Analysis
12.38.4. Company Product Portfolio
12.38.5. Recent Developments
12.38.6. SWOT Analysis
12.39. Vertiv Group Corp.
12.39.1. Business Overview
12.39.2. Company Snapshot
12.39.3. Company Market Share Analysis
12.39.4. Company Product Portfolio
12.39.5. Recent Developments
12.39.6. SWOT Analysis
List of Table
1. Global Data Center Construction Market, By Infrastructure Type, 2019-2032 (USD Billion)
2. Global Electrical Infrastructure, Data Center Construction Market, By Region, 2019-2032 (USD Billion)
3. Global Mechanical Infrastructure, Data Center Construction Market, By Region, 2019-2032 (USD Billion)
4. Global General Infrastructure, Data Center Construction Market, By Region, 2019-2032 (USD Billion)
5. Global Data Center Construction Market, By Tier Type, 2019-2032 (USD Billion)
6. Global Tier I & II Data Center Construction Market, By Region, 2019-2032 (USD Billion)
7. Global Tier III Data Center Construction Market, By Region, 2019-2032 (USD Billion)
8. Global Tier IV Data Center Construction Market, By Region, 2019-2032 (USD Billion)
9. Global Data Center Construction Market, By Organization Size, 2019-2032 (USD Billion)
10. Global Small Organization Data Center Construction Market, By Region, 2019-2032 (USD Billion)
11. Global Medium Organization Data Center Construction Market, By Region, 2019-2032 (USD Billion)
12. Global Large Organization Data Center Construction Market, By Region, 2019-2032 (USD Billion)
13. Global Data Center Construction Market, By End User, 2019-2032 (USD Billion)
14. Global BFSI Data Center Construction Market, By Region, 2019-2032 (USD Billion)
15. Global Energy Data Center Construction Market, By Region, 2019-2032 (USD Billion)
16. Global Government & Defense Data Center Construction Market, By Region, 2019-2032 (USD Billion)
17. Global Healthcare Data Center Construction Market, By Region, 2019-2032 (USD Billion)
18. Global IT & Telecom Data Center Construction Market, By Region, 2019-2032 (USD Billion)
19. Global Others Data Center Construction Market, By Region, 2019-2032 (USD Billion)
20. Global Data Center Construction Market, By Region, 2019-2032 (USD Billion)
21. North America Data Center Construction Market, By Infrastructure Type, 2019-2032 (USD Billion)
22. North America Data Center Construction Market, By Tier Type, 2019-2032 (USD Billion)
23. North America Data Center Construction Market, By Organization Size, 2019-2032 (USD Billion)
24. North America Data Center Construction Market, By End User, 2019-2032 (USD Billion)
25. U.S. Data Center Construction Market, By Infrastructure Type, 2019-2032 (USD Billion)
26. U.S. Data Center Construction Market, By Tier Type, 2019-2032 (USD Billion)
27. U.S. Data Center Construction Market, By Organization Size, 2019-2032 (USD Billion)
28. U.S. Data Center Construction Market, By End User, 2019-2032 (USD Billion)
29. Canada Data Center Construction Market, By Infrastructure Type, 2019-2032 (USD Billion)
30. Canada Data Center Construction Market, By Tier Type, 2019-2032 (USD Billion)
31. Canada Data Center Construction Market, By Organization Size, 2019-2032 (USD Billion)
32. Canada Data Center Construction Market, By End User, 2019-2032 (USD Billion)
33. Mexico Data Center Construction Market, By Infrastructure Type, 2019-2032 (USD Billion)
34. Mexico Data Center Construction Market, By Tier Type, 2019-2032 (USD Billion)
35. Mexico Data Center Construction Market, By Organization Size, 2019-2032 (USD Billion)
36. Mexico Data Center Construction Market, By End User, 2019-2032 (USD Billion)
37. Europe Data Center Construction Market, By Infrastructure Type, 2019-2032 (USD Billion)
38. Europe Data Center Construction Market, By Tier Type, 2019-2032 (USD Billion)
39. Europe Data Center Construction Market, By Organization Size, 2019-2032 (USD Billion)
40. Europe Data Center Construction Market, By End User, 2019-2032 (USD Billion)
41. Germany Data Center Construction Market, By Infrastructure Type, 2019-2032 (USD Billion)
42. Germany Data Center Construction Market, By Tier Type, 2019-2032 (USD Billion)
43. Germany Data Center Construction Market, By Organization Size, 2019-2032 (USD Billion)
44. Germany Data Center Construction Market, By End User, 2019-2032 (USD Billion)
45. France Data Center Construction Market, By Infrastructure Type, 2019-2032 (USD Billion)
46. France Data Center Construction Market, By Tier Type, 2019-2032 (USD Billion)
47. France Data Center Construction Market, By Organization Size, 2019-2032 (USD Billion)
48. France Data Center Construction Market, By End User, 2019-2032 (USD Billion)
49. U.K. Data Center Construction Market, By Infrastructure Type, 2019-2032 (USD Billion)
50. U.K. Data Center Construction Market, By Tier Type, 2019-2032 (USD Billion)
51. U.K. Data Center Construction Market, By Organization Size, 2019-2032 (USD Billion)
52. U.K. Data Center Construction Market, By End User, 2019-2032 (USD Billion)
53. Italy Data Center Construction Market, By Infrastructure Type, 2019-2032 (USD Billion)
54. Italy Data Center Construction Market, By Tier Type, 2019-2032 (USD Billion)
55. Italy Data Center Construction Market, By Organization Size, 2019-2032 (USD Billion)
56. Italy Data Center Construction Market, By End User, 2019-2032 (USD Billion)
57. Spain Data Center Construction Market, By Infrastructure Type, 2019-2032 (USD Billion)
58. Spain Data Center Construction Market, By Tier Type, 2019-2032 (USD Billion)
59. Spain Data Center Construction Market, By Organization Size, 2019-2032 (USD Billion)
60. Spain Data Center Construction Market, By End User, 2019-2032 (USD Billion)
61. Asia Pacific Data Center Construction Market, By Infrastructure Type, 2019-2032 (USD Billion)
62. Asia Pacific Data Center Construction Market, By Tier Type, 2019-2032 (USD Billion)
63. Asia Pacific Data Center Construction Market, By Organization Size, 2019-2032 (USD Billion)
64. Asia Pacific Data Center Construction Market, By End User, 2019-2032 (USD Billion)
65. Japan Data Center Construction Market, By Infrastructure Type, 2019-2032 (USD Billion)
66. Japan Data Center Construction Market, By Tier Type, 2019-2032 (USD Billion)
67. Japan Data Center Construction Market, By Organization Size, 2019-2032 (USD Billion)
68. Japan Data Center Construction Market, By End User, 2019-2032 (USD Billion)
69. China Data Center Construction Market, By Infrastructure Type, 2019-2032 (USD Billion)
70. China Data Center Construction Market, By Tier Type, 2019-2032 (USD Billion)
71. China Data Center Construction Market, By Organization Size, 2019-2032 (USD Billion)
72. China Data Center Construction Market, By End User, 2019-2032 (USD Billion)
73. India Data Center Construction Market, By Infrastructure Type, 2019-2032 (USD Billion)
74. India Data Center Construction Market, By Tier Type, 2019-2032 (USD Billion)
75. India Data Center Construction Market, By Organization Size, 2019-2032 (USD Billion)
76. India Data Center Construction Market, By End User, 2019-2032 (USD Billion)
77. South America Data Center Construction Market, By Infrastructure Type, 2019-2032 (USD Billion)
78. South America Data Center Construction Market, By Tier Type, 2019-2032 (USD Billion)
79. South America Data Center Construction Market, By Organization Size, 2019-2032 (USD Billion)
80. South America Data Center Construction Market, By End User, 2019-2032 (USD Billion)
81. Brazil Data Center Construction Market, By Infrastructure Type, 2019-2032 (USD Billion)
82. Brazil Data Center Construction Market, By Tier Type, 2019-2032 (USD Billion)
83. Brazil Data Center Construction Market, By Organization Size, 2019-2032 (USD Billion)
84. Brazil Data Center Construction Market, By End User, 2019-2032 (USD Billion)
85. Middle East and Africa Data Center Construction Market, By Infrastructure Type, 2019-2032 (USD Billion)
86. Middle East and Africa Data Center Construction Market, By Tier Type, 2019-2032 (USD Billion)
87. Middle East and Africa Data Center Construction Market, By Organization Size, 2019-2032 (USD Billion)
88. Middle East and Africa Data Center Construction Market, By End User, 2019-2032 (USD Billion)
89. UAE Data Center Construction Market, By Infrastructure Type, 2019-2032 (USD Billion)
90. UAE Data Center Construction Market, By Tier Type, 2019-2032 (USD Billion)
91. UAE Data Center Construction Market, By Organization Size, 2019-2032 (USD Billion)
92. UAE Data Center Construction Market, By End User, 2019-2032 (USD Billion)
93. South Africa Data Center Construction Market, By Infrastructure Type, 2019-2032 (USD Billion)
94. South Africa Data Center Construction Market, By Tier Type, 2019-2032 (USD Billion)
95. South Africa Data Center Construction Market, By Organization Size, 2019-2032 (USD Billion)
96. South Africa Data Center Construction Market, By End User, 2019-2032 (USD Billion)
List of Figures
1. Global Data Center Construction Market Segmentation
2. Data Center Construction Market: Research Methodology
3. Market Size Estimation Methodology: Bottom-Up Approach
4. Market Size Estimation Methodology: Top-Down Approach
5. Data Triangulation
6. Porter’s Five Forces Analysis
7. Value Chain Analysis
8. Global Data Center Construction Market Attractiveness Analysis by Infrastructure Type
9. Global Data Center Construction Market Attractiveness Analysis by Tier Type
10. Global Data Center Construction Market Attractiveness Analysis by Organization Size
11. Global Data Center Construction Market Attractiveness Analysis by End User
12. Global Data Center Construction Market Attractiveness Analysis by Region
13. Global Data Center Construction Market: Dynamics
14. Global Data Center Construction Market Share by Infrastructure Type (2023 & 2032)
15. Global Data Center Construction Market Share by Tier Type (2023 & 2032)
16. Global Data Center Construction Market Share by Organization Size (2023 & 2032)
17. Global Data Center Construction Market Share by End User (2023 & 2032)
18. Global Data Center Construction Market Share by Regions (2023 & 2032)
19. Global Data Center Construction Market Share by Company (2022)
This study forecasts revenue at global, regional, and country levels from 2019 to 2032. The Brainy Insights has segmented the global data center construction market based on below-mentioned segments:
Global Data Center Construction Market by Infrastructure Type:
Global Data Center Construction Market by Tier Type:
Global Data Center Construction Market by Organization Size:
Global Data Center Construction Market by End User:
Global Data Center Construction Market by Region:
Research has its special purpose to undertake marketing efficiently. In this competitive scenario, businesses need information across all industry verticals; the information about customer wants, market demand, competition, industry trends, distribution channels etc. This information needs to be updated regularly because businesses operate in a dynamic environment. Our organization, The Brainy Insights incorporates scientific and systematic research procedures in order to get proper market insights and industry analysis for overall business success. The analysis consists of studying the market from a miniscule level wherein we implement statistical tools which helps us in examining the data with accuracy and precision.
Our research reports feature both; quantitative and qualitative aspects for any market. Qualitative information for any market research process are fundamental because they reveal the customer needs and wants, usage and consumption for any product/service related to a specific industry. This in turn aids the marketers/investors in knowing certain perceptions of the customers. Qualitative research can enlighten about the different product concepts and designs along with unique service offering that in turn, helps define marketing problems and generate opportunities. On the other hand, quantitative research engages with the data collection process through interviews, e-mail interactions, surveys and pilot studies. Quantitative aspects for the market research are useful to validate the hypotheses generated during qualitative research method, explore empirical patterns in the data with the help of statistical tools, and finally make the market estimations.
The Brainy Insights offers comprehensive research and analysis, based on a wide assortment of factual insights gained through interviews with CXOs and global experts and secondary data from reliable sources. Our analysts and industry specialist assume vital roles in building up statistical tools and analysis models, which are used to analyse the data and arrive at accurate insights with exceedingly informative research discoveries. The data provided by our organization have proven precious to a diverse range of companies, facilitating them to address issues such as determining which products/services are the most appealing, whether or not customers use the product in the manner anticipated, the purchasing intentions of the market and many others.
Our research methodology encompasses an idyllic combination of primary and secondary initiatives. Key phases involved in this process are listed below:

The phase involves the gathering and collecting of market data and its related information with the help of different sources & research procedures.

The data procurement stage involves in data gathering and collecting through various data sources.
This stage involves in extensive research. These data sources includes:
Purchased Database: Purchased databases play a crucial role in estimating the market sizes irrespective of the domain. Our purchased database includes:
Primary Research: The Brainy Insights interacts with leading companies and experts of the concerned domain to develop the analyst team’s market understanding and expertise. It improves and substantiates every single data presented in the market reports. Primary research mainly involves in telephonic interviews, E-mail interactions and face-to-face interviews with the raw material providers, manufacturers/producers, distributors, & independent consultants. The interviews that we conduct provides valuable data on market size and industry growth trends prevailing in the market. Our organization also conducts surveys with the various industry experts in order to gain overall insights of the industry/market. For instance, in healthcare industry we conduct surveys with the pharmacists, doctors, surgeons and nurses in order to gain insights and key information of a medical product/device/equipment which the customers are going to usage. Surveys are conducted in the form of questionnaire designed by our own analyst team. Surveys plays an important role in primary research because surveys helps us to identify the key target audiences of the market. Additionally, surveys helps to identify the key target audience engaged with the market. Our survey team conducts the survey by targeting the key audience, thus gaining insights from them. Based on the perspectives of the customers, this information is utilized to formulate market strategies. Moreover, market surveys helps us to understand the current competitive situation of the industry. To be precise, our survey process typically involve with the 360 analysis of the market. This analytical process begins by identifying the prospective customers for a product or service related to the market/industry to obtain data on how a product/service could fit into customers’ lives.

Secondary Research: The secondary data sources includes information published by the on-profit organizations such as World bank, WHO, company fillings, investor presentations, annual reports, national government documents, statistical databases, blogs, articles, white papers and others. From the annual report, we analyse a company’s revenue to understand the key segment and market share of that organization in a particular region. We analyse the company websites and adopt the product mapping technique which is important for deriving the segment revenue. In the product mapping method, we select and categorize the products offered by the companies catering to domain specific market, deduce the product revenue for each of the companies so as to get overall estimation of the market size. We also source data and analyses trends based on information received from supply side and demand side intermediaries in the value chain. The supply side denotes the data gathered from supplier, distributor, wholesaler and the demand side illustrates the data gathered from the end customers for respective market domain.

The supply side for a domain specific market is analysed by:
The demand side for the market is estimated through:
In-house Library: Apart from these third-party sources, we have our in-house library of qualitative and quantitative information. Our in-house database includes market data for various industry and domains. These data are updated on regular basis as per the changing market scenario. Our library includes, historic databases, internal audit reports and archives.
Sometimes there are instances where there is no metadata or raw data available for any domain specific market. For those cases, we use our expertise to forecast and estimate the market size in order to generate comprehensive data sets. Our analyst team adopt a robust research technique in order to produce the estimates:
Data Synthesis: This stage involves the analysis & mapping of all the information obtained from the previous step. It also involves in scrutinizing the data for any discrepancy observed while data gathering related to the market. The data is collected with consideration to the heterogeneity of sources. Robust scientific techniques are in place for synthesizing disparate data sets and provide the essential contextual information that can orient market strategies. The Brainy Insights has extensive experience in data synthesis where the data passes through various stages:


Market Deduction & Formulation: The final stage comprises of assigning data points at appropriate market spaces so as to deduce feasible conclusions. Analyst perspective & subject matter expert based holistic form of market sizing coupled with industry analysis also plays a crucial role in this stage.
This stage involves in finalization of the market size and numbers that we have collected from data integration step. With data interpolation, it is made sure that there is no gap in the market data. Successful trend analysis is done by our analysts using extrapolation techniques, which provide the best possible forecasts for the market.
Data Validation & Market Feedback: Validation is the most important step in the process. Validation & re-validation via an intricately designed process helps us finalize data-points to be used for final calculations.

The Brainy Insights interacts with leading companies and experts of the concerned domain to develop the analyst team’s market understanding and expertise. It improves and substantiates every single data presented in the market reports. The data validation interview and discussion panels are typically composed of the most experienced industry members. The participants include, however, are not limited to:
Moreover, we always validate our data and findings through primary respondents from all the major regions we are working on.


Free Customization
Fortune 500 Clients
Free Yearly Update On Purchase Of Multi/Corporate License
Companies Served Till Date