- +1-315-215-1633
- sales@thebrainyinsights.com

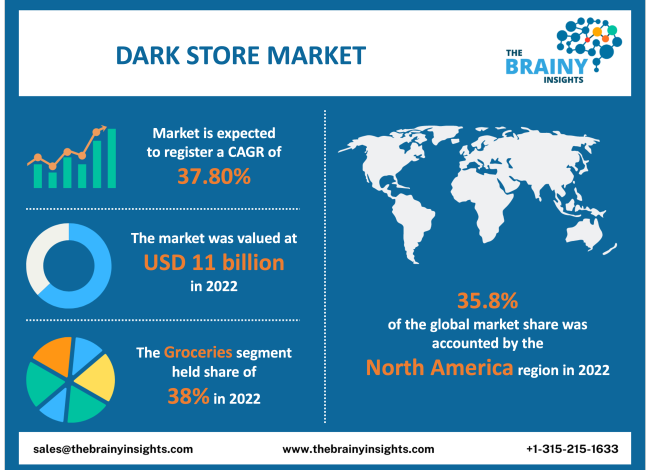
The global dark store market was valued at USD 11 billion in 2022 and growing at a CAGR of 37.80% from 2023 to 2032. The market is expected to reach USD 271.5 billion by 2032. The latest companies setting their feet as an extension of more famous online shopping brands are pushing the need for dark stores. The latest and cutting-edge delivery tracking systems make the procedure faster, more reliable, and more accessible for the end user to get his package delivered. The aged population and inactive lifestyle have increased online orders instead of store visits. Therefore, eventually pushed the adoption of the dark store concept. Covid-19 has also raised the demand for a storage space that can fulfil online grocery, logistics, store storage, and management requirements.
The dark store is a brick-and-mortar store that has been repurposed to fulfil online orders in the short or long run, a recent retail business model that began attaining traction at the start of Covid-19. With physical stores closed and so much shopping shifting to the web, brick-and-mortar locations required a way to move the inventory sitting on their closed shelves and compete with digital counterparts. Their response was to position some brick-and-mortar locations as mini fulfilment depots, where goods could be picked up and delivered to customers who had initially purchased them online. Dark stores are planned to make it simple for online shoppers to accept the goods they buy. Some are set up with aisles and shelves, just like a regular store, but without any promotional signage or displays. Employees known as pickers cruise the aisles, gathering items to fulfil customer orders. Other dark stores look more like warehouses and may be automated to varying degrees. Robots may be used to make and prepare orders, or the stores may use independent carts to gather items for packers, who then ready the delivery charges. Some stores employ a hybrid or ‘semi-dark’ approach. At these outlets, shoppers can pick up their online orders and roam the aisles to select other items. Some dark stores operate around the clock, packing orders overnight and refilling stock in the afternoons. Customer pick-ups and deliveries take place during traditional daytime and evening shopping hours. The need for home delivery raised drastically during the covid-19, and it works very well for dark stores. Home delivery means fast and suitable contactless delivery and is ideal for groceries and other necessities.
Get an overview of this study by requesting a free sample
In September 2022: Intacart acquired Rosie to implement and use its technology in locally operated grocery spaces, expanding the customer base and distribution channels.
In June 2022: Naturepro presented same-day delivery across India and opened ZFW dark stores. Both brands have partnered to promote sustainable and affordable products.
In August 2022: Coca-Cola and Grab work together to promote digitalization and growth in Southeast Asia.
Helps in quick shopping- Dark Stores delivers the convenience of online shopping with the advantage of fast delivery of products. It also helps maintain the safety and social distancing measures during the coronavirus pandemic. That is why dark stores have created a space for fast, contact-free shopping. Dark Stores allow customers to buy from a brick-and-mortar without even entering it.
Manage inventory control- Dark Store also helps to manage inventory control in the same geographic region. As these dark stores are customer-free warehouses, more suitable inventory control can be managed for larger order volumes.
Perishability is a problem on a large scale- Grocery store products have various expiration dates, such as yoghurt, pulses, and fresh spinach. And they’re all supposed to be distributed in their perfect conditions simultaneously. Crackers must not break, liquids must not leak, and containers must stay airtight. It’s not easy to do this on a big scale.
A better view of stock levels- Dark stores are much easier to control at inventory levels than traditional warehouses as they are much smaller. Many dark retailers already have inventory tracking software to help them keep track of stock levels in real time. The technique will also help retailers determine whether they have too much inventory, called deadstock, or insufficient, which can result in stockouts. The person needs to confirm that they still have a suitable degree of merchandise by simplifying the inventory management process.
The regions analyzed for the market include North America, Europe, South America, Asia Pacific, the Middle East, and Africa. North America emerged as the largest market for the global dark store market, with a 35.8% share of the market revenue in 2022.
North America region dominated the global dark store market in 2022, with the biggest market in the region. In the last few years, big cities across the United States, as the pandemic, switched customer focus from offline to ordering products via an online platform. The companies offer delivery in 10 to 30 minutes, from candy and alcoholic beverages to coffee filters and batteries. The speed that sets them apart from regular grocery delivery apps like Fresh Direct and Instacart is achieved by opening dark stores in their communities.
North America Region Dark Store Market Share in 2022 - 35.8%
www.thebrainyinsights.com
Check the geographical analysis of this market by requesting a free sample
The category segment is divided into meat, dairy, and groceries. The groceries segment dominated the market, with a market share of around 38% in 2022. The most suitable method to purchase groceries is online. The dark store delivers a wide variety of foodstuffs that can be delivered to the consumer’s doorstep. A variety of foods can be provided at one delivery platform. The groceries can be of various forms, like non-vegetarians, vegetarians, and vegans. Dairy supplies are restricted due to the demand for vegan products.
The age group segment is divided into the elderly, children, and adults. The adults segment dominated the market, with a market share of around 37% in 2022. As per the data collected by Kesari Mahratta Trust, it was found that most of the respondents, approximately 42%, were between the ages of 31-40.
The distribution channel segment is divided into in-store pickup, curbside pickup, and home delivery. The curbside pickup segment dominated the market, with a market share of around 40% in 2022. Consumers will pick up their orders readily at the curbside. It usually consists of assigned parking areas where a retailer employee can carry the order out to the consumer without requiring them to exit their vehicle. Customers will be protected not only during the covid-19, but it will also be suitable.
| Attribute | Description |
|---|---|
| Market Size | Revenue (USD Billion), Volume (Units) |
| Market size value in 2022 | USD 11 Billion |
| Market size value in 2032 | USD 271.5 Billion |
| CAGR (2023 to 2032) | 37.80% |
| Historical data | 2019-2021 |
| Base Year | 2022 |
| Forecast | 2023-2032 |
| Regional Segments | The regions analyzed for the market are Asia Pacific, Europe, South America, North America, and Middle East & Africa. Furthermore, the regions are further analyzed at the country level. |
| Segments | Category, Age Group, Distribution Channel |
As per The Brainy Insights, the size of the dark store market was valued at USD 11 billion in 2022 to USD 271.5 billion by 2032.
Global dark store market is growing at a CAGR of 37.80% during the forecast period 2023-2032.
North America region emerged as the largest market for the dark store market.
The driving factor for the market is it helps in quick shopping.
1. Introduction
1.1. Objectives of the Study
1.2. Market Definition
1.3. Research Scope
1.4. Currency
1.5. Key Target Audience
2. Research Methodology and Assumptions
3. Executive Summary
4. Premium Insights
4.1. Porter’s Five Forces Analysis
4.2. Value Chain Analysis
4.3. Top Investment Pockets
4.3.1. Market Attractiveness Analysis by Category
4.3.2. Market Attractiveness Analysis by Age Group
4.3.3. Market Attractiveness Analysis by Distribution Channel
4.3.4. Market Attractiveness Analysis by Region
4.4. Industry Trends
5. Market Dynamics
5.1. Market Evaluation
5.2. Drivers
5.2.1. Helps in quick shopping
5.2.2. Manage inventory control
5.3. Restraints
5.3.1. The perishability is a problem in large scale
5.4. Opportunities
5.4.1. A better view of stock levels are pushing market growth
6. Global Dark Store Market Analysis and Forecast, By Category:
6.1. Segment Overview
6.2. Meat
6.3. Dairy
6.4. Groceries
7. Global Dark Store Market Analysis and Forecast, By Age Group
7.1. Segment Overview
7.2. Elderly
7.3. Children
7.4. Adults
8. Global Dark Store Market Analysis and Forecast, By Distribution Channel
8.1. Segment Overview
8.2. In-Store Pickup
8.3. Curbside Pickup
8.4. Home Delivery
9. Global Dark Store Market Analysis and Forecast, By Regional Analysis
9.1. Segment Overview
9.2. North America
9.2.1. U.S.
9.2.2. Canada
9.2.3. Mexico
9.3. Europe
9.3.1. Germany
9.3.2. France
9.3.3. U.K.
9.3.4. Italy
9.3.5. Spain
9.4. Asia-Pacific
9.4.1. Japan
9.4.2. China
9.4.3. India
9.5. South America
9.5.1. Brazil
9.6. Middle East and Africa
9.6.1. UAE
9.6.2. South Africa
10. Global Dark Store Market-Competitive Landscape
10.1. Overview
10.2. Market Share of Key Players in the Dark Store Market
10.2.1. Global Company Market Share
10.2.2. North America Company Market Share
10.2.3. Europe Company Market Share
10.2.4. APAC Company Market Share
10.3. Competitive Situations and Trends
10.3.1. Product Launches and Developments
10.3.2. Partnerships, Collaborations, and Agreements
10.3.3. Mergers & Acquisitions
10.3.4. Expansions
11. Company Profiles
11.1. Amazon.com, Inc
11.1.1. Business Overview
11.1.2. Company Snapshot
11.1.3. Company Market Share Analysis
11.1.4. Company Product Portfolio
11.1.5. Recent Developments
11.1.6. SWOT Analysis
11.2. Auchan.
11.2.1. Business Overview
11.2.2. Company Snapshot
11.2.3. Company Market Share Analysis
11.2.4. Company Product Portfolio
11.2.5. Recent Developments
11.2.6. SWOT Analysis
11.3. Dunzo Daily
11.3.1. Business Overview
11.3.2. Company Snapshot
11.3.3. Company Market Share Analysis
11.3.4. Company Product Portfolio
11.3.5. Recent Developments
11.3.6. SWOT Analysis
11.4. Flipkart.
11.4.1. Business Overview
11.4.2. Company Snapshot
11.4.3. Company Market Share Analysis
11.4.4. Company Product Portfolio
11.4.5. Recent Developments
11.4.6. SWOT Analysis
11.5. Instacart
11.5.1. Business Overview
11.5.2. Company Snapshot
11.5.3. Company Market Share Analysis
11.5.4. Company Product Portfolio
11.5.5. Recent Developments
11.5.6. SWOT Analysis
11.6. Ola Foods
11.6.1. Business Overview
11.6.2. Company Snapshot
11.6.3. Company Market Share Analysis
11.6.4. Company Product Portfolio
11.6.5. Recent Developments
11.6.6. SWOT Analysis
11.7. Supermarket Grocery Supplies Pvt Ltd.
11.7.1. Business Overview
11.7.2. Company Snapshot
11.7.3. Company Market Share Analysis
11.7.4. Company Product Portfolio
11.7.5. Recent Developments
11.7.6. SWOT Analysis
11.8. Swiggy
11.8.1. Business Overview
11.8.2. Company Snapshot
11.8.3. Company Market Share Analysis
11.8.4. Company Product Portfolio
11.8.5. Recent Developments
11.8.6. SWOT Analysis
11.9. Target Brands, Inc
11.9.1. Business Overview
11.9.2. Company Snapshot
11.9.3. Company Market Share Analysis
11.9.4. Company Product Portfolio
11.9.5. Recent Developments
11.9.6. SWOT Analysis
11.10. Uber
11.10.1. Business Overview
11.10.2. Company Snapshot
11.10.3. Company Market Share Analysis
11.10.4. Company Product Portfolio
11.10.5. Recent Developments
11.10.6. SWOT Analysis
11.11. Walmart, Inc.
11.11.1. Business Overview
11.11.2. Company Snapshot
11.11.3. Company Market Share Analysis
11.11.4. Company Product Portfolio
11.11.5. Recent Developments
11.11.6. SWOT Analysis
11.12. Wolt.
11.12.1. Business Overview
11.12.2. Company Snapshot
11.12.3. Company Market Share Analysis
11.12.4. Company Product Portfolio
11.12.5. Recent Developments
11.12.6. SWOT Analysis
11.13. Grab
11.13.1. Business Overview
11.13.2. Company Snapshot
11.13.3. Company Market Share Analysis
11.13.4. Company Product Portfolio
11.13.5. Recent Developments
11.13.6. SWOT Analysis
List of Table
1. Global Dark Store Market, By Category, 2019-2032 (USD Billion)
2. Global Meat Dark Store Market, By Region, 2019-2032 (USD Billion)
3. Global Dairy Dark Store Market, By Region, 2019-2032 (USD Billion)
4. Global Groceries Dark Store Market, By Region, 2019-2032 (USD Billion)
5. Global Dark Store Market, By Age Group, 2019-2032 (USD Billion)
6. Global Elderly Dark Store Market, By Region, 2019-2032 (USD Billion)
7. Global Children Dark Store Market, By Region, 2019-2032 (USD Billion)
8. Global Adults Dark Store Market, By Region, 2019-2032 (USD Billion)
9. Global Dark Store Market, By Distribution Channel, 2019-2032 (USD Billion)
10. Global In-Store Pickup Dark Store Market, By Region, 2019-2032 (USD Billion)
11. Global Curbside Pickup Dark Store Market, By Region, 2019-2032 (USD Billion)
12. Global Home Delivery Dark Store Market, By Region, 2019-2032 (USD Billion)
13. North America Dark Store Market, By Category, 2019-2032 (USD Billion)
14. North America Dark Store Market, By Age Group, 2019-2032 (USD Billion)
15. North America Dark Store Market, By Distribution Channel, 2019-2032 (USD Billion)
16. U.S. Dark Store Market, By Category, 2019-2032 (USD Billion)
17. U.S. Dark Store Market, By Age Group, 2019-2032 (USD Billion)
18. U.S. Dark Store Market, By Distribution Channel, 2019-2032 (USD Billion)
19. Canada Dark Store Market, By Category, 2019-2032 (USD Billion)
20. Canada Dark Store Market, By Age Group, 2019-2032 (USD Billion)
21. Canada Dark Store Market, By Distribution Channel, 2019-2032 (USD Billion)
22. Mexico Dark Store Market, By Category, 2019-2032 (USD Billion)
23. Mexico Dark Store Market, By Age Group, 2019-2032 (USD Billion)
24. Mexico Dark Store Market, By Distribution Channel, 2019-2032 (USD Billion)
25. Europe Dark Store Market, By Category, 2019-2032 (USD Billion)
26. Europe Dark Store Market, By Age Group, 2019-2032 (USD Billion)
27. Europe Dark Store Market, By Distribution Channel, 2019-2032 (USD Billion)
28. Germany Dark Store Market, By Category, 2019-2032 (USD Billion)
29. Germany Dark Store Market, By Age Group, 2019-2032 (USD Billion)
30. Germany Dark Store Market, By Distribution Channel, 2019-2032 (USD Billion)
31. France Dark Store Market, By Category 2019-2032 (USD Billion)
32. France Dark Store Market, By Age Group, 2019-2032 (USD Billion)
33. France Dark Store Market, By Distribution Channel, 2019-2032 (USD Billion)
34. U.K. Dark Store Market, By Category, 2019-2032 (USD Billion)
35. U.K. Dark Store Market, By Age Group, 2019-2032 (USD Billion)
36. U.K. Dark Store Market, By Distribution Channel, 2019-2032 (USD Billion)
37. Italy Dark Store Market, By Category, 2019-2032 (USD Billion)
38. Italy Dark Store Market, By Age Group, 2019-2032 (USD Billion)
39. Italy Dark Store Market, By Distribution Channel, 2019-2032 (USD Billion)
40. Spain Dark Store Market, By Category, 2019-2032 (USD Billion)
41. Spain Dark Store Market, By Age Group, 2019-2032 (USD Billion)
42. Spain Dark Store Market, By Distribution Channel, 2019-2032 (USD Billion)
43. Asia Pacific Dark Store Market, By Category, 2019-2032 (USD Billion)
44. Asia Pacific Dark Store Market, By Age Group, 2019-2032 (USD Billion)
45. Asia Pacific Dark Store Market, By Distribution Channel, 2019-2032 (USD Billion)
46. Japan Dark Store Market, By Category, 2019-2032 (USD Billion)
47. Japan Dark Store Market, By Age Group, 2019-2032 (USD Billion)
48. Japan Dark Store Market, By Distribution Channel, 2019-2032 (USD Billion)
49. China Dark Store Market, By Category 2019-2032 (USD Billion)
50. China Dark Store Market, By Age Group, 2019-2032 (USD Billion)
51. China Dark Store Market, By Distribution Channel, 2019-2032 (USD Billion)
52. India Dark Store Market, By Category 2019-2032 (USD Billion)
53. India Dark Store Market, By Age Group, 2019-2032 (USD Billion)
54. India Dark Store Market, By Distribution Channel, 2019-2032 (USD Billion)
55. South America Dark Store Market, By Category, 2019-2032 (USD Billion)
56. South America Dark Store Market, By Age Group, 2019-2032 (USD Billion)
57. South America Dark Store Market, By Distribution Channel, 2019-2032 (USD Billion)
58. Brazil Dark Store Market, By Category 2019-2032 (USD Billion)
59. Brazil Dark Store Market, By Age Group, 2019-2032 (USD Billion)
60. Brazil Dark Store Market, By Distribution Channel, 2019-2032 (USD Billion)
61. Middle East and Africa Dark Store Market, By Category, 2019-2032 (USD Billion)
62. Middle East and Africa Dark Store Market, By Age Group, 2019-2032 (USD Billion)
63. Middle East and Africa Dark Store Market, By Distribution Channel, 2019-2032 (USD Billion)
64. UAE Dark Store Market, By Category, 2019-2032 (USD Billion)
65. UAE Dark Store Market, By Age Group, 2019-2032 (USD Billion)
66. UAE Dark Store Market, By Distribution Channel, 2019-2032 (USD Billion)
67. South Africa Dark Store Market, By Category 2019-2032 (USD Billion)
68. South Africa Dark Store Market, By Age Group, 2019-2032 (USD Billion)
69. South Africa Dark Store Market, By Distribution Channel, 2019-2032 (USD Billion)
List of Figures
1. Global Dark Store Market Segmentation
2. Dark Store Market: Research Methodology
3. Market Size Estimation Methodology: Bottom-Up Approach
4. Market Size Estimation Methodology: Top-Down Approach
5. Data Triangulation
6. Porter’s Five Forces Analysis
7. Value Chain Analysis
8. Global Dark Store Market Attractiveness Analysis by Category
9. Global Dark Store Market Attractiveness Analysis by Age Group
10. Global Dark Store Market Attractiveness Analysis by Distribution Channel
11. Global Dark Store Market Attractiveness Analysis by Region
12. Global Dark Store Market: Dynamics
13. Global Dark Store Market Share by Category (2022 & 2032)
14. Global Dark Store Market Share by Age Group (2022 & 2032)
15. Global Dark Store Market Share by Distribution Channel (2022 & 2032)
16. Global Dark Store Market Share by Regions (2022 & 2032)
17. Global Dark Store Market Share by Company (2022)
This study forecasts revenue at global, regional, and country levels from 2019 to 2032. The Brainy Insights has segmented the global dark store market based on below mentioned segments:
Global Dark Store Market Category:
Global Dark Store Market Age Group:
Global Dark Store Market Distribution Channel:
Global Dark Store Market by Region:
Research has its special purpose to undertake marketing efficiently. In this competitive scenario, businesses need information across all industry verticals; the information about customer wants, market demand, competition, industry trends, distribution channels etc. This information needs to be updated regularly because businesses operate in a dynamic environment. Our organization, The Brainy Insights incorporates scientific and systematic research procedures in order to get proper market insights and industry analysis for overall business success. The analysis consists of studying the market from a miniscule level wherein we implement statistical tools which helps us in examining the data with accuracy and precision.
Our research reports feature both; quantitative and qualitative aspects for any market. Qualitative information for any market research process are fundamental because they reveal the customer needs and wants, usage and consumption for any product/service related to a specific industry. This in turn aids the marketers/investors in knowing certain perceptions of the customers. Qualitative research can enlighten about the different product concepts and designs along with unique service offering that in turn, helps define marketing problems and generate opportunities. On the other hand, quantitative research engages with the data collection process through interviews, e-mail interactions, surveys and pilot studies. Quantitative aspects for the market research are useful to validate the hypotheses generated during qualitative research method, explore empirical patterns in the data with the help of statistical tools, and finally make the market estimations.
The Brainy Insights offers comprehensive research and analysis, based on a wide assortment of factual insights gained through interviews with CXOs and global experts and secondary data from reliable sources. Our analysts and industry specialist assume vital roles in building up statistical tools and analysis models, which are used to analyse the data and arrive at accurate insights with exceedingly informative research discoveries. The data provided by our organization have proven precious to a diverse range of companies, facilitating them to address issues such as determining which products/services are the most appealing, whether or not customers use the product in the manner anticipated, the purchasing intentions of the market and many others.
Our research methodology encompasses an idyllic combination of primary and secondary initiatives. Key phases involved in this process are listed below:

The phase involves the gathering and collecting of market data and its related information with the help of different sources & research procedures.

The data procurement stage involves in data gathering and collecting through various data sources.
This stage involves in extensive research. These data sources includes:
Purchased Database: Purchased databases play a crucial role in estimating the market sizes irrespective of the domain. Our purchased database includes:
Primary Research: The Brainy Insights interacts with leading companies and experts of the concerned domain to develop the analyst team’s market understanding and expertise. It improves and substantiates every single data presented in the market reports. Primary research mainly involves in telephonic interviews, E-mail interactions and face-to-face interviews with the raw material providers, manufacturers/producers, distributors, & independent consultants. The interviews that we conduct provides valuable data on market size and industry growth trends prevailing in the market. Our organization also conducts surveys with the various industry experts in order to gain overall insights of the industry/market. For instance, in healthcare industry we conduct surveys with the pharmacists, doctors, surgeons and nurses in order to gain insights and key information of a medical product/device/equipment which the customers are going to usage. Surveys are conducted in the form of questionnaire designed by our own analyst team. Surveys plays an important role in primary research because surveys helps us to identify the key target audiences of the market. Additionally, surveys helps to identify the key target audience engaged with the market. Our survey team conducts the survey by targeting the key audience, thus gaining insights from them. Based on the perspectives of the customers, this information is utilized to formulate market strategies. Moreover, market surveys helps us to understand the current competitive situation of the industry. To be precise, our survey process typically involve with the 360 analysis of the market. This analytical process begins by identifying the prospective customers for a product or service related to the market/industry to obtain data on how a product/service could fit into customers’ lives.

Secondary Research: The secondary data sources includes information published by the on-profit organizations such as World bank, WHO, company fillings, investor presentations, annual reports, national government documents, statistical databases, blogs, articles, white papers and others. From the annual report, we analyse a company’s revenue to understand the key segment and market share of that organization in a particular region. We analyse the company websites and adopt the product mapping technique which is important for deriving the segment revenue. In the product mapping method, we select and categorize the products offered by the companies catering to domain specific market, deduce the product revenue for each of the companies so as to get overall estimation of the market size. We also source data and analyses trends based on information received from supply side and demand side intermediaries in the value chain. The supply side denotes the data gathered from supplier, distributor, wholesaler and the demand side illustrates the data gathered from the end customers for respective market domain.

The supply side for a domain specific market is analysed by:
The demand side for the market is estimated through:
In-house Library: Apart from these third-party sources, we have our in-house library of qualitative and quantitative information. Our in-house database includes market data for various industry and domains. These data are updated on regular basis as per the changing market scenario. Our library includes, historic databases, internal audit reports and archives.
Sometimes there are instances where there is no metadata or raw data available for any domain specific market. For those cases, we use our expertise to forecast and estimate the market size in order to generate comprehensive data sets. Our analyst team adopt a robust research technique in order to produce the estimates:
Data Synthesis: This stage involves the analysis & mapping of all the information obtained from the previous step. It also involves in scrutinizing the data for any discrepancy observed while data gathering related to the market. The data is collected with consideration to the heterogeneity of sources. Robust scientific techniques are in place for synthesizing disparate data sets and provide the essential contextual information that can orient market strategies. The Brainy Insights has extensive experience in data synthesis where the data passes through various stages:


Market Deduction & Formulation: The final stage comprises of assigning data points at appropriate market spaces so as to deduce feasible conclusions. Analyst perspective & subject matter expert based holistic form of market sizing coupled with industry analysis also plays a crucial role in this stage.
This stage involves in finalization of the market size and numbers that we have collected from data integration step. With data interpolation, it is made sure that there is no gap in the market data. Successful trend analysis is done by our analysts using extrapolation techniques, which provide the best possible forecasts for the market.
Data Validation & Market Feedback: Validation is the most important step in the process. Validation & re-validation via an intricately designed process helps us finalize data-points to be used for final calculations.

The Brainy Insights interacts with leading companies and experts of the concerned domain to develop the analyst team’s market understanding and expertise. It improves and substantiates every single data presented in the market reports. The data validation interview and discussion panels are typically composed of the most experienced industry members. The participants include, however, are not limited to:
Moreover, we always validate our data and findings through primary respondents from all the major regions we are working on.


Free Customization
Fortune 500 Clients
Free Yearly Update On Purchase Of Multi/Corporate License
Companies Served Till Date