- +1-315-215-1633
- sales@thebrainyinsights.com

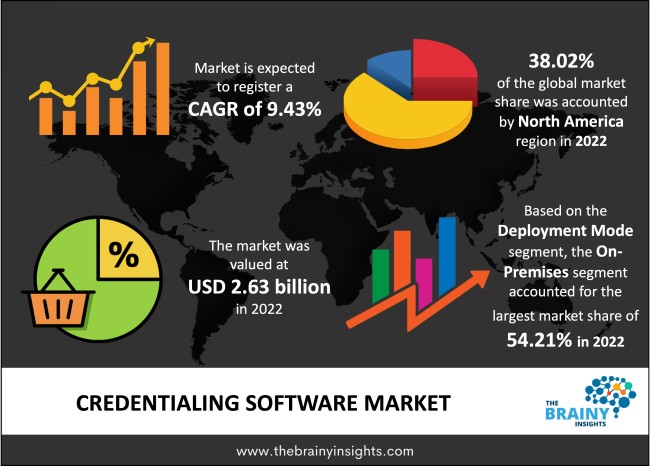
The global credentialing software market was valued at USD 2.63 Billion in 2022 and grew at a CAGR of 9.43% from 2023 to 2032. The market is expected to reach USD 6.47 Billion by 2032. The increasing requirement of verification of credentials among education institutes and organization will lead to a high growth rate in the market
Credentialing is a thorough procedure that examines a care provider's credentials and professional background, including their training, licences, and speciality certificates. Credentialing software automates tasks previously completed using paper forms, spreadsheets, and emails, saving the end-users resources and reducing errors. Professionals and HR staff use credentialing software to digitally track and administer professional certifications, licences, and other documentation proving the holder is qualified to conduct work lawfully or comply with any governing legislation. Credentialing uses various software technologies, which is why it is crucial for ensuring public safety and high-quality services.
Get an overview of this study by requesting a free sample
Rising use in customer relationship management: There is much to track to keep a credentialing programme going properly, including application submissions, eligibility checks, verified documents, exam data, professional development credits, and renewals. Without extensive custom programming, credentialing management software offers all the fantastic advantages of a customer relationship management system. The credentialing management software is built with features optimized for the credentialing industry. Several productivity modules are frequently linked with the credentialing software to answer the unique needs of administering credentialing programs, such as e-commerce and membership administration.
High cost of deployment: A considerable investment is required to install credentialing software. The software even requires regularly scheduled updates which leads to the additional cost being added to the cost of deployment. Therefore, substantial initial investment and maintenance cost is one of the critical factors that may hinder the market's growth over the forecast period.
Increased investment by organizations: The businesses must contend with fierce industry competition. Over time, the competition is increasing with more number of buyers and vendors entering the commercial market. Additionally, the quality of the software given by competing businesses is essentially the same, which reduces the market power of suppliers. Thus, a lot of businesses are putting their attention towards building their R&D foundation in order to concentrate more on product differentiation. Credentialing is now more important than ever, thus businesses are engaging in a lot of research and development to acquire lots of ideas that can boost their company's profitability. Businesses are making significant investments in the creation and application of cutting-edge technology and automation of authentication processes.
The regions analyzed for the market include North America, Europe, South America, Asia Pacific, the Middle East, and Africa. North America emerged as the most significant credentialing software market, with a 38.02% market revenue share in 2022.
North American region will account for the largest market share with revenue growth. Nations such as the U.S. and Canada have a tremendous demand for credentialing software due to the rising investment in customer service management and access management. Further, industries are streamlining their employee training procedures, and thus, the implementation of credentialing software has increased in recent years.
North America Region Credentialing Software Market Share in 2022 - 38.02%
www.thebrainyinsights.com
Check the geographical analysis of this market by requesting a free sample
The product type segment is divided into social customer service and contact centre infrastructure, cloud identity and access management and others. The social customer service and contact centre infrastructure segment dominated the market, with a share of around 48.70% in 2022. Functional social customer service and contact centre infrastructure facilities require a framework comprising physical and virtual resources. The credentialing software technology has also been included in the infrastructure of contemporary contact centres to streamline the process of authentication.
The deployment mode segment is divided into on-premises and cloud. The on-premises segment dominated the market, with a share of around 54.21% in 2022. The on-premises software is used to manage the training and certification programmes. Enterprise and consumer applications have traditionally been developed using on-premises software.
The application segment is divided into background screening, electronic credentials storage, continuing education and others. The electronic credentials storage segment dominated the market, with a share of around 49.92% in 2022. Credentials are used to identify subjects that are filled with principals during authentication. They are also used during authorization to determine what actions the subjects are permitted to take.
| Attribute | Description |
|---|---|
| Market Size | Revenue (USD Billion) |
| Market size value in 2022 | USD 2.63 Billion |
| Market size value in 2032 | USD 6.47 Billion |
| CAGR (2023 to 2032) | 9.43% |
| Historical data | 2019-2021 |
| Base Year | 2022 |
| Forecast | 2023-2032 |
| Region | The regions analyzed for the market are Asia Pacific, Europe, South America, North America, and Middle East & Africa. Furthermore, the regions are further analyzed at the country level. |
| Segments | Product Type, Deployment, and Application |
As per The Brainy Insights, the size of the credentialing software market was valued USD 2.63 billion in 2022 to USD 6.47 billion by 2032.
Global credentialing software market is growing at a CAGR of 9.43% during the forecast period 2023-2032.
North America region emerged as the largest market for the credentialing software.
The market's growth will be influenced by the increasing demand of credentialing software across industries.
The high cost of deployment can hamper the market growth.
The increasing number of investment by end-users is providing huge opportunities to the market.
Key players are Kareo, OurRecords, Modio Health, Hyland Software, Echo, Vistar Technologies, BairesDev, Symplr, MidasPlus, Global Credential Evaluators, Inc, IntelliSoft Group, Covenant Technology Group among others.
1. Introduction
1.1. Objectives of the Study
1.2. Market Definition
1.3. Research Scope
1.4. Currency
1.5. Key Target Audience
2. Research Methodology and Assumptions
3. Executive Summary
4. Premium Insights
4.1. Porter’s Five Forces Analysis
4.2. Value Chain Analysis
4.3. Top Investment Pockets
4.3.1. Market Attractiveness Analysis by Product Type
4.3.2. Market Attractiveness Analysis by Deployment
4.3.3. Market Attractiveness Analysis by Applications
4.3.4. Market Attractiveness Analysis by Region
4.4. Industry Trends
5. Market Dynamics
5.1. Market Evaluation
5.2. Drivers
5.2.1. Increasing use of credentialing software across industries
5.3. Restraints
5.3.1. High cost of deployment
5.4. Opportunities
5.4.1. Increasing investment by educational institutes and organizations
5.5. Challenges
5.5.1. Lack of awareness
6. Global Credentialing Software Market Analysis and Forecast, By Product Type
6.1. Segment Overview
6.2. Social Customer Service and Contact Center Infrastructure
6.3. Cloud Identity and Access Management
6.4. Others
7. Global Credentialing Software Market Analysis and Forecast, By Deployment
7.1. Segment Overview
7.2. On-Premises
7.3. Cloud
8. Global Credentialing Software Market Analysis and Forecast, By Application
8.1. Segment Overview
8.2. Background Screening
8.3. Electronic Credentials Storage
8.4. Continuing Education
8.5. Others
9. Global Credentialing Software Market Analysis and Forecast, By Regional Analysis
9.1. Segment Overview
9.2. North America
9.2.1. U.S.
9.2.2. Canada
9.2.3. Mexico
9.3. Europe
9.3.1. Germany
9.3.2. France
9.3.3. U.K.
9.3.4. Italy
9.3.5. Spain
9.4. Asia-Pacific
9.4.1. Japan
9.4.2. China
9.4.3. India
9.5. South America
9.5.1. Brazil
9.6. Middle East and Africa
9.6.1. UAE
9.6.2. South Africa
10. Global Credentialing Software Market-Competitive Landscape
10.1. Overview
10.2. Market Share of Key Players in the Credentialing Software Market
10.2.1. Global Company Market Share
10.2.2. North America Company Market Share
10.2.3. Europe Company Market Share
10.2.4. APAC Company Market Share
10.3. Competitive Situations and Trends
10.3.1. Product Launches and Developments
10.3.2. Partnerships, Collaborations, and Agreements
10.3.3. Mergers & Acquisitions
10.3.4. Expansions
11. Company Profiles
11.1. Kareo
11.1.1. Business Overview
11.1.2. Company Snapshot
11.1.3. Company Market Share Analysis
11.1.4. Company Product Portfolio
11.1.5. Recent Developments
11.1.6. SWOT Analysis
11.2. OurRecords
11.2.1. Business Overview
11.2.2. Company Snapshot
11.2.3. Company Market Share Analysis
11.2.4. Company Product Portfolio
11.2.5. Recent Developments
11.2.6. SWOT Analysis
11.3. Modio Health
11.3.1. Business Overview
11.3.2. Company Snapshot
11.3.3. Company Market Share Analysis
11.3.4. Company Product Portfolio
11.3.5. Recent Developments
11.3.6. SWOT Analysis
11.4. Hyland Software
11.4.1. Business Overview
11.4.2. Company Snapshot
11.4.3. Company Market Share Analysis
11.4.4. Company Product Portfolio
11.4.5. Recent Developments
11.4.6. SWOT Analysis
11.5. Echo
11.5.1. Business Overview
11.5.2. Company Snapshot
11.5.3. Company Market Share Analysis
11.5.4. Company Product Portfolio
11.5.5. Recent Developments
11.5.6. SWOT Analysis
11.6. Vistar Technologies
11.6.1. Business Overview
11.6.2. Company Snapshot
11.6.3. Company Market Share Analysis
11.6.4. Company Product Portfolio
11.6.5. Recent Developments
11.6.6. SWOT Analysis
11.7. BairesDev
11.7.1. Business Overview
11.7.2. Company Snapshot
11.7.3. Company Market Share Analysis
11.7.4. Company Product Portfolio
11.7.5. Recent Developments
11.7.6. SWOT Analysis
11.8. Symplr
11.8.1. Business Overview
11.8.2. Company Snapshot
11.8.3. Company Market Share Analysis
11.8.4. Company Product Portfolio
11.8.5. Recent Developments
11.8.6. SWOT Analysis
11.9. MidasPlus
11.9.1. Business Overview
11.9.2. Company Snapshot
11.9.3. Company Market Share Analysis
11.9.4. Company Product Portfolio
11.9.5. Recent Developments
11.9.6. SWOT Analysis
11.10. Global Credential Evaluators, Inc
11.10.1. Business Overview
11.10.2. Company Snapshot
11.10.3. Company Market Share Analysis
11.10.4. Company Product Portfolio
11.10.5. Recent Developments
11.10.6. SWOT Analysis
11.11. IntelliSoft Group
11.11.1. Business Overview
11.11.2. Company Snapshot
11.11.3. Company Market Share Analysis
11.11.4. Company Product Portfolio
11.11.5. Recent Developments
11.11.6. SWOT Analysis
11.12. Covenant Technology Group
11.12.1. Business Overview
11.12.2. Company Snapshot
11.12.3. Company Market Share Analysis
11.12.4. Company Product Portfolio
11.12.5. Recent Developments
11.12.6. SWOT Analysis
List of Table
1. Global Credentialing Software Market, By Product Type, 2019-2032 (USD Billion)
2. Global Social Customer Service and Contact Center Infrastructure, Credentialing Software Market, By Region, 2019-2032 (USD Billion)
3. Global Cloud Identity and Access Management, Credentialing Software Market, By Region, 2019-2032 (USD Billion)
4. Global Others, Credentialing Software Market, By Region, 2019-2032 (USD Billion)
5. Global Credentialing Software Market, By Deployment, 2019-2032 (USD Billion)
6. Global On-Premises, Credentialing Software Market, By Region, 2019-2032 (USD Billion)
7. Global Cloud, Credentialing Software Market, By Region, 2019-2032 (USD Billion)
8. Global Credentialing Software Market, By Application, 2019-2032 (USD Billion)
9. Global Background Screening, Credentialing Software Market, By Region, 2019-2032 (USD Billion)
10. Global Electronic Credentials Storage, Credentialing Software Market, By Region, 2019-2032 (USD Billion)
11. Global Continuing Education, Credentialing Software Market, By Region, 2019-2032 (USD Billion)
12. Global Others, Credentialing Software Market, By Region, 2019-2032 (USD Billion)
13. Global Credentialing Software Market, By Region, 2019-2032 (USD Billion)
14. North America Credentialing Software Market, By Product Type, 2019-2032 (USD Billion)
15. North America Credentialing Software Market, By Deployment, 2019-2032 (USD Billion)
16. North America Credentialing Software Market, By Application, 2019-2032 (USD Billion)
17. U.S. Credentialing Software Market, By Product Type, 2019-2032 (USD Billion)
18. U.S. Credentialing Software Market, By Deployment, 2019-2032 (USD Billion)
19. U.S. Credentialing Software Market, By Application, 2019-2032 (USD Billion)
20. Canada Credentialing Software Market, By Product Type, 2019-2032 (USD Billion)
21. Canada Credentialing Software Market, By Deployment, 2019-2032 (USD Billion)
22. Canada Credentialing Software Market, By Application, 2019-2032 (USD Billion)
23. Mexico Credentialing Software Market, By Product Type, 2019-2032 (USD Billion)
24. Mexico Credentialing Software Market, By Deployment, 2019-2032 (USD Billion)
25. Mexico Credentialing Software Market, By Application, 2019-2032 (USD Billion)
26. Europe Credentialing Software Market, By Product Type, 2019-2032 (USD Billion)
27. Europe Credentialing Software Market, By Deployment, 2019-2032 (USD Billion)
28. Europe Credentialing Software Market, By Application, 2019-2032 (USD Billion)
29. Germany Credentialing Software Market, By Product Type, 2019-2032 (USD Billion)
30. Germany Credentialing Software Market, By Deployment, 2019-2032 (USD Billion)
31. Germany Credentialing Software Market, By Application, 2019-2032 (USD Billion)
32. France Credentialing Software Market, By Product Type, 2019-2032 (USD Billion)
33. France Credentialing Software Market, By Deployment, 2019-2032 (USD Billion)
34. France Credentialing Software Market, By Application, 2019-2032 (USD Billion)
35. U.K. Credentialing Software Market, By Product Type, 2019-2032 (USD Billion)
36. U.K. Credentialing Software Market, By Deployment, 2019-2032 (USD Billion)
37. U.K. Credentialing Software Market, By Application, 2019-2032 (USD Billion)
38. Italy Credentialing Software Market, By Product Type, 2019-2032 (USD Billion)
39. Italy Credentialing Software Market, By Deployment, 2019-2032 (USD Billion)
40. Italy Credentialing Software Market, By Application, 2019-2032 (USD Billion)
41. Spain Credentialing Software Market, By Product Type, 2019-2032 (USD Billion)
42. Spain Credentialing Software Market, By Deployment, 2019-2032 (USD Billion)
43. Spain Credentialing Software Market, By Application, 2019-2032 (USD Billion)
44. Asia Pacific Credentialing Software Market, By Product Type, 2019-2032 (USD Billion)
45. Asia Pacific Credentialing Software Market, By Deployment, 2019-2032 (USD Billion)
46. Asia Pacific Credentialing Software Market, By Application, 2019-2032 (USD Billion)
47. Japan Credentialing Software Market, By Product Type, 2019-2032 (USD Billion)
48. Japan Credentialing Software Market, By Deployment, 2019-2032 (USD Billion)
49. Japan Credentialing Software Market, By Application, 2019-2032 (USD Billion)
50. China Credentialing Software Market, By Product Type, 2019-2032 (USD Billion)
51. China Credentialing Software Market, By Deployment, 2019-2032 (USD Billion)
52. China Credentialing Software Market, By Application, 2019-2032 (USD Billion)
53. India Credentialing Software Market, By Product Type, 2019-2032 (USD Billion)
54. India Credentialing Software Market, By Deployment, 2019-2032 (USD Billion)
55. India Credentialing Software Market, By Application, 2019-2032 (USD Billion)
56. South America Credentialing Software Market, By Product Type, 2019-2032 (USD Billion)
57. South America Credentialing Software Market, By Deployment, 2019-2032 (USD Billion)
58. South America Credentialing Software Market, By Application, 2019-2032 (USD Billion)
59. Brazil Credentialing Software Market, By Product Type, 2019-2032 (USD Billion)
60. Brazil Credentialing Software Market, By Deployment, 2019-2032 (USD Billion)
61. Brazil Credentialing Software Market, By Application, 2019-2032 (USD Billion)
62. Middle East and Africa Credentialing Software Market, By Product Type, 2019-2032 (USD Billion)
63. Middle East and Africa Credentialing Software Market, By Deployment, 2019-2032 (USD Billion)
64. Middle East and Africa Credentialing Software Market, By Application, 2019-2032 (USD Billion)
65. UAE Credentialing Software Market, By Product Type, 2019-2032 (USD Billion)
66. UAE Credentialing Software Market, By Deployment, 2019-2032 (USD Billion)
67. UAE Credentialing Software Market, By Application, 2019-2032 (USD Billion)
68. South Africa Credentialing Software Market, By Product Type, 2019-2032 (USD Billion)
69. South Africa Credentialing Software Market, By Deployment, 2019-2032 (USD Billion)
70. South Africa Credentialing Software Market, By Application, 2019-2032 (USD Billion)
List of Figures
1. Global Credentialing Software Market Segmentation
2. Credentialing Software Market: Research Methodology
3. Market Size Estimation Methodology: Bottom-Up Approach
4. Market Size Estimation Methodology: Top-Down Approach
5. Data Triangulation
6. Porter’s Five Forces Analysis
7. Value Chain Analysis
8. Global Credentialing Software Market Attractiveness Analysis by Product Type
9. Global Credentialing Software Market Attractiveness Analysis by Deployment
10. Global Credentialing Software Market Attractiveness Analysis by Application
11. Global Credentialing Software Market Attractiveness Analysis by Region
12. Global Credentialing Software Market: Dynamics
13. Global Credentialing Software Market Share by Product Type (2022 & 2032)
14. Global Credentialing Software Market Share by Deployment (2022 & 2032)
15. Global Credentialing Software Market Share by Application (2022 & 2032)
16. Global Credentialing Software Market Share by Regions (2022 & 2032)
17. Global Credentialing Software Market Share by Company (2022)
This study forecasts revenue at global, regional, and country levels from 2019 to 2032. The Brainy Insights has segmented the global credentialing software market based on below mentioned segments:
Global Credentialing Software Market by Product Type:
Global Credentialing Software Market by Deployment:
Global Credentialing Software Market by Application:
Global Credentialing Software Market by Region:
Research has its special purpose to undertake marketing efficiently. In this competitive scenario, businesses need information across all industry verticals; the information about customer wants, market demand, competition, industry trends, distribution channels etc. This information needs to be updated regularly because businesses operate in a dynamic environment. Our organization, The Brainy Insights incorporates scientific and systematic research procedures in order to get proper market insights and industry analysis for overall business success. The analysis consists of studying the market from a miniscule level wherein we implement statistical tools which helps us in examining the data with accuracy and precision.
Our research reports feature both; quantitative and qualitative aspects for any market. Qualitative information for any market research process are fundamental because they reveal the customer needs and wants, usage and consumption for any product/service related to a specific industry. This in turn aids the marketers/investors in knowing certain perceptions of the customers. Qualitative research can enlighten about the different product concepts and designs along with unique service offering that in turn, helps define marketing problems and generate opportunities. On the other hand, quantitative research engages with the data collection process through interviews, e-mail interactions, surveys and pilot studies. Quantitative aspects for the market research are useful to validate the hypotheses generated during qualitative research method, explore empirical patterns in the data with the help of statistical tools, and finally make the market estimations.
The Brainy Insights offers comprehensive research and analysis, based on a wide assortment of factual insights gained through interviews with CXOs and global experts and secondary data from reliable sources. Our analysts and industry specialist assume vital roles in building up statistical tools and analysis models, which are used to analyse the data and arrive at accurate insights with exceedingly informative research discoveries. The data provided by our organization have proven precious to a diverse range of companies, facilitating them to address issues such as determining which products/services are the most appealing, whether or not customers use the product in the manner anticipated, the purchasing intentions of the market and many others.
Our research methodology encompasses an idyllic combination of primary and secondary initiatives. Key phases involved in this process are listed below:

The phase involves the gathering and collecting of market data and its related information with the help of different sources & research procedures.

The data procurement stage involves in data gathering and collecting through various data sources.
This stage involves in extensive research. These data sources includes:
Purchased Database: Purchased databases play a crucial role in estimating the market sizes irrespective of the domain. Our purchased database includes:
Primary Research: The Brainy Insights interacts with leading companies and experts of the concerned domain to develop the analyst team’s market understanding and expertise. It improves and substantiates every single data presented in the market reports. Primary research mainly involves in telephonic interviews, E-mail interactions and face-to-face interviews with the raw material providers, manufacturers/producers, distributors, & independent consultants. The interviews that we conduct provides valuable data on market size and industry growth trends prevailing in the market. Our organization also conducts surveys with the various industry experts in order to gain overall insights of the industry/market. For instance, in healthcare industry we conduct surveys with the pharmacists, doctors, surgeons and nurses in order to gain insights and key information of a medical product/device/equipment which the customers are going to usage. Surveys are conducted in the form of questionnaire designed by our own analyst team. Surveys plays an important role in primary research because surveys helps us to identify the key target audiences of the market. Additionally, surveys helps to identify the key target audience engaged with the market. Our survey team conducts the survey by targeting the key audience, thus gaining insights from them. Based on the perspectives of the customers, this information is utilized to formulate market strategies. Moreover, market surveys helps us to understand the current competitive situation of the industry. To be precise, our survey process typically involve with the 360 analysis of the market. This analytical process begins by identifying the prospective customers for a product or service related to the market/industry to obtain data on how a product/service could fit into customers’ lives.

Secondary Research: The secondary data sources includes information published by the on-profit organizations such as World bank, WHO, company fillings, investor presentations, annual reports, national government documents, statistical databases, blogs, articles, white papers and others. From the annual report, we analyse a company’s revenue to understand the key segment and market share of that organization in a particular region. We analyse the company websites and adopt the product mapping technique which is important for deriving the segment revenue. In the product mapping method, we select and categorize the products offered by the companies catering to domain specific market, deduce the product revenue for each of the companies so as to get overall estimation of the market size. We also source data and analyses trends based on information received from supply side and demand side intermediaries in the value chain. The supply side denotes the data gathered from supplier, distributor, wholesaler and the demand side illustrates the data gathered from the end customers for respective market domain.

The supply side for a domain specific market is analysed by:
The demand side for the market is estimated through:
In-house Library: Apart from these third-party sources, we have our in-house library of qualitative and quantitative information. Our in-house database includes market data for various industry and domains. These data are updated on regular basis as per the changing market scenario. Our library includes, historic databases, internal audit reports and archives.
Sometimes there are instances where there is no metadata or raw data available for any domain specific market. For those cases, we use our expertise to forecast and estimate the market size in order to generate comprehensive data sets. Our analyst team adopt a robust research technique in order to produce the estimates:
Data Synthesis: This stage involves the analysis & mapping of all the information obtained from the previous step. It also involves in scrutinizing the data for any discrepancy observed while data gathering related to the market. The data is collected with consideration to the heterogeneity of sources. Robust scientific techniques are in place for synthesizing disparate data sets and provide the essential contextual information that can orient market strategies. The Brainy Insights has extensive experience in data synthesis where the data passes through various stages:


Market Deduction & Formulation: The final stage comprises of assigning data points at appropriate market spaces so as to deduce feasible conclusions. Analyst perspective & subject matter expert based holistic form of market sizing coupled with industry analysis also plays a crucial role in this stage.
This stage involves in finalization of the market size and numbers that we have collected from data integration step. With data interpolation, it is made sure that there is no gap in the market data. Successful trend analysis is done by our analysts using extrapolation techniques, which provide the best possible forecasts for the market.
Data Validation & Market Feedback: Validation is the most important step in the process. Validation & re-validation via an intricately designed process helps us finalize data-points to be used for final calculations.

The Brainy Insights interacts with leading companies and experts of the concerned domain to develop the analyst team’s market understanding and expertise. It improves and substantiates every single data presented in the market reports. The data validation interview and discussion panels are typically composed of the most experienced industry members. The participants include, however, are not limited to:
Moreover, we always validate our data and findings through primary respondents from all the major regions we are working on.


Free Customization
Fortune 500 Clients
Free Yearly Update On Purchase Of Multi/Corporate License
Companies Served Till Date