- +1-315-215-1633
- sales@thebrainyinsights.com

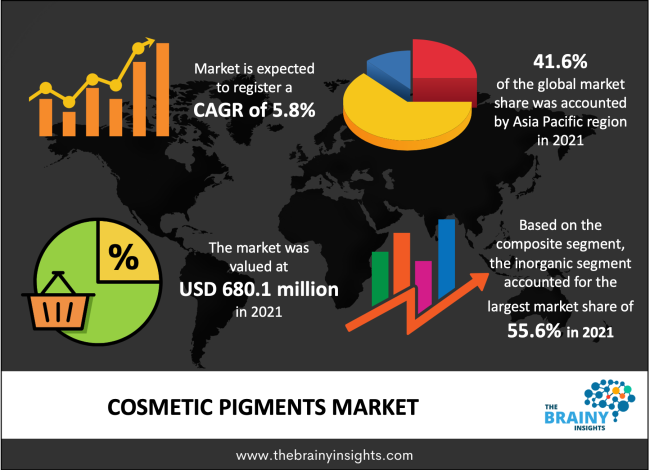
The cosmetic pigments market was estimated at around USD 680.1 million in 2021, growing at a CAGR of nearly 5.8% during 2022-2030. The market is projected to reach approximately USD 1,125.5 million by 2030.
A colorful substance that is almost completely or completely insoluble in water is called a pigment. Cosmetic pigments are used to offer cosmetic products a variety of colors, textures, and finishes. Cosmetic pigments come in a variety of colors, in addition to white pigments, metallic tones, and other materials. They are used to create cosmetics, nail polish, hair dye, and lip care items for individuals. The two categories of cosmetic pigments—organic pigments and inorganic pigments—are separated depending on their chemical makeup.
In comparison to inorganic pigments, organic pigments have brighter colors because they are made of carbon chains. In contrast, the components of inorganic pigments like chromates and metallic oxides are soluble metallic salts and compounds. Comparatively, organic pigments cost more. A number of inorganic pigments with different chemical makeups, including iron oxides, ultramarines, white pigments, chromium dioxides, and others, are utilized in the manufacture of cosmetic products. Black, yellow, and red are the three colors of iron oxide that are available. These are found in face powders, blushers, and liquid foundations. Cosmetics frequently contain white pigments like zinc oxide and titanium oxide. These pigments have excellent covering power, are heat-resistant, and are very light. Ultramarines are strong, flat, matte pigments with vibrant hues that are produced to an extremely high standard of excellence and satisfy all aesthetic requirements. Lipsticks, foundations, correctives, and colored eye shadows are just a few cosmetic products that contain them. They are essential to making cosmetics.
Get an overview of this study by requesting a free sample
The numerous beauty care products are produced by international cosmetic corporations using a combination of ingredients. Customers frequently use these cosmetic products to improve the look or smell of their body. Before the COVID-19 epidemic, factors like as lifestyle changes, growing disposable money, and an increase in concerns about appearance were driving the market's expansion. Additionally, businesses are utilizing social media sites like Instagram and YouTube to advertise their goods and expand their customer base. Companies are using social media influencers to promote their products on a variety of platforms. However, the market for international cosmetic items has experienced a decline in growth rate since the Covid-19 epidemic began in January 2020. Cosmetic manufacturers were forced to close their production facilities due to the manpower scarcity as a result of the global lockdown crisis. The COVID-19 pandemic also led to the closure of a large number of cosmetic stores.
Global lifestyle changes and rising per capita income to accelerate the market’s growth
Because of their rising GDP and per capita income, developing nations like China, India, South Korea, and Brazil are seeing their living standards rise steadily. Due to rising income levels and altering lifestyles brought on by rapid urbanization, there is a major rise in the demand for cosmetic and personal care items. Global product demand is being boosted by the rising cost of grooming cosmetics. For instance, women worldwide spend $246 on cosmetics annually on average. The lifestyle of the youthful generation is drastically changing, which is increasing demand for cosmetic pigments. For instance, it is predicted that 1.2 billion people, or 16% of the world's population, will be under the age of 24 in 2021, creating enormous prospects for the global market for cosmetic pigments. In addition, women now have more disposable income as a result of their increased financial independence.
Expanding use of pigments in cometic industry
The widespread usage of cosmetic pigments will result in a large rise in demand. During the anticipated period, the market will continue to be driven by the increasing trend of men's grooming. The growth of grooming salons and consumer spending on cosmetics will favor the market for cosmetic pigments. The antiperspirants and pigments used in the cosmetics have a high glitter and matte finish. Natural-looking white pigments, metallic hues, and sparkling pigments are all part of the cosmetic pigments range. To enhance compositions' visual appeal, the substance is utilized in a number of cosmetic items, such as lipsticks and eye makeup. The expanding fashion and entertainment sectors will increase demand for cosmetics, which will help the cosmetic pigments market.
The cosmetic pigments market is segmented into the composition, and application. Based on composition, the market for inorganic segment is estimated to lead the market during the forecast period. It is customary to use opaque white inorganic pigments to brighten and impart opacity to other colours. These pigments have less vibrant color than organic pigments. Inorganic pigments, such as titanium dioxide, are in high demand because to their widespread use in cosmetic pigment applications, which is causing this market sector to grow.
By application, the facial makeup segment is anticipated to dominant the cosmetic pigments market during the forecast period. The two major makeup products with the highest growth potential in this application are face powders and foundations. The cosmetic pigments market leader is facial makeup. Titanium dioxide brightens the cosmetic pigments used in facial makeup, such as powder, blushers, and foundation.
Asia-Pacific, which now dominates the market's revenue share, is anticipated to be one of the most enticing markets over the projection period. The top two countries in the region that use cosmetic pigments are China and Japan. The need for cosmetic pigments in the region is anticipated to rise as a result of rising cosmetic manufacturing and consumption in nations like China, India, and the ASEAN nations.
The global Cosmetic pigments market is segmented as follows:
By Composition
By Application
By Region/Geography
| Attribute | Description |
|---|---|
| Base Year | 2021 |
| Forecast period | 2022-2030 |
| Report Coverage | Revenue estimation and forecast, company profile, competitive landscape, growth factors, and recent trends |
| Regional scope | North America, Europe, Asia Pacific, Middle East & Africa, and Latin America |
| Market Size(unit) | USD Million |
| CAGR (2022 to 2030) | 5.8% |
| Segments Covered |
By Composition |
1. Introduction
1.1. Objectives of the Study
1.2. Market Definition
1.3. Research Scope
2. Research Methodology and Assumptions
3. Executive Summary
4. Premium Insights
4.1. Porter’s Five Forces Analysis
4.2. Value Chain Analysis
4.3. Top Investment Pockets
4.3.1. Market Attractiveness Analysis By Composition
4.3.2. Market Attractiveness Analysis By Application
4.4. Industry Trends
5. Market Dynamics
5.1. Market Evaluation
5.2. Drivers
5.2.1. Global lifestyle changes and rising per capita income to accelerate the market’s growth
5.2.2. Expanding use of pigments in cometic industry
5.3. Restrains
5.3.1. Stringent regulations would hamper the market
5.4. Opportunities
5.4.1. Growing environment friendly consumer
6. Global Cosmetic Pigments Market Analysis and Forecast, By Composition
6.1. Segment Overview
6.2. Inorganic
6.3. Organic
7. Global Cosmetic Pigments Market Analysis and Forecast, By Application
7.1. Segment Overview
7.2. Facial Makeup
7.3. Lip Products
7.4. Hair Color Products
7.5. Eye Makeup
7.6. Others
8. Global Cosmetic Pigments Market Analysis and Forecast, By Regional Analysis
8.1. Segment Overview
8.2. North America
8.2.1. U.S.
8.2.2. Canada
8.2.3. Mexico
8.3. Europe
8.3.1. Germany
8.3.2. France
8.3.3. U.K.
8.3.4. Italy
8.3.5. Spain
8.3.6. Rest of Europe
8.4. Asia-Pacific
8.4.1. Japan
8.4.2. China
8.4.3. India
8.4.4. Australia
8.4.5. South Korea
8.4.6. Rest of Asia-Pacific
8.5. South America
8.5.1. Brazil
8.5.2. Argentina
8.5.3. Rest of South America
8.6. Middle East and Africa
8.6.1. UAE
8.6.2. South Africa
8.6.3. Egypt
8.6.4. Kuwait
8.6.5. Saudi Arabia
8.6.6. Rest of Middle East & Africa
9. Global Cosmetic Pigments Market -Competitive Landscape
9.1. Overview
9.2. Market Share of Key Players in the Cosmetic Pigments
9.2.1. Global Company Market Share
9.2.2. North America Company Market Share
9.2.3. Europe Company Market Share
9.2.4. APAC Company Market Share
9.3. Competitive Situations and Trends
9.3.1. Composition Launches and Developments
9.3.2. Partnerships, Collaborations, and Agreements
9.3.3. Mergers & Acquisitions
9.3.4. Expansions
10. Company Profiles
10.1. Sun Chemical
10.1.1. Business Overview
10.1.2. Company Snapshot
10.1.3. Company Market Share Analysis
10.1.4. Company Application Portfolio
10.1.5. Recent Developments
10.1.6. SWOT Analysis
10.2. Sensient Cosmetic Technologies
10.2.1. Business Overview
10.2.2. Company Snapshot
10.2.3. Company Market Share Analysis
10.2.4. Company Application Portfolio
10.2.5. Recent Developments
10.2.6. SWOT Analysis
10.3. Merck & Co.
10.3.1. Business Overview
10.3.2. Company Snapshot
10.3.3. Company Market Share Analysis
10.3.4. Company Application Portfolio
10.3.5. Recent Developments
10.3.6. SWOT Analysis
10.4. BASF SE
10.4.1. Business Overview
10.4.2. Company Snapshot
10.4.3. Company Market Share Analysis
10.4.4. Company Application Portfolio
10.4.5. Recent Developments
10.4.6. SWOT Analysis
10.5. Sudarshan Chemical Industries
10.5.1. Business Overview
10.5.2. Company Snapshot
10.5.3. Company Market Share Analysis
10.5.4. Company Application Portfolio
10.5.5. Recent Developments
10.5.6. SWOT Analysis
10.6. Kobo Products Inc.
10.6.1. Business Overview
10.6.2. Company Snapshot
10.6.3. Company Market Share Analysis
10.6.4. Company Application Portfolio
10.6.5. Recent Developments
10.6.6. SWOT Analysis
10.7. Clariant
10.7.1. Business Overview
10.7.2. Company Snapshot
10.7.3. Company Market Share Analysis
10.7.4. Company Application Portfolio
10.7.5. Recent Developments
10.7.6. SWOT Analysis
10.8. Geotech
10.8.1. Business Overview
10.8.2. Company Snapshot
10.8.3. Company Market Share Analysis
10.8.4. Company Application Portfolio
10.8.5. Recent Developments
10.8.6. SWOT Analysis
10.9. Venator Materials
10.9.1. Business Overview
10.9.2. Company Snapshot
10.9.3. Company Market Share Analysis
10.9.4. Company Application Portfolio
10.9.5. Recent Developments
10.9.6. SWOT Analysis
10.10. Li Pigments
10.10.1. Business Overview
10.10.2. Company Snapshot
10.10.3. Company Market Share Analysis
10.10.4. Company Application Portfolio
10.10.5. Recent Developments
10.10.6. SWOT Analysis
List of Table
1. Global Cosmetic Pigments Market, By Composition, 2022-2030 (USD Million)
2. Global Inorganic Cosmetic Pigments, By Region, 2022-2030 (USD Million)
3. Global Organic Cosmetic Pigments, By Region, 2022-2030 (USD Million)
4. Global Cosmetic Pigments Market, By Application, 2022-2030 (USD Million)
5. Global Facial Makeup Cosmetic Pigments, By Region, 2022-2030 (USD Million)
6. Global Lip Products Cosmetic Pigments, By Region, 2022-2030 (USD Million)
7. Global Hair Color Products Cosmetic Pigments, By Region, 2022-2030 (USD Million)
8. Global Eye Makeup Cosmetic Pigments, By Region, 2022-2030 (USD Million)
9. Global Others Cosmetic Pigments, By Region, 2022-2030 (USD Million)
10. Global Cosmetic Pigments, By Region, 2022-2030 (USD Million)
11. Global Cosmetic Pigments, By North America, 2022-2030 (USD Million)
12. North America Cosmetic Pigments, By Composition, 2022-2030 (USD Million)
13. North America Cosmetic Pigments, By Application, 2022-2030 (USD Million)
14. U.S. Cosmetic Pigments, By Composition, 2022-2030 (USD Million)
15. U.S. Cosmetic Pigments, By Application, 2022-2030 (USD Million)
16. Canada Cosmetic Pigments, By Composition, 2022-2030 (USD Million)
17. Canada Cosmetic Pigments, By Application, 2022-2030 (USD Million)
18. Mexico Cosmetic Pigments, By Composition, 2022-2030 (USD Million)
19. Mexico Cosmetic Pigments, By Application, 2022-2030 (USD Million)
20. Europe Cosmetic Pigments, By Composition, 2022-2030 (USD Million)
21. Europe Cosmetic Pigments, By Application, 2022-2030 (USD Million)
22. Germany Cosmetic Pigments, By Composition, 2022-2030 (USD Million)
23. Germany Cosmetic Pigments, By Application, 2022-2030 (USD Million)
24. France Cosmetic Pigments, By Composition, 2022-2030 (USD Million)
25. France Cosmetic Pigments, By Application, 2022-2030 (USD Million)
26. U.K. Cosmetic Pigments, By Composition, 2022-2030 (USD Million)
27. U.K. Cosmetic Pigments, By Application, 2022-2030 (USD Million)
28. Italy Cosmetic Pigments, By Composition, 2022-2030 (USD Million)
29. Italy Cosmetic Pigments, By Application, 2022-2030 (USD Million)
30. Spain Cosmetic Pigments, By Composition, 2022-2030 (USD Million)
31. Spain Cosmetic Pigments, By Application, 2022-2030 (USD Million)
32. Rest of Europe Cosmetic Pigments, By Composition, 2022-2030 (USD Million)
33. Rest of Europe Cosmetic Pigments, By Application, 2022-2030 (USD Million)
34. Asia Pacific Cosmetic Pigments, By Composition, 2022-2030 (USD Million)
35. Asia Pacific Cosmetic Pigments, By Application, 2022-2030 (USD Million)
36. Japan Cosmetic Pigments, By Composition, 2022-2030 (USD Million)
37. Japan Cosmetic Pigments, By Application, 2022-2030 (USD Million)
38. China Cosmetic Pigments, By Composition, 2022-2030 (USD Million)
39. China Cosmetic Pigments, By Application, 2022-2030 (USD Million)
40. India Cosmetic Pigments, By Composition, 2022-2030 (USD Million)
41. India Cosmetic Pigments, By Application, 2022-2030 (USD Million)
42. Australia Cosmetic Pigments, By Composition, 2022-2030 (USD Million)
43. Australia Cosmetic Pigments, By Application, 2022-2030 (USD Million)
44. South Korea Cosmetic Pigments, By Composition, 2022-2030 (USD Million)
45. South Korea Cosmetic Pigments, By Application, 2022-2030 (USD Million)
46. Rest of Asia-Pacific Cosmetic Pigments, By Composition, 2022-2030 (USD Million)
47. Rest of Asia-Pacific Cosmetic Pigments, By Application, 2022-2030 (USD Million)
48. South America Cosmetic Pigments, By Composition, 2022-2030 (USD Million)
49. South America Cosmetic Pigments, By Application, 2022-2030 (USD Million)
50. Brazil Cosmetic Pigments, By Composition, 2022-2030 (USD Million)
51. Brazil Cosmetic Pigments, By Application, 2022-2030 (USD Million)
52. Argentina Cosmetic Pigments, By Composition, 2022-2030 (USD Million)
53. Argentina Cosmetic Pigments, By Application, 2022-2030 (USD Million)
54. Rest of Latin America Cosmetic Pigments, By Composition, 2022-2030 (USD Million)
55. Rest of Latin America Cosmetic Pigments, By Application, 2022-2030 (USD Million)
56. Middle East and Africa Cosmetic Pigments, By Composition, 2022-2030 (USD Million)
57. Middle East and Africa Cosmetic Pigments, By Application, 2022-2030 (USD Million)
58. UAE Cosmetic Pigments, By Composition, 2022-2030 (USD Million)
59. UAE Cosmetic Pigments, By Application, 2022-2030 (USD Million)
60. South Africa Cosmetic Pigments, By Composition, 2022-2030 (USD Million)
61. South Africa Cosmetic Pigments, By Application, 2022-2030 (USD Million)
62. Egypt Cosmetic Pigments, By Composition, 2022-2030 (USD Million)
63. Egypt Cosmetic Pigments, By Application, 2022-2030 (USD Million)
64. Kuwait Cosmetic Pigments, By Composition, 2022-2030 (USD Million)
65. Kuwait Cosmetic Pigments, By Application, 2022-2030 (USD Million)
66. Saudi Arabia Cosmetic Pigments, By Composition, 2022-2030 (USD Million)
67. Saudi Arabia Cosmetic Pigments, By Application, 2022-2030 (USD Million)
68. Rest of Middle East Cosmetic Pigments, By Composition, 2022-2030 (USD Million)
69. Rest of Middle East Cosmetic Pigments, By Application, 2022-2030 (USD Million)
List of Figures
1. Global Cosmetic Pigments Segmentation
2. Cosmetic Pigments: Research Methodology
3. Market Size Estimation Methodology: Bottom-Up Approach
4. Market Size Estimation Methodology: Top-Down Approach
5. Data Triangulation
6. Porter’s Five Forces Analysis
7. Value Chain Analysis
8. Global Cosmetic Pigments Attractiveness Analysis By Composition
9. Global Cosmetic Pigments Attractiveness Analysis By Application
10. Global Cosmetic Pigments Attractiveness Analysis By Region
11. Global Cosmetic Pigments: Dynamics
12. Global Cosmetic Pigments Share By Composition (2022 & 2030)
13. Global Cosmetic Pigments Share By Application (2022 & 2030)
14. Global Cosmetic Pigments Share by Regions (2022 & 2030)
15. Global Cosmetic Pigments Share by Company (2021)
By Composition
By Application
By Region/Geography
Research has its special purpose to undertake marketing efficiently. In this competitive scenario, businesses need information across all industry verticals; the information about customer wants, market demand, competition, industry trends, distribution channels etc. This information needs to be updated regularly because businesses operate in a dynamic environment. Our organization, The Brainy Insights incorporates scientific and systematic research procedures in order to get proper market insights and industry analysis for overall business success. The analysis consists of studying the market from a miniscule level wherein we implement statistical tools which helps us in examining the data with accuracy and precision.
Our research reports feature both; quantitative and qualitative aspects for any market. Qualitative information for any market research process are fundamental because they reveal the customer needs and wants, usage and consumption for any product/service related to a specific industry. This in turn aids the marketers/investors in knowing certain perceptions of the customers. Qualitative research can enlighten about the different product concepts and designs along with unique service offering that in turn, helps define marketing problems and generate opportunities. On the other hand, quantitative research engages with the data collection process through interviews, e-mail interactions, surveys and pilot studies. Quantitative aspects for the market research are useful to validate the hypotheses generated during qualitative research method, explore empirical patterns in the data with the help of statistical tools, and finally make the market estimations.
The Brainy Insights offers comprehensive research and analysis, based on a wide assortment of factual insights gained through interviews with CXOs and global experts and secondary data from reliable sources. Our analysts and industry specialist assume vital roles in building up statistical tools and analysis models, which are used to analyse the data and arrive at accurate insights with exceedingly informative research discoveries. The data provided by our organization have proven precious to a diverse range of companies, facilitating them to address issues such as determining which products/services are the most appealing, whether or not customers use the product in the manner anticipated, the purchasing intentions of the market and many others.
Our research methodology encompasses an idyllic combination of primary and secondary initiatives. Key phases involved in this process are listed below:

The phase involves the gathering and collecting of market data and its related information with the help of different sources & research procedures.

The data procurement stage involves in data gathering and collecting through various data sources.
This stage involves in extensive research. These data sources includes:
Purchased Database: Purchased databases play a crucial role in estimating the market sizes irrespective of the domain. Our purchased database includes:
Primary Research: The Brainy Insights interacts with leading companies and experts of the concerned domain to develop the analyst team’s market understanding and expertise. It improves and substantiates every single data presented in the market reports. Primary research mainly involves in telephonic interviews, E-mail interactions and face-to-face interviews with the raw material providers, manufacturers/producers, distributors, & independent consultants. The interviews that we conduct provides valuable data on market size and industry growth trends prevailing in the market. Our organization also conducts surveys with the various industry experts in order to gain overall insights of the industry/market. For instance, in healthcare industry we conduct surveys with the pharmacists, doctors, surgeons and nurses in order to gain insights and key information of a medical product/device/equipment which the customers are going to usage. Surveys are conducted in the form of questionnaire designed by our own analyst team. Surveys plays an important role in primary research because surveys helps us to identify the key target audiences of the market. Additionally, surveys helps to identify the key target audience engaged with the market. Our survey team conducts the survey by targeting the key audience, thus gaining insights from them. Based on the perspectives of the customers, this information is utilized to formulate market strategies. Moreover, market surveys helps us to understand the current competitive situation of the industry. To be precise, our survey process typically involve with the 360 analysis of the market. This analytical process begins by identifying the prospective customers for a product or service related to the market/industry to obtain data on how a product/service could fit into customers’ lives.

Secondary Research: The secondary data sources includes information published by the on-profit organizations such as World bank, WHO, company fillings, investor presentations, annual reports, national government documents, statistical databases, blogs, articles, white papers and others. From the annual report, we analyse a company’s revenue to understand the key segment and market share of that organization in a particular region. We analyse the company websites and adopt the product mapping technique which is important for deriving the segment revenue. In the product mapping method, we select and categorize the products offered by the companies catering to domain specific market, deduce the product revenue for each of the companies so as to get overall estimation of the market size. We also source data and analyses trends based on information received from supply side and demand side intermediaries in the value chain. The supply side denotes the data gathered from supplier, distributor, wholesaler and the demand side illustrates the data gathered from the end customers for respective market domain.

The supply side for a domain specific market is analysed by:
The demand side for the market is estimated through:
In-house Library: Apart from these third-party sources, we have our in-house library of qualitative and quantitative information. Our in-house database includes market data for various industry and domains. These data are updated on regular basis as per the changing market scenario. Our library includes, historic databases, internal audit reports and archives.
Sometimes there are instances where there is no metadata or raw data available for any domain specific market. For those cases, we use our expertise to forecast and estimate the market size in order to generate comprehensive data sets. Our analyst team adopt a robust research technique in order to produce the estimates:
Data Synthesis: This stage involves the analysis & mapping of all the information obtained from the previous step. It also involves in scrutinizing the data for any discrepancy observed while data gathering related to the market. The data is collected with consideration to the heterogeneity of sources. Robust scientific techniques are in place for synthesizing disparate data sets and provide the essential contextual information that can orient market strategies. The Brainy Insights has extensive experience in data synthesis where the data passes through various stages:


Market Deduction & Formulation: The final stage comprises of assigning data points at appropriate market spaces so as to deduce feasible conclusions. Analyst perspective & subject matter expert based holistic form of market sizing coupled with industry analysis also plays a crucial role in this stage.
This stage involves in finalization of the market size and numbers that we have collected from data integration step. With data interpolation, it is made sure that there is no gap in the market data. Successful trend analysis is done by our analysts using extrapolation techniques, which provide the best possible forecasts for the market.
Data Validation & Market Feedback: Validation is the most important step in the process. Validation & re-validation via an intricately designed process helps us finalize data-points to be used for final calculations.

The Brainy Insights interacts with leading companies and experts of the concerned domain to develop the analyst team’s market understanding and expertise. It improves and substantiates every single data presented in the market reports. The data validation interview and discussion panels are typically composed of the most experienced industry members. The participants include, however, are not limited to:
Moreover, we always validate our data and findings through primary respondents from all the major regions we are working on.


Free Customization
Fortune 500 Clients
Free Yearly Update On Purchase Of Multi/Corporate License
Companies Served Till Date