- +1-315-215-1633
- sales@thebrainyinsights.com

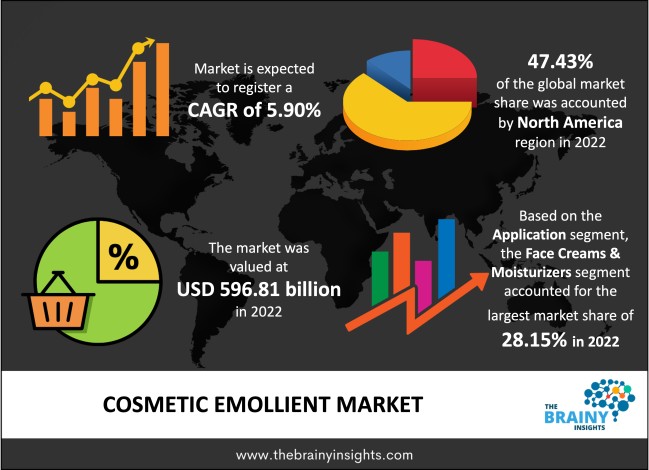
The global cosmetic emollient market was valued at USD 596.81 million in 2022, increasing at a CAGR of 5.90% from 2023 to 2032 and anticipated to reach USD 1058.76 million by 2032. Asia Pacific is expected to grow the fastest during the forecast period. Moreover, new product developments and increasing investments in the research and development of green emollient are also helping to stimulate the market growth over the forecast period.
Emollients are components in skin care products that soothe dryness or irritation. Healthcare providers frequently recommend emollients for skin conditions that cause dryness or scaling, like psoriasis and eczema. A substance that aids in softening, soothing, and increasing moisture levels, especially in the skin. Emollients may be used in a cream, lotion, gel, or ointment to prevent or treat dry, scaly, rough, itchy skin and other skin problems, such as burns or rashes. Emollients may also be utilized to help protect the skin against irritation. They may also be given by mouth to prevent or treat constipation by moistening & softening the stool. The emollients are utilized in lip care primarily as a moisturizing ingredient that helps to keep lips from losing water. They also help prevent dryness & scaling of the skin. It forms a protective barrier on the lips, which makes them soft, smooth & pliable throughout the day. It extends the durability of any colour applied over lipstick. Using lip care products containing emollients helps prevent dry, cracked, chapped lips or peeling of lip skin and keeps them moisturized throughout the day.
Get an overview of this study by requesting a free sample
For example, on 13 January 2023, Lubrizol Life Science Beauty (LLS Beauty) Company released SilSense Bio 5 emollient, a biodegradable silicone identical to D5 Cyclopentasiloxane that gives the same functionality & sensory feeling in leave-on formulations, specifically for sun care, hair care, and makeup formulations SilSense Bio 5 emollient, which is bio-alkane chemistry made entirely of vegetable oil, leaves the skin, hair, and scalp feeling light & non-greasy. This emollient is halal, vegan, and kosher compliant and has received COSMOS approval.
The increasing demand for multi-functional ingredients: The increasing demand for multi-functional components is one of the driving factors of the market growth. Furthermore, the growing customer awareness of the beauty and personal care is driving the demand for hair care products like conditioners, shampoos, hair masks, creams, and hair gels, which are also helping to boost the market growth. Moreover, the rising R&D investments by manufacturers, along with associated technological innovations in the field of ingredient processing and cost-effective production of organic personal care products, are promoting market growth over the forecast period. However, improving living standards and rapid urbanization will drive market growth in the forthcoming year.
The high product price: The high product price and less availability of some products hinder the market growth. Further, the increasing customer awareness of the potential health effects or side-effects associated with some of the most commonly utilized cosmetic ingredients, such as formaldehyde, parabens, triclosan, lead, aluminium, and phthalates are hindering the market growth. Moreover, parabens are chemicals derived from para-hydroxybenzoic acid (PHBA) and come in several forms, including ethylparaben, butylparaben, and methylparaben. Additionally, the increasing demand for natural products by customers across the globe due to the side effects of the chemical constituents is expected to impede market growth over the forecast period.
The increase in demand for cosmetics across the globe: The rise of halal beauty products, as well as natural and bio-based personal care products, are the driving factor of the market growth. Further, the rising living standards & fast urbanization are expected to propel the market growth over the forecast period. The cosmetic components contain preservatives, emulsifiers, thickeners, emulsifiers, emollients, and colour additives that perform washing, bleaching, moisturizing, and other functions when added to cosmetic goods. The inclusion of these compounds in cosmetic elements' anti-oxidant & anti-inflammatory features is also helping to drive market growth. Additionally, ingredients like copper peptide, hydroquinone, alpha-hydroxy acids, retinol, beta hydroxy acids, and kojic acid in skin care products are increasing. However, the increasing awareness of skincare products, product innovations, and increasing investments in emerging countries are also helping to boost market growth over the forecast period.
The regions analyzed for the market include Europe, South America, Asia Pacific, North America, the Middle East, and Africa. North America emerged as the largest global cosmetic emollient market, with a 47.43% market revenue share in 2022. North America dominates the cosmetic emollient market due to consumers' rapidly changing lifestyles and rising awareness about beauty and wellness. The rapidly changing lifestyle of consumers and increasing awareness about beauty and wellness are also helping boost the market growth in this region. However, increasing consumer spending on skin care cosmeceuticals and anti-ageing products also promotes market growth in this region. Asia Pacific is expected to grow the fastest during the forecast period due to the rising consumption from developing countries such as India, China, and Australia. Moreover, the prevalence of leading cosmetic and chemical manufacturing companies, coupled with the increasing disposable income of the population, is also helping to stimulate market growth in this region.
North America Region Cosmetic Emollient Market Share in 2022 - 47.43%
www.thebrainyinsights.com
Check the geographical analysis of this market by requesting a free sample
The application segment is divided into foundation creams, face creams & moisturizers, body creams & lotions, sunscreens, and others. The face creams & moisturizers segment dominated, with a market share of around 28.15% in 2022. This growth is attributed to the increased availability of specialized face creams. Additionally, the increasing adoption of personal care products like skin moisturizers and body lotions is also helping to boost the segment's market growth. Further, by 2032, the body creams & lotions segment will likely dominate the market due to the rapidly expanding cosmetics industry. Additionally, the increasing demand for body lotions & creams, coupled with the rising product developments and innovations by foot care body product manufacturers, are also helping to boost the market growth.
The type segment is divided into synthetic and natural. In 2022, the natural segment dominated the market with 58.19% and a revenue of USD 347.28 million. This growth is attributed to the increasing demand for green-labelled beauty products coupled with increasing customer willingness to pay premium prices. Moreover, the natural emollients include plant oils like cocoa butter, jojoba oil, shea butter, waxes & lanolins that help protect the skin from moisture loss while keeping softness. Additionally, natural emollients are organic substances that can reduce the appearance of fine lines & wrinkles, moisturize the skin to make it suppler and smoother, and help control flaking or scaling by creating a softening effect on the top layer of the skin. Further, by 2032, the synthetic segment will likely dominate the market due to increasing consumer awareness. Synthetic emollients are man-made ingredients that provide skin with a smooth & soft texture. Synthetic emollients may be used in cosmetic formulations to replace natural oils, which can cause irritation or clog pores. They also protect the skin's surface from water loss by forming an impermeable barrier on its outermost layer.
The distribution channel segment is divided into offline and online. In 2022, the offline segment dominated the market with 56.34% and a revenue of USD 336.24 million. This growth is attributed to the usage of various cosmetics products. Further, by 2032, the online segment will likely dominate the market due to the increasing availability of cosmetics and personal care products on e-commerce channels.
| Attribute | Description |
|---|---|
| Market Size | Revenue (USD Million) |
| Market size value in 2022 | USD 596.81 Million |
| Market size value in 2032 | USD 1058.76 Million |
| CAGR (2023 to 2032) | 5.90% |
| Historical data | 2019-2021 |
| Base Year | 2022 |
| Forecast | 2023-2032 |
| Regional Segments | The key regions are North America, South America, Europe, Asia Pacific, and Middle East & Africa. |
| Segments | Key Segments are application, type, distribution channel, and regions |
North America region emerged as the largest market for cosmetic emollient.
The market's growth will be influenced by the increasing demand for multi-functional ingredients.
The stringent regulations for personal care ingredients could hamper the market growth.
The increase in demand for cosmetics across the globe will provide huge opportunities to the market.
Key players Croda International Plc, Berg-Schmidt GmbH & Co. KG, Evonik Industries AG, Hallstar, Lubrizol Life Science Beauty, Biosynthetic Technologies, BASF SE, SEPPIC, Sasol Chemicals, Stephenson Group, and among others
1. Introduction
1.1. Objectives of the Study
1.2. Market Definition
1.3. Research Scope
1.4. Currency
1.5. Key Target Audience
2. Research Methodology and Assumptions
3. Executive Summary
4. Premium Insights
4.1. Porter’s Five Forces Analysis
4.2. Value Chain Analysis
4.3. Top Investment Pockets
4.3.1. Market Attractiveness Analysis By Application
4.3.2. Market Attractiveness Analysis By Type
4.3.3. Market Attractiveness Analysis By Distribution Channel
4.3.4. Market Attractiveness Analysis By Region
4.4. Industry Trends
5. Market Dynamics
5.1. Market Evaluation
5.2. Drivers
5.2.1. The rising awareness of organic products
5.2.2. The increasing R&D investments by manufacturers
5.2.3. The growing trend of online shopping
5.3. Restraints
5.3.1. The stringent regulations for personal care ingredients
5.3.2. The high product prices
5.4. Opportunities
5.4.1. The increase in demand for cosmetics across the globe
5.4.2. The increasing demand for isopropyl myristate
6. Global Cosmetic Emollient Market Analysis and Forecast, By Application
6.1. Segment Overview
6.2. Foundation Creams
6.3. Face Creams & Moisturizers
6.4. Body Creams & Lotions
6.5. Sunscreens
6.6. Others
7. Global Cosmetic Emollient Market Analysis and Forecast, By Type
7.1. Segment Overview
7.2. Synthetic
7.3. Natural
8. Global Cosmetic Emollient Market Analysis and Forecast, By Distribution Channel
8.1. Segment Overview
8.2. Offline
8.3. Online
9. Global Cosmetic Emollient Market Analysis and Forecast, By Regional Analysis
9.1. Segment Overview
9.2. North America
9.2.1. U.S.
9.2.2. Canada
9.2.3. Mexico
9.3. Europe
9.3.1. Germany
9.3.2. France
9.3.3. U.K.
9.3.4. Italy
9.3.5. Spain
9.4. Asia-Pacific
9.4.1. Japan
9.4.2. China
9.4.3. India
9.5. South America
9.5.1. Brazil
9.6. Middle East and Africa
9.6.1. UAE
9.6.2. South Africa
10. Global Cosmetic Emollient Market-Competitive Landscape
10.1. Overview
10.2. Market Share of Key Players in Global Cosmetic Emollient Market
10.2.1. Global Company Market Share
10.2.2. North America Company Market Share
10.2.3. Europe Company Market Share
10.2.4. APAC Company Market Share
10.3. Competitive Situations and Trends
10.3.1. Product Launches and Developments
10.3.2. Partnerships, Collaborations, and Agreements
10.3.3. Mergers & Acquisitions
10.3.4. Expansions
11. Company Profiles
11.1. Croda International Plc
11.1.1. Business Overview
11.1.2. Company Snapshot
11.1.3. Company Market Share Analysis
11.1.4. Company Product Portfolio
11.1.5. Recent Developments
11.1.6. SWOT Analysis
11.2. Berg-Schmidt GmbH & Co. KG
11.2.1. Business Overview
11.2.2. Company Snapshot
11.2.3. Company Market Share Analysis
11.2.4. Company Product Portfolio
11.2.5. Recent Developments
11.2.6. SWOT Analysis
11.3. Evonik Industries AG
11.3.1. Business Overview
11.3.2. Company Snapshot
11.3.3. Company Market Share Analysis
11.3.4. Company Product Portfolio
11.3.5. Recent Developments
11.3.6. SWOT Analysis
11.4. Hallstar
11.4.1. Business Overview
11.4.2. Company Snapshot
11.4.3. Company Market Share Analysis
11.4.4. Company Product Portfolio
11.4.5. Recent Developments
11.4.6. SWOT Analysis
11.5. Lubrizol Life Science Beauty
11.5.1. Business Overview
11.5.2. Company Snapshot
11.5.3. Company Market Share Analysis
11.5.4. Company Product Portfolio
11.5.5. Recent Developments
11.5.6. SWOT Analysis
11.6. Biosynthetic Technologies
11.6.1. Business Overview
11.6.2. Company Snapshot
11.6.3. Company Market Share Analysis
11.6.4. Company Product Portfolio
11.6.5. Recent Developments
11.6.6. SWOT Analysis
11.7. BASF SE
11.7.1. Business Overview
11.7.2. Company Snapshot
11.7.3. Company Market Share Analysis
11.7.4. Company Product Portfolio
11.7.5. Recent Developments
11.7.6. SWOT Analysis
11.8. SEPPIC
11.8.1. Business Overview
11.8.2. Company Snapshot
11.8.3. Company Market Share Analysis
11.8.4. Company Product Portfolio
11.8.5. Recent Developments
11.8.6. SWOT Analysis
11.9. Sasol Chemicals
11.9.1. Business Overview
11.9.2. Company Snapshot
11.9.3. Company Market Share Analysis
11.9.4. Company Product Portfolio
11.9.5. Recent Developments
11.9.6. SWOT Analysis
11.10. Stephenson Group
11.10.1. Business Overview
11.10.2. Company Snapshot
11.10.3. Company Market Share Analysis
11.10.4. Company Product Portfolio
11.10.5. Recent Developments
11.10.6. SWOT Analysis
List of Table
1. Global Cosmetic Emollient Market, By Application, 2019-2032 (USD Million)
2. Global Foundation Creams, Cosmetic Emollient Market, By Region, 2019-2032 (USD Million)
3. Global Face Creams & Moisturizers, Cosmetic Emollient Market, By Region, 2019-2032 (USD Million)
4. Global Body Creams & Lotions, Cosmetic Emollient Market, By Region, 2019-2032 (USD Million)
5. Global Sunscreens, Cosmetic Emollient Market, By Region, 2019-2032 (USD Million)
6. Global Others, Cosmetic Emollient Market, By Region, 2019-2032 (USD Million)
7. Global Cosmetic Emollient Market, By Type, 2019-2032 (USD Million)
8. Global Synthetic, Cosmetic Emollient Market, By Region, 2019-2032 (USD Million)
9. Global Natural, Cosmetic Emollient Market, By Region, 2019-2032 (USD Million)
10. Global Cosmetic Emollient Market, By Distribution Channel, 2019-2032 (USD Million)
11. Global Offline, Cosmetic Emollient Market, By Region, 2019-2032 (USD Million)
12. Global Online, Cosmetic Emollient Market, By Region, 2019-2032 (USD Million)
13. North America Cosmetic Emollient Market, By Application, 2019-2032 (USD Million)
14. North America Cosmetic Emollient Market, By Type, 2019-2032 (USD Million)
15. North America Cosmetic Emollient Market, By Distribution Channel, 2019-2032 (USD Million)
16. U.S. Cosmetic Emollient Market, By Application, 2019-2032 (USD Million)
17. U.S. Cosmetic Emollient Market, By Type, 2019-2032 (USD Million)
18. U.S. Cosmetic Emollient Market, By Distribution Channel, 2019-2032 (USD Million)
19. Canada Cosmetic Emollient Market, By Application, 2019-2032 (USD Million)
20. Canada Cosmetic Emollient Market, By Type, 2019-2032 (USD Million)
21. Canada Cosmetic Emollient Market, By Distribution Channel, 2019-2032 (USD Million)
22. Mexico Cosmetic Emollient Market, By Application, 2019-2032 (USD Million)
23. Mexico Cosmetic Emollient Market, By Type, 2019-2032 (USD Million)
24. Mexico Cosmetic Emollient Market, By Distribution Channel, 2019-2032 (USD Million)
25. Europe Cosmetic Emollient Market, By Application, 2019-2032 (USD Million)
26. Europe Cosmetic Emollient Market, By Type, 2019-2032 (USD Million)
27. Europe Cosmetic Emollient Market, By Distribution Channel, 2019-2032 (USD Million)
28. Germany Cosmetic Emollient Market, By Application, 2019-2032 (USD Million)
29. Germany Cosmetic Emollient Market, By Type, 2019-2032 (USD Million)
30. Germany Cosmetic Emollient Market, By Distribution Channel, 2019-2032 (USD Million)
31. France Cosmetic Emollient Market, By Application, 2019-2032 (USD Million)
32. France Cosmetic Emollient Market, By Type, 2019-2032 (USD Million)
33. France Cosmetic Emollient Market, By Distribution Channel, 2019-2032 (USD Million)
34. U.K. Cosmetic Emollient Market, By Application, 2019-2032 (USD Million)
35. U.K. Cosmetic Emollient Market, By Type, 2019-2032 (USD Million)
36. U.K. Cosmetic Emollient Market, By Distribution Channel, 2019-2032 (USD Million)
37. Italy Cosmetic Emollient Market, By Application, 2019-2032 (USD Million)
38. Italy Cosmetic Emollient Market, By Type, 2019-2032 (USD Million)
39. Italy Cosmetic Emollient Market, By Distribution Channel, 2019-2032 (USD Million)
40. Spain Cosmetic Emollient Market, By Application, 2019-2032 (USD Million)
41. Spain Cosmetic Emollient Market, By Type, 2019-2032 (USD Million)
42. Spain Cosmetic Emollient Market, By Distribution Channel, 2019-2032 (USD Million)
43. Asia Pacific Cosmetic Emollient Market, By Application, 2019-2032 (USD Million)
44. Asia Pacific Cosmetic Emollient Market, By Type, 2019-2032 (USD Million)
45. Asia Pacific Cosmetic Emollient Market, By Distribution Channel, 2019-2032 (USD Million)
46. Japan Cosmetic Emollient Market, By Application, 2019-2032 (USD Million)
47. Japan Cosmetic Emollient Market, By Type, 2019-2032 (USD Million)
48. Japan Cosmetic Emollient Market, By Distribution Channel, 2019-2032 (USD Million)
49. China Cosmetic Emollient Market, By Application, 2019-2032 (USD Million)
50. China Cosmetic Emollient Market, By Type, 2019-2032 (USD Million)
51. China Cosmetic Emollient Market, By Distribution Channel, 2019-2032 (USD Million)
52. India Cosmetic Emollient Market, By Application, 2019-2032 (USD Million)
53. India Cosmetic Emollient Market, By Type, 2019-2032 (USD Million)
54. India Cosmetic Emollient Market, By Distribution Channel, 2019-2032 (USD Million)
55. South America Cosmetic Emollient Market, By Application, 2019-2032 (USD Million)
56. South America Cosmetic Emollient Market, By Type, 2019-2032 (USD Million)
57. South America Cosmetic Emollient Market, By Distribution Channel, 2019-2032 (USD Million)
58. Brazil Cosmetic Emollient Market, By Application, 2019-2032 (USD Million)
59. Brazil Cosmetic Emollient Market, By Type, 2019-2032 (USD Million)
60. Brazil Cosmetic Emollient Market, By Distribution Channel, 2019-2032 (USD Million)
61. Middle East and Africa Cosmetic Emollient Market, By Application, 2019-2032 (USD Million)
62. Middle East and Africa Cosmetic Emollient Market, By Type, 2019-2032 (USD Million)
63. Middle East and Africa Cosmetic Emollient Market, By Distribution Channel, 2019-2032 (USD Million)
64. UAE Cosmetic Emollient Market, By Application, 2019-2032 (USD Million)
65. UAE Cosmetic Emollient Market, By Type, 2019-2032 (USD Million)
66. UAE Cosmetic Emollient Market, By Distribution Channel, 2019-2032 (USD Million)
67. South Africa Cosmetic Emollient Market, By Application, 2019-2032 (USD Million)
68. South Africa Cosmetic Emollient Market, By Type, 2019-2032 (USD Million)
69. South Africa Cosmetic Emollient Market, By Distribution Channel, 2019-2032 (USD Million)
List of Figures
1. Global Cosmetic Emollient Market Segmentation
2. Global Cosmetic Emollient Market: Research Methodology
3. Market Size Estimation Methodology: Bottom-Up Approach
4. Market Size Estimation Methodology: Top- Approach
5. Data Triangulation
6. Porter’s Five Forces Analysis
7. Value Chain Analysis
8. Global Cosmetic Emollient Market Attractiveness Analysis By Application
9. Global Cosmetic Emollient Market Attractiveness Analysis By Type
10. Global Cosmetic Emollient Market Attractiveness Analysis By Distribution Channel
11. Global Cosmetic Emollient Market Attractiveness Analysis By Region
12. Global Cosmetic Emollient Market: Dynamics
13. Global Cosmetic Emollient Market Share By Application (2023 & 2032)
14. Global Cosmetic Emollient Market Share By Type (2023 & 2032)
15. Global Cosmetic Emollient Market Share By Distribution Channel (2023 & 2032)
16. Global Cosmetic Emollient Market Share By Regions (2023 & 2032)
17. Global Cosmetic Emollient Market Share By Company (2022)
This study forecasts revenue at global, regional, and country levels from 2019 to 2032. The Brainy Insights has segmented the global cosmetic emollient based on below mentioned segments:
Global Cosmetic Emollient Market by Application:
Global Cosmetic Emollient Market by Type:
Global Cosmetic Emollient Market by Distribution Channel:
Global Cosmetic Emollient by Region:
Research has its special purpose to undertake marketing efficiently. In this competitive scenario, businesses need information across all industry verticals; the information about customer wants, market demand, competition, industry trends, distribution channels etc. This information needs to be updated regularly because businesses operate in a dynamic environment. Our organization, The Brainy Insights incorporates scientific and systematic research procedures in order to get proper market insights and industry analysis for overall business success. The analysis consists of studying the market from a miniscule level wherein we implement statistical tools which helps us in examining the data with accuracy and precision.
Our research reports feature both; quantitative and qualitative aspects for any market. Qualitative information for any market research process are fundamental because they reveal the customer needs and wants, usage and consumption for any product/service related to a specific industry. This in turn aids the marketers/investors in knowing certain perceptions of the customers. Qualitative research can enlighten about the different product concepts and designs along with unique service offering that in turn, helps define marketing problems and generate opportunities. On the other hand, quantitative research engages with the data collection process through interviews, e-mail interactions, surveys and pilot studies. Quantitative aspects for the market research are useful to validate the hypotheses generated during qualitative research method, explore empirical patterns in the data with the help of statistical tools, and finally make the market estimations.
The Brainy Insights offers comprehensive research and analysis, based on a wide assortment of factual insights gained through interviews with CXOs and global experts and secondary data from reliable sources. Our analysts and industry specialist assume vital roles in building up statistical tools and analysis models, which are used to analyse the data and arrive at accurate insights with exceedingly informative research discoveries. The data provided by our organization have proven precious to a diverse range of companies, facilitating them to address issues such as determining which products/services are the most appealing, whether or not customers use the product in the manner anticipated, the purchasing intentions of the market and many others.
Our research methodology encompasses an idyllic combination of primary and secondary initiatives. Key phases involved in this process are listed below:

The phase involves the gathering and collecting of market data and its related information with the help of different sources & research procedures.

The data procurement stage involves in data gathering and collecting through various data sources.
This stage involves in extensive research. These data sources includes:
Purchased Database: Purchased databases play a crucial role in estimating the market sizes irrespective of the domain. Our purchased database includes:
Primary Research: The Brainy Insights interacts with leading companies and experts of the concerned domain to develop the analyst team’s market understanding and expertise. It improves and substantiates every single data presented in the market reports. Primary research mainly involves in telephonic interviews, E-mail interactions and face-to-face interviews with the raw material providers, manufacturers/producers, distributors, & independent consultants. The interviews that we conduct provides valuable data on market size and industry growth trends prevailing in the market. Our organization also conducts surveys with the various industry experts in order to gain overall insights of the industry/market. For instance, in healthcare industry we conduct surveys with the pharmacists, doctors, surgeons and nurses in order to gain insights and key information of a medical product/device/equipment which the customers are going to usage. Surveys are conducted in the form of questionnaire designed by our own analyst team. Surveys plays an important role in primary research because surveys helps us to identify the key target audiences of the market. Additionally, surveys helps to identify the key target audience engaged with the market. Our survey team conducts the survey by targeting the key audience, thus gaining insights from them. Based on the perspectives of the customers, this information is utilized to formulate market strategies. Moreover, market surveys helps us to understand the current competitive situation of the industry. To be precise, our survey process typically involve with the 360 analysis of the market. This analytical process begins by identifying the prospective customers for a product or service related to the market/industry to obtain data on how a product/service could fit into customers’ lives.

Secondary Research: The secondary data sources includes information published by the on-profit organizations such as World bank, WHO, company fillings, investor presentations, annual reports, national government documents, statistical databases, blogs, articles, white papers and others. From the annual report, we analyse a company’s revenue to understand the key segment and market share of that organization in a particular region. We analyse the company websites and adopt the product mapping technique which is important for deriving the segment revenue. In the product mapping method, we select and categorize the products offered by the companies catering to domain specific market, deduce the product revenue for each of the companies so as to get overall estimation of the market size. We also source data and analyses trends based on information received from supply side and demand side intermediaries in the value chain. The supply side denotes the data gathered from supplier, distributor, wholesaler and the demand side illustrates the data gathered from the end customers for respective market domain.

The supply side for a domain specific market is analysed by:
The demand side for the market is estimated through:
In-house Library: Apart from these third-party sources, we have our in-house library of qualitative and quantitative information. Our in-house database includes market data for various industry and domains. These data are updated on regular basis as per the changing market scenario. Our library includes, historic databases, internal audit reports and archives.
Sometimes there are instances where there is no metadata or raw data available for any domain specific market. For those cases, we use our expertise to forecast and estimate the market size in order to generate comprehensive data sets. Our analyst team adopt a robust research technique in order to produce the estimates:
Data Synthesis: This stage involves the analysis & mapping of all the information obtained from the previous step. It also involves in scrutinizing the data for any discrepancy observed while data gathering related to the market. The data is collected with consideration to the heterogeneity of sources. Robust scientific techniques are in place for synthesizing disparate data sets and provide the essential contextual information that can orient market strategies. The Brainy Insights has extensive experience in data synthesis where the data passes through various stages:


Market Deduction & Formulation: The final stage comprises of assigning data points at appropriate market spaces so as to deduce feasible conclusions. Analyst perspective & subject matter expert based holistic form of market sizing coupled with industry analysis also plays a crucial role in this stage.
This stage involves in finalization of the market size and numbers that we have collected from data integration step. With data interpolation, it is made sure that there is no gap in the market data. Successful trend analysis is done by our analysts using extrapolation techniques, which provide the best possible forecasts for the market.
Data Validation & Market Feedback: Validation is the most important step in the process. Validation & re-validation via an intricately designed process helps us finalize data-points to be used for final calculations.

The Brainy Insights interacts with leading companies and experts of the concerned domain to develop the analyst team’s market understanding and expertise. It improves and substantiates every single data presented in the market reports. The data validation interview and discussion panels are typically composed of the most experienced industry members. The participants include, however, are not limited to:
Moreover, we always validate our data and findings through primary respondents from all the major regions we are working on.


Free Customization
Fortune 500 Clients
Free Yearly Update On Purchase Of Multi/Corporate License
Companies Served Till Date