- +1-315-215-1633
- sales@thebrainyinsights.com

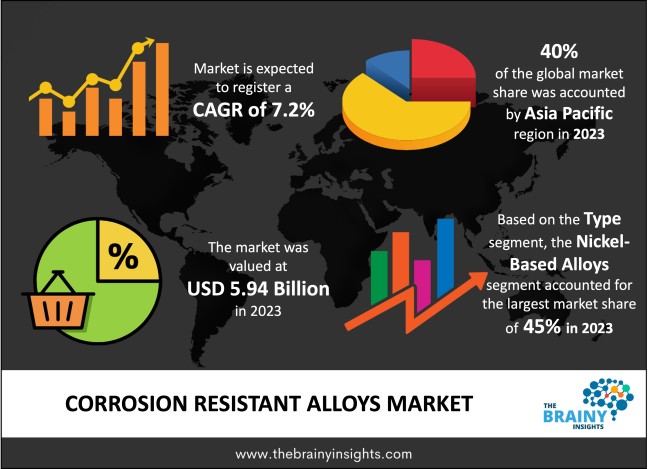
The corrosion resistant alloys market was estimated at around USD 5.94 billion in 2023, growing at a CAGR of nearly 7.2% during 2024-2033. The market is projected to reach approximately USD 11.91 billion by 2033. Regarding the environment, the government has made strict rules for industries to follow. Industries are encouraged to use materials that can withstand the corrosive environment and also emit toxic substances. Using these materials increases the life of machines, and the need to replace parts is also reduced.
Alloys that are corrosion-resistant are made of metals like nickel, cobalt, iron, etc. Together, these metals can offer more dependable more resistant to corrosion than other materials like carbon steel, which reduces the need for pricy repair and maintenance in industrial machinery, tools, and components. In addition to providing easy fabrication and welding, this alloy also reduces the risk of stress corrosion cracking. Some of the most durable structural materials with magnetic characteristics and electricity absorption are corrosion-resistant alloys. The resistance levels of corrosion-resistant alloys vary, and they offer reliable defense against a variety of corrosion processes, including bimetallic, pitting, intergranular, and atmospheric corrosion. Corrosion-resistant alloys are used in a variety of process sectors as well as the oil and gas sector for the fabrication and the transport of oil and corrosive gases.
Another important factor that is anticipated to contribute to the market's revenue growth in the future is the use of corrosion resistant alloys, which effectively prevent long-term corrosion in a variety of components that are routinely exposed to environments during oil and gas extraction and production activities. The use of corrosion-resistant alloys increases industry revenue because these materials reduce the need for repair and maintenance. This does not cause downtime in production, and production remains intact, which increases revenue generation. Efficiency matters a lot in the aerospace and automotive industries, and the biggest contribution in this is of the components. The use of components made from this material increases the performance of the machine, so this material is considered reliable.
Get an overview of this study by requesting a free sample
The COVID-19 pandemic has had a tremendous influence on world economies. COVID-19 has caused a number of challenges for a number of businesses. The COVID epidemic prompted the closure of numerous companies, including those in the mining, oil and gas, aerospace, chemicals and petrochemicals, automotive, and defense sectors. As a result of the decreased demand, this had an effect on the market for corrosion-resistant alloys. Lockdown was implemented in response to the COVID-19 pandemic, which decreased the production of corrosion-resistant alloys, had an effect on the global supply chain, and decreased demand for the market for such materials. The market for corrosion-resistant alloys experienced a drop in sales as a result of the COVID-19 pandemic. It is anticipated that following the COVID crisis, the corrosion resistant alloys market will rebound over the forecast period.
Oil and gas production, both onshore and offshore, frequently uses corrosion-resistant metals. Global oil production capacity is anticipated to increase by 5.9 billion barrels per day, according to the International Energy Agency (IEA). While OPEC adds 1.4 billion barrels per day to its daily capacity for crude oil and natural gas liquids by 2025, non-OPEC supply will increase by 4.5 billion barrels per day, boosting the market for corrosion resistance alloys. Approximately 22 billion barrels per day (Mbpd) of onshore oil production will be produced by 2035, according to Energy Transition Outlook (ETO) forecasts, and the volume of offshore gas production will rise by almost 20% by 2030. Therefore, it is predicted that the corrosion resistant alloys market will be driven by increased spending in the oil and gas industries.
Corrosion-resistant alloys are increasingly in demand from end use sectors, including automotive, aerospace, water treatment, oil & gas, and others. There are numerous uses for corrosion-resistant alloys in water treatment facilities. The Environmental Protection Agency (EPA) in the United States estimates that the cost of energy used to treat water by the country's water treatment facilities and drinking water systems is around $4 billion annually. Because of their exceptional qualities, including their remarkable resistance to corrosion and high temperatures, nickel-based alloys are utilized in steam turbine power plants, aircraft gas turbines, and high-strength parts in the automobile sector. In addition, cobalt-based alloys are heat, corrosion, and wear resistant and are utilized in hot gas turbines for these reasons. Additionally, the market is being driven by the extensive need for corrosion-resistant alloys in a number of industries, including the automotive, aerospace, oil & gas, and others.
The corrosion resistant alloys market is segmented into the type, and end use. Based on type, the market the nickel-based alloys segment dominated the market with a revenue share of around 45% in 2023. Nickel is the base metal used in items with a nickel content. Metals like iron, chromium, and molybdenum can be added to and employed in a variety of corrosive settings because they have strong resistance characteristics under difficult circumstances. Chemical & petrochemical industries, nuclear power systems, aircraft gas turbines, steam turbine power plants, medical applications, and automotive components are among the key industries that use nickel-based goods. These are among the strongest structural materials and have good magnetic and electrical conductivity qualities. The aerospace sector chooses nickel-based materials for their superior high temperature and high corrosion resistance, continual wear, and stress-rupture failures.
By end use, the oil & gas segment dominated the market with a share of 32% in 2023. Because more corrosion-resistant alloys are being used in processing facilities, drilling and extraction equipment, and mining tools, the oil and gas end-use segment is anticipated to experience strong revenue CAGR growth throughout the projected period. In severe oil and gas production settings that exert high pressure, temperature, and include chlorides, corrosion-resistant alloys are often employed. Onshore and offshore extraction activities are predicted to rapidly increase over the forecast period, as are deep-sea exploration efforts and technological developments in oil & gas equipment.
Asia-Pacific is anticipated to remain one of the most appealing markets throughout the projection period, and this region accounts for the majority revenue share of 40% in the market. The oil and gas equipment industry is expected to experience significant technological advancements between 2024 and 2033, leading market players are expected to invest heavily in R&D, and a variety of end-use industries, including aerospace and defense, the automotive industry, energy & power, are expected to experience rising demand. Additionally, the region's strong manufacturing presence is a significant element anticipated to fuel market revenue growth.
Asia-Pacific Region Corrosion Resistant Alloys Share in 2023 - 40%
www.thebrainyinsights.com
Check the geographical analysis of this market by requesting a free sample
The global Corrosion resistant alloys market is segmented as follows:
By Type
By End use
By Region/Geography
| Attribute | Description |
|---|---|
| Market Size | Revenue (USD Billion) |
| Market Size (2023) | USD 5.94 Billion |
| Corrosion Resistant Alloys Market CAGR | 7.2% |
| Report Coverage | Revenue estimation and forecast, company profile, competitive landscape, growth factors, and recent trends |
| Base Year | 2023 |
| Forecast | 2024-2033 |
| Regional scope | North America, Europe, Asia Pacific, Middle East & Africa, and Latin America |
| Segments Covered |
By Type |
As per The Brainy Insights, the size of the global corrosion resistant alloys market was valued at USD 5.94 billion in 2023 to USD 11.91 billion by 2033.
Global corrosion resistant alloys market is growing at a CAGR of 7.2% during the forecast period 2024-2033.
The market's growth will be influenced by increasing offshore and onshore oil and gas production.
The volatility in price of raw materials would hamper the market.
1. Introduction
1.1. Objectives of the Study
1.2. Market Definition
1.3. Research Scope
2. Research Methodology and Assumptions
3. Executive Summary
4. Premium Insights
4.1. Porter’s Five Forces Analysis
4.2. Value Chain Analysis
4.3. Top Investment Pockets
4.3.1. Market Attractiveness Analysis By Type
4.3.2. Market Attractiveness Analysis By End Use
4.4. Industry Trends
5. Market Dynamics
5.1. Market Evaluation
5.2. Drivers
5.2.1. Increasing offshore and onshore oil and gas production to accelerate the market’s growth
5.2.2. Growing demand from a variety of end user Industries to accelerate the market’s growth
5.3. Restrains
5.3.1. Volatility in price of raw materials would hamper the market
5.4. Opportunities
5.4.1. Technological developments
5.5. Challenges
5.5.1. High Production Costs
6. Global Corrosion Resistant Alloys Market Analysis and Forecast, By Type
6.1. Segment Overview
6.2. Iron-based Alloys
6.3. Nickel-based Alloys
6.4. Cobalt-based Alloys
6.5. Others
7. Global Corrosion Resistant Alloys Market Analysis and Forecast, By End Use
7.1. Segment Overview
7.2. Oil & Gas
7.3. Automotive & Transportation
7.4. Aerospace & Defense
7.5. Energy & Power
7.6. Industrial
7.7. Others
8. Global Corrosion Resistant Alloys Market Analysis and Forecast, By Regional Analysis
8.1. Segment Overview
8.2. North America
8.2.1. U.S.
8.2.2. Canada
8.2.3. Mexico
8.3. Europe
8.3.1. Germany
8.3.2. France
8.3.3. U.K.
8.3.4. Italy
8.3.5. Spain
8.3.6. Rest of Europe
8.4. Asia-Pacific
8.4.1. Japan
8.4.2. China
8.4.3. India
8.4.4. Australia
8.4.5. South Korea
8.4.6. Rest of Asia-Pacific
8.5. South America
8.5.1. Brazil
8.5.2. Argentina
8.5.3. Rest of South America
8.6. Middle East and Africa
8.6.1. UAE
8.6.2. South Africa
8.6.3. Egypt
8.6.4. Kuwait
8.6.5. Saudi Arabia
8.6.6. Rest of Middle East & Africa
9. Global Corrosion Resistant Alloys Market-Competitive Landscape
9.1. Overview
9.2. Market Share of Key Players in the Corrosion resistant alloys market
9.2.1. Global Company Market Share
9.2.2. North America Company Market Share
9.2.3. Europe Company Market Share
9.2.4. APAC Company Market Share
9.3. Competitive Situations and Trends
9.3.1. Type Launches and Developments
9.3.2. Partnerships, Collaborations, and Agreements
9.3.3. Mergers & Acquisitions
9.3.4. Expansions
10. Company Profiles
10.1. Special Metals Corporation
10.1.1. Business Overview
10.1.2. Company Snapshot
10.1.3. Company Market Share Analysis
10.1.4. Company End Use Portfolio
10.1.5. Recent Developments
10.1.6. SWOT Analysis
10.2. Corrosion Resistant Alloys, L.P.
10.2.1. Business Overview
10.2.2. Company Snapshot
10.2.3. Company Market Share Analysis
10.2.4. Company End Use Portfolio
10.2.5. Recent Developments
10.2.6. SWOT Analysis
10.3. Advanced Metallurgical Group N.V.
10.3.1. Business Overview
10.3.2. Company Snapshot
10.3.3. Company Market Share Analysis
10.3.4. Company End Use Portfolio
10.3.5. Recent Developments
10.3.6. SWOT Analysis
10.4. Hitachi Metals
10.4.1. Business Overview
10.4.2. Company Snapshot
10.4.3. Company Market Share Analysis
10.4.4. Company End Use Portfolio
10.4.5. Recent Developments
10.4.6. SWOT Analysis
10.5. VDM Metals
10.5.1. Business Overview
10.5.2. Company Snapshot
10.5.3. Company Market Share Analysis
10.5.4. Company End Use Portfolio
10.5.5. Recent Developments
10.5.6. SWOT Analysis
10.6. Nippon Yakin Kogyo Co., Ltd.
10.6.1. Business Overview
10.6.2. Company Snapshot
10.6.3. Company Market Share Analysis
10.6.4. Company End Use Portfolio
10.6.5. Recent Developments
10.6.6. SWOT Analysis
10.7. MMC Superalloy, Ltd.
10.7.1. Business Overview
10.7.2. Company Snapshot
10.7.3. Company Market Share Analysis
10.7.4. Company End Use Portfolio
10.7.5. Recent Developments
10.7.6. SWOT Analysis
10.8. Haynes International, Inc.
10.8.1. Business Overview
10.8.2. Company Snapshot
10.8.3. Company Market Share Analysis
10.8.4. Company End Use Portfolio
10.8.5. Recent Developments
10.8.6. SWOT Analysis
10.9. Eramet S.A.
10.9.1. Business Overview
10.9.2. Company Snapshot
10.9.3. Company Market Share Analysis
10.9.4. Company End Use Portfolio
10.9.5. Recent Developments
10.9.6. SWOT Analysis
10.10. Carpenter Technology Corporation
10.10.1. Business Overview
10.10.2. Company Snapshot
10.10.3. Company Market Share Analysis
10.10.4. Company End Use Portfolio
10.10.5. Recent Developments
10.10.6. SWOT Analysis
List of Table
1. Global Corrosion Resistant Alloys Market, By Type, 2020-2033(USD Billion)
2. Global Iron-based Alloys Corrosion Resistant Alloys Market, By Region, 2020-2033(USD Billion)
3. Global Nickel-based Alloys Corrosion Resistant Alloys Market, By Region, 2020-2033(USD Billion)
4. Global Cobalt-based Alloys Corrosion Resistant Alloys Market, By Region, 2020-2033(USD Billion)
5. Global Others Corrosion Resistant Alloys Market, By Region, 2020-2033(USD Billion)
6. Global Corrosion Resistant Alloys Market, By End Use, 2020-2033(USD Billion)
7. Global Oil & Gas Corrosion Resistant Alloys Market, By Region, 2020-2033(USD Billion)
8. Global Automotive & Transportation Corrosion Resistant Alloys Market, By Region, 2020-2033(USD Billion)
9. Global Aerospace & Defense Corrosion Resistant Alloys Market, By Region, 2020-2033(USD Billion)
10. Global Energy & Power Corrosion Resistant Alloys Market, By Region, 2020-2033(USD Billion)
11. Global Industrial Corrosion Resistant Alloys Market, By Region, 2020-2033(USD Billion)
12. Global Others Corrosion Resistant Alloys Market, By Region, 2020-2033(USD Billion)
13. Global Corrosion Resistant Alloys Market, By Region, 2020-2033(USD Billion)
14. Global Corrosion Resistant Alloys Market, By North America, 2020-2033(USD Billion)
15. North America Corrosion Resistant Alloys Market, By Type, 2020-2033(USD Billion)
16. North America Corrosion Resistant Alloys Market, By End Use, 2020-2033(USD Billion)
17. U.S. Corrosion Resistant Alloys Market, By Type, 2020-2033(USD Billion)
18. U.S. Corrosion Resistant Alloys Market, By End Use, 2020-2033(USD Billion)
19. Canada Corrosion Resistant Alloys Market, By Type, 2020-2033(USD Billion)
20. Canada Corrosion Resistant Alloys Market, By End Use, 2020-2033(USD Billion)
21. Mexico Corrosion Resistant Alloys Market, By Type, 2020-2033(USD Billion)
22. Mexico Corrosion Resistant Alloys Market, By End Use, 2020-2033(USD Billion)
23. Europe Corrosion Resistant Alloys Market, By Type, 2020-2033(USD Billion)
24. Europe Corrosion Resistant Alloys Market, By End Use, 2020-2033(USD Billion)
25. Germany Corrosion Resistant Alloys Market, By Type, 2020-2033(USD Billion)
26. Germany Corrosion Resistant Alloys Market, By End Use, 2020-2033(USD Billion)
27. France Corrosion Resistant Alloys Market, By Type, 2020-2033(USD Billion)
28. France Corrosion Resistant Alloys Market, By End Use, 2020-2033(USD Billion)
29. U.K. Corrosion Resistant Alloys Market, By Type, 2020-2033(USD Billion)
30. U.K. Corrosion Resistant Alloys Market, By End Use, 2020-2033(USD Billion)
31. Italy Corrosion Resistant Alloys Market, By Type, 2020-2033(USD Billion)
32. Italy Corrosion Resistant Alloys Market, By End Use, 2020-2033(USD Billion)
33. Spain Corrosion Resistant Alloys Market, By Type, 2020-2033(USD Billion)
34. Spain Corrosion Resistant Alloys Market, By End Use, 2020-2033(USD Billion)
35. Rest of Europe Corrosion Resistant Alloys Market, By Type, 2020-2033(USD Billion)
36. Rest of Europe Corrosion Resistant Alloys Market, By End Use, 2020-2033(USD Billion)
37. Asia Pacific Corrosion Resistant Alloys Market, By Type, 2020-2033(USD Billion)
38. Asia Pacific Corrosion Resistant Alloys Market, By End Use, 2020-2033(USD Billion)
39. Japan Corrosion Resistant Alloys Market, By Type, 2020-2033(USD Billion)
40. Japan Corrosion Resistant Alloys Market, By End Use, 2020-2033(USD Billion)
41. China Corrosion Resistant Alloys Market, By Type, 2020-2033(USD Billion)
42. China Corrosion Resistant Alloys Market, By End Use, 2020-2033(USD Billion)
43. India Corrosion Resistant Alloys Market, By Type, 2020-2033(USD Billion)
44. India Corrosion Resistant Alloys Market, By End Use, 2020-2033(USD Billion)
45. Australia Corrosion Resistant Alloys Market, By Type, 2020-2033(USD Billion)
46. Australia Corrosion Resistant Alloys Market, By End Use, 2020-2033(USD Billion)
47. South Korea Corrosion Resistant Alloys Market, By Type, 2020-2033(USD Billion)
48. South Korea Corrosion Resistant Alloys Market, By End Use, 2020-2033(USD Billion)
49. Rest of Asia-Pacific Corrosion Resistant Alloys Market, By Type, 2020-2033(USD Billion)
50. Rest of Asia-Pacific Corrosion Resistant Alloys Market, By End Use, 2020-2033(USD Billion)
51. South America Corrosion Resistant Alloys Market, By Type, 2020-2033(USD Billion)
52. South America Corrosion Resistant Alloys Market, By End Use, 2020-2033(USD Billion)
53. Brazil Corrosion Resistant Alloys Market, By Type, 2020-2033(USD Billion)
54. Brazil Corrosion Resistant Alloys Market, By End Use, 2020-2033(USD Billion)
55. Argentina Corrosion Resistant Alloys Market, By Type, 2020-2033(USD Billion)
56. Argentina Corrosion Resistant Alloys Market, By End Use, 2020-2033(USD Billion)
57. Rest of Latin America Corrosion Resistant Alloys Market, By Type, 2020-2033(USD Billion)
58. Rest of Latin America Corrosion Resistant Alloys Market, By End Use, 2020-2033(USD Billion)
59. Middle East and Africa Corrosion Resistant Alloys Market, By Type, 2020-2033(USD Billion)
60. Middle East and Africa Corrosion Resistant Alloys Market, By End Use, 2020-2033(USD Billion)
61. UAE Corrosion Resistant Alloys Market, By Type, 2020-2033(USD Billion)
62. UAE Corrosion Resistant Alloys Market, By End Use, 2020-2033(USD Billion)
63. South Africa Corrosion Resistant Alloys Market, By Type, 2020-2033(USD Billion)
64. South Africa Corrosion Resistant Alloys Market, By End Use, 2020-2033(USD Billion)
65. Egypt Corrosion Resistant Alloys Market, By Type, 2020-2033(USD Billion)
66. Egypt Corrosion Resistant Alloys Market, By End Use, 2020-2033(USD Billion)
67. Kuwait Corrosion Resistant Alloys Market, By Type, 2020-2033(USD Billion)
68. Kuwait Corrosion Resistant Alloys Market, By End Use, 2020-2033(USD Billion)
69. Saudi Arabia Corrosion Resistant Alloys Market, By Type, 2020-2033(USD Billion)
70. Saudi Arabia Corrosion Resistant Alloys Market, By End Use, 2020-2033(USD Billion)
71. Rest of Middle East Corrosion Resistant Alloys Market, By Type, 2020-2033(USD Billion)
72. Rest of Middle East Corrosion Resistant Alloys Market, By End Use, 2020-2033(USD Billion)
List of Figures
1. Global Corrosion Resistant Alloys Market Segmentation
2. Corrosion Resistant Alloys Market: Research Methodology
3. Market Size Estimation Methodology: Bottom-Up Approach
4. Market Size Estimation Methodology: Top-Down Approach
5. Data Triangulation
6. Porter’s Five Forces Analysis
7. Value Chain Analysis
8. Global Corrosion Resistant Alloys Market Attractiveness Analysis By Type
9. Global Corrosion Resistant Alloys Market Attractiveness Analysis By End Use
10. Global Corrosion Resistant Alloys Market Attractiveness Analysis By Region
11. Global Corrosion Resistant Alloys Market: Dynamics
12. Global Corrosion Resistant Alloys Market Share By Type (2023 & 2033)
13. Global Corrosion Resistant Alloys Market Share By End Use (2023 & 2033)
14. Global Corrosion Resistant Alloys Market Share by Regions (2023 & 2033)
15. Global Corrosion Resistant Alloys Market Share by Company (2023)
This study forecasts revenue at global, regional, and country levels from 2020 to 2033. The Brainy Insights has segmented the global corrosion resistant alloys market based on below mentioned segments:
Global Corrosion Resistant Alloys Market by Type:
Global Corrosion Resistant Alloys Market by End Use:
Global Corrosion Resistant Alloys Market by Region:
Research has its special purpose to undertake marketing efficiently. In this competitive scenario, businesses need information across all industry verticals; the information about customer wants, market demand, competition, industry trends, distribution channels etc. This information needs to be updated regularly because businesses operate in a dynamic environment. Our organization, The Brainy Insights incorporates scientific and systematic research procedures in order to get proper market insights and industry analysis for overall business success. The analysis consists of studying the market from a miniscule level wherein we implement statistical tools which helps us in examining the data with accuracy and precision.
Our research reports feature both; quantitative and qualitative aspects for any market. Qualitative information for any market research process are fundamental because they reveal the customer needs and wants, usage and consumption for any product/service related to a specific industry. This in turn aids the marketers/investors in knowing certain perceptions of the customers. Qualitative research can enlighten about the different product concepts and designs along with unique service offering that in turn, helps define marketing problems and generate opportunities. On the other hand, quantitative research engages with the data collection process through interviews, e-mail interactions, surveys and pilot studies. Quantitative aspects for the market research are useful to validate the hypotheses generated during qualitative research method, explore empirical patterns in the data with the help of statistical tools, and finally make the market estimations.
The Brainy Insights offers comprehensive research and analysis, based on a wide assortment of factual insights gained through interviews with CXOs and global experts and secondary data from reliable sources. Our analysts and industry specialist assume vital roles in building up statistical tools and analysis models, which are used to analyse the data and arrive at accurate insights with exceedingly informative research discoveries. The data provided by our organization have proven precious to a diverse range of companies, facilitating them to address issues such as determining which products/services are the most appealing, whether or not customers use the product in the manner anticipated, the purchasing intentions of the market and many others.
Our research methodology encompasses an idyllic combination of primary and secondary initiatives. Key phases involved in this process are listed below:

The phase involves the gathering and collecting of market data and its related information with the help of different sources & research procedures.

The data procurement stage involves in data gathering and collecting through various data sources.
This stage involves in extensive research. These data sources includes:
Purchased Database: Purchased databases play a crucial role in estimating the market sizes irrespective of the domain. Our purchased database includes:
Primary Research: The Brainy Insights interacts with leading companies and experts of the concerned domain to develop the analyst team’s market understanding and expertise. It improves and substantiates every single data presented in the market reports. Primary research mainly involves in telephonic interviews, E-mail interactions and face-to-face interviews with the raw material providers, manufacturers/producers, distributors, & independent consultants. The interviews that we conduct provides valuable data on market size and industry growth trends prevailing in the market. Our organization also conducts surveys with the various industry experts in order to gain overall insights of the industry/market. For instance, in healthcare industry we conduct surveys with the pharmacists, doctors, surgeons and nurses in order to gain insights and key information of a medical product/device/equipment which the customers are going to usage. Surveys are conducted in the form of questionnaire designed by our own analyst team. Surveys plays an important role in primary research because surveys helps us to identify the key target audiences of the market. Additionally, surveys helps to identify the key target audience engaged with the market. Our survey team conducts the survey by targeting the key audience, thus gaining insights from them. Based on the perspectives of the customers, this information is utilized to formulate market strategies. Moreover, market surveys helps us to understand the current competitive situation of the industry. To be precise, our survey process typically involve with the 360 analysis of the market. This analytical process begins by identifying the prospective customers for a product or service related to the market/industry to obtain data on how a product/service could fit into customers’ lives.

Secondary Research: The secondary data sources includes information published by the on-profit organizations such as World bank, WHO, company fillings, investor presentations, annual reports, national government documents, statistical databases, blogs, articles, white papers and others. From the annual report, we analyse a company’s revenue to understand the key segment and market share of that organization in a particular region. We analyse the company websites and adopt the product mapping technique which is important for deriving the segment revenue. In the product mapping method, we select and categorize the products offered by the companies catering to domain specific market, deduce the product revenue for each of the companies so as to get overall estimation of the market size. We also source data and analyses trends based on information received from supply side and demand side intermediaries in the value chain. The supply side denotes the data gathered from supplier, distributor, wholesaler and the demand side illustrates the data gathered from the end customers for respective market domain.

The supply side for a domain specific market is analysed by:
The demand side for the market is estimated through:
In-house Library: Apart from these third-party sources, we have our in-house library of qualitative and quantitative information. Our in-house database includes market data for various industry and domains. These data are updated on regular basis as per the changing market scenario. Our library includes, historic databases, internal audit reports and archives.
Sometimes there are instances where there is no metadata or raw data available for any domain specific market. For those cases, we use our expertise to forecast and estimate the market size in order to generate comprehensive data sets. Our analyst team adopt a robust research technique in order to produce the estimates:
Data Synthesis: This stage involves the analysis & mapping of all the information obtained from the previous step. It also involves in scrutinizing the data for any discrepancy observed while data gathering related to the market. The data is collected with consideration to the heterogeneity of sources. Robust scientific techniques are in place for synthesizing disparate data sets and provide the essential contextual information that can orient market strategies. The Brainy Insights has extensive experience in data synthesis where the data passes through various stages:


Market Deduction & Formulation: The final stage comprises of assigning data points at appropriate market spaces so as to deduce feasible conclusions. Analyst perspective & subject matter expert based holistic form of market sizing coupled with industry analysis also plays a crucial role in this stage.
This stage involves in finalization of the market size and numbers that we have collected from data integration step. With data interpolation, it is made sure that there is no gap in the market data. Successful trend analysis is done by our analysts using extrapolation techniques, which provide the best possible forecasts for the market.
Data Validation & Market Feedback: Validation is the most important step in the process. Validation & re-validation via an intricately designed process helps us finalize data-points to be used for final calculations.

The Brainy Insights interacts with leading companies and experts of the concerned domain to develop the analyst team’s market understanding and expertise. It improves and substantiates every single data presented in the market reports. The data validation interview and discussion panels are typically composed of the most experienced industry members. The participants include, however, are not limited to:
Moreover, we always validate our data and findings through primary respondents from all the major regions we are working on.


Free Customization
Fortune 500 Clients
Free Yearly Update On Purchase Of Multi/Corporate License
Companies Served Till Date