- +1-315-215-1633
- sales@thebrainyinsights.com

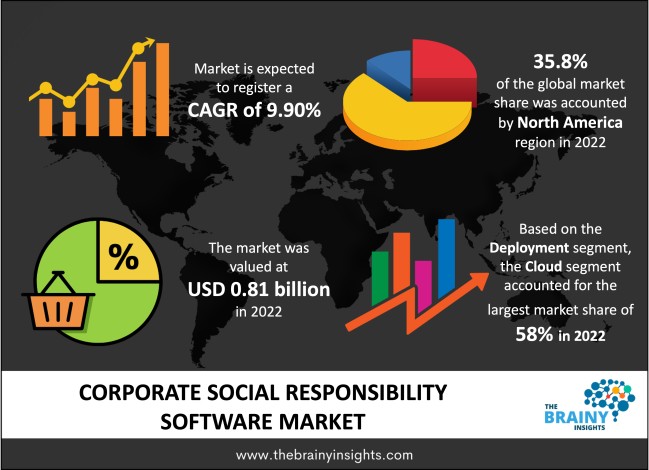
The global corporate social responsibility software market was valued at USD 0.81 Billion in 2022 and growing at a CAGR of 9.90% from 2023 to 2032. The market is expected to reach USD 2.10 Billion by 2032. Corporate social responsibility seeks to set a connection between society and companies. Therefore, companies must prioritize internal and external measurements of corporate social responsibility, like HR management, local communities, security & health, human rights, environmental effect management, business partners, etc. Elements like the rising demand to create better brand importance across companies and the increasing demand among organizations to improve their business practices & policies are pushing the need for corporate social responsibility software and services.
Corporate Social Responsibility is a management concept in which companies incorporate social and environmental problems into their business operations and stakeholder interactions. CSR is usually understood as the method via which a company performs a balance of ecological, monetary, and social imperatives while simultaneously addressing the expectations of shareholders and stakeholders. In this sense, it is essential to determine Corporate Social Responsibility, a strategic business management concept, and sponsorships, charity, or philanthropy. It can also help reduce poverty, enhancing a company's reputation and maintaining its brand. A properly executed CSR concept can get along a variety of competitive benefits, like improved access to capital and markets, operating cost savings, high sales and profits, efficient human resource base, improved productivity and quality, enhanced customer loyalty, improved brand image and reputation, better decision making and risk management techniques. The increasing acceptance of Corporate Social Responsibility among software developers will get additional returns for organizations and the IT landscape. CSR enables organizations to form client trust and stick to values and industry norms. It also makes businesses more elegant, allowing them to meet changing consumer needs sustainably and effectively. Here are some instances of CSR usefulness in software development. First, organizations can improve customer satisfaction, lower risk, and boost productivity. A software solution to Corporate Social Responsibility challenges can support companies in creating a more influential culture and conducting employee engagement. Likewise, CSR management software allows organizations to grow their impact-to-giving ratio.
Additionally, in-house groups need help with organizational work and everyday paperwork. They also require accomplishing adherence to rules. CSR software solutions stop hiring more resources and help organizations decrease risk. Choosing a CSR tool is crucial as only some companies have the same lifecycle phase. Selecting the right software relies on the company's specific requirements. Numerous companies are involved in tasks demanding different elements and functionality. A software suite will need to be flexible and be able to adjust a variety of different phases.
Get an overview of this study by requesting a free sample
In December 2019, Benevity Inc. established Benevity mobile app, permitting companies to develop their CSR schedules. This app is available for iOS and Android and further promotes inclusive connections with the company’s workers, empowering their people to do better.
High Employee Retention Rates- Employees find a sense of fulfilment in working for a socially responsible firm, which reflects the corporate social responsibility efforts that make it less likely for them to leave. Recent research has revealed that 96% of workers employed by purpose-driven companies say they are more committed to their employer. In an age where employee retention is becoming increasingly complex, the CSR activities of a company can make a real difference in its ability to recruit and retain the best talent.
The Client Can Become Impatient- Everyone will undoubtedly value adopting a corporate social responsibility program for the business at the beginning. Even it can achieve popularity on the market for being connected with an exceptional reason. Regardless, if the program does not deliver instant results, individuals might suppose this is nothing but a Public Relations stunt. That won’t help the business’s track record.
It Enhances the Value and Earnings- An entity's corporate social responsibility strategy can result in cost savings from energy-efficient practices like waste reuse. This can also bolster its image among stakeholders, such as the media, investors, and the public, through increased transparency and responsibility. This, in turn, can lead to more shareholders utilizing similar approaches, potentially resulting in an increased value of the company's shares and easier access to capital.
The regions analyzed for the market include North America, Europe, South America, Asia Pacific, the Middle East, and Africa. North America emerged as the largest market for the global corporate social responsibility market, with a 35.8% share of the market revenue in 2022.
North America dominated the market share. It is expected to grow over the projection time owing to the rising focus of businesses on their social duties and actions. Moreover, the shift is mainly due to the increasing count of United States residents performing their operations ethically and socially from the corporate sector, which will likely push the development of the region's corporate social responsibility software industry.
North America Region Corporate Social Responsibility Software Market Share in 2022 - 35.8%
www.thebrainyinsights.com
Check the geographical analysis of this market by requesting a free sample
The deployment segment is divided into cloud-based and on-premises. The cloud segment dominated the market, with a share of around 58% in 2022. The growth of this segment is mainly due to the rising availability of software in a practical and flexible module through the cloud. It also provides robust data security and partnership among different stakeholders.
The application segment is divided into small-medium enterprise and large enterprise. The large enterprise segment dominated the market, with a share of around 56% in 2022. Large enterprises are more likely to have a formal Corporate Social Responsibility program as they have a more substantial number of employees and stakeholders. These companies are more evident and proactive in documenting their social responsibility activities than smaller or medium-sized businesses. The SMEs segment is expected to grow the fastest over the forecast years.
| Attribute | Description |
|---|---|
| Market Size | Revenue (USD Billion) |
| Market size value in 2022 | USD 0.81 Billion |
| Market size value in 2032 | USD 2.10 Billion |
| CAGR (2023 to 2032) | 9.90% |
| Historical data | 2019-2021 |
| Base Year | 2022 |
| Forecast | 2023-2032 |
| Regional Segments | The regions analyzed for the market are Asia Pacific, Europe, South America, North America, and Middle East & Africa. Furthermore, the regions are further analyzed at the country level. |
| Segments | Deployment, Application |
As per The Brainy Insights, the size of the global corporate social responsibility software market was valued at USD 0.81 billion in 2022to USD 2.10 billion by 2032.
The global corporate social responsibility software market is growing at a CAGR of 9.90% during the forecast period 2023-2032.
North America region emerged as the largest market for the global corporate social responsibility software market.
High employee retention rates which propel market growth.
1. Introduction
1.1. Objectives of the Study
1.2. Market Definition
1.3. Research Scope
1.4. Currency
1.5. Key Target Audience
2. Research Methodology and Assumptions
3. Executive Summary
4. Premium Insights
4.1. Porter’s Five Forces Analysis
4.2. Value Chain Analysis
4.3. Top Investment Pockets
4.3.1. Market Attractiveness Analysis by Deployment
4.3.2. Market Attractiveness Analysis by Application
4.3.3. Market Attractiveness Analysis by Region
4.4. Industry Trends
5. Market Dynamics
5.1. Market Evaluation
5.2. Drivers
5.2.1. High Employee Retention Rates
5.3. Restraints
5.3.1. The Client Can Become Impatient
5.4. Opportunities
5.4.1. It Enhances the Value and Earnings for The Market Growth
6. Global Corporate Social Responsibility Software Market Analysis and Forecast, By Deployment:
6.1. Segment Overview
6.2. Cloud-Based
6.3. On-Premises
7. Global Corporate Social Responsibility Software Market Analysis and Forecast, By Application
7.1. Segment Overview
7.2. Small-Medium Enterprise
7.3. Large Enterprise
8. Global Corporate Social Responsibility Software Market Analysis and Forecast, By Regional Analysis
8.1. Segment Overview
8.2. North America
8.2.1. U.S.
8.2.2. Canada
8.2.3. Mexico
8.3. Europe
8.3.1. Germany
8.3.2. France
8.3.3. U.K.
8.3.4. Italy
8.3.5. Spain
8.4. Asia-Pacific
8.4.1. Japan
8.4.2. China
8.4.3. India
8.5. South America
8.5.1. Brazil
8.6. Middle East and Africa
8.6.1. UAE
8.6.2. South Africa
9. Global Corporate Social Responsibility Software Market-Competitive Landscape
9.1. Overview
9.2. Market Share of Key Players in the Corporate Social Responsibility Software Market
9.2.1. Global Company Market Share
9.2.2. North America Company Market Share
9.2.3. Europe Company Market Share
9.2.4. APAC Company Market Share
9.3. Competitive Situations and Trends
9.3.1. Product Launches and Developments
9.3.2. Partnerships, Collaborations, and Agreements
9.3.3. Mergers & Acquisitions
9.3.4. Expansions
10. Company Profiles
10.1. Benevity, Inc.
10.1.1. Business Overview
10.1.2. Company Snapshot
10.1.3. Company Market Share Analysis
10.1.4. Company Product Portfolio
10.1.5. Recent Developments
10.1.6. SWOT Analysis
10.2. CyberSWIFT Infotech Pvt. Ltd.
10.2.1. Business Overview
10.2.2. Company Snapshot
10.2.3. Company Market Share Analysis
10.2.4. Company Product Portfolio
10.2.5. Recent Developments
10.2.6. SWOT Analysis
10.3. Goodera
10.3.1. Business Overview
10.3.2. Company Snapshot
10.3.3. Company Market Share Analysis
10.3.4. Company Product Portfolio
10.3.5. Recent Developments
10.3.6. SWOT Analysis
10.4. iPoint-systems gmbh.
10.4.1. Business Overview
10.4.2. Company Snapshot
10.4.3. Company Market Share Analysis
10.4.4. Company Product Portfolio
10.4.5. Recent Developments
10.4.6. SWOT Analysis
10.5. NAVEX, Inc.
10.5.1. Business Overview
10.5.2. Company Snapshot
10.5.3. Company Market Share Analysis
10.5.4. Company Product Portfolio
10.5.5. Recent Developments
10.5.6. SWOT Analysis
10.6. Salesforce, Inc.
10.6.1. Business Overview
10.6.2. Company Snapshot
10.6.3. Company Market Share Analysis
10.6.4. Company Product Portfolio
10.6.5. Recent Developments
10.6.6. SWOT Analysis
10.7. Tennaxia.
10.7.1. Business Overview
10.7.2. Company Snapshot
10.7.3. Company Market Share Analysis
10.7.4. Company Product Portfolio
10.7.5. Recent Developments
10.7.6. SWOT Analysis
10.8. Vee Technologies
10.8.1. Business Overview
10.8.2. Company Snapshot
10.8.3. Company Market Share Analysis
10.8.4. Company Product Portfolio
10.8.5. Recent Developments
10.8.6. SWOT Analysis
10.9. Wolters Kluwer N.V.
10.9.1. Business Overview
10.9.2. Company Snapshot
10.9.3. Company Market Share Analysis
10.9.4. Company Product Portfolio
10.9.5. Recent Developments
10.9.6. SWOT Analysis
10.10. Your cause From Blackbaud
10.10.1. Business Overview
10.10.2. Company Snapshot
10.10.3. Company Market Share Analysis
10.10.4. Company Product Portfolio
10.10.5. Recent Developments
10.10.6. SWOT Analysis
List of Table
1. Global Corporate Social Responsibility Software Market, By Deployment, 2019-2032 (USD Billion)
2. Global Cloud-Based Corporate Social Responsibility Software Market, By Region, 2019-2032 (USD Billion)
3. Global On-Premises Corporate Social Responsibility Software Market, By Region, 2019-2032 (USD Billion)
4. Global Corporate Social Responsibility Software Market, By Application, 2019-2032 (USD Billion)
5. Global Small-Medium Enterprise Corporate Social Responsibility Software Market, By Region, 2019-2032 (USD Billion).
6. Global Large Enterprise Corporate Social Responsibility Software Market, By Region, 2019-2032 (USD Billion)
7. North America Corporate Social Responsibility Software Market, By Deployment, 2019-2032 (USD Billion)
8. North America Corporate Social Responsibility Software Market, By Application, 2019-2032 (USD Billion)
9. U.S. Corporate Social Responsibility Software Market, By Deployment, 2019-2032 (USD Billion)
10. U.S. Corporate Social Responsibility Software Market, By Application, 2019-2032 (USD Billion)
11. Canada Corporate Social Responsibility Software Market, By Deployment, 2019-2032 (USD Billion)
12. Canada Corporate Social Responsibility Software Market, By Application, 2019-2032 (USD Billion)
13. Mexico Corporate Social Responsibility Software Market, By Deployment, 2019-2032 (USD Billion)
14. Mexico Corporate Social Responsibility Software Market, By Application, 2019-2032 (USD Billion)
15. Europe Corporate Social Responsibility Software Market, By Deployment, 2019-2032 (USD Billion)
16. Europe Corporate Social Responsibility Software Market, By Application, 2019-2032 (USD Billion)
17. Germany Corporate Social Responsibility Software Market, By Deployment, 2019-2032 (USD Billion)
18. Germany Corporate Social Responsibility Software Market, By Application, 2019-2032 (USD Billion)
19. France Corporate Social Responsibility Software Market, By Deployment 2019-2032 (USD Billion)
20. France Corporate Social Responsibility Software Market, By Application, 2019-2032 (USD Billion)
21. U.K. Corporate Social Responsibility Software Market, By Deployment, 2019-2032 (USD Billion)
22. U.K. Corporate Social Responsibility Software Market, By Application, 2019-2032 (USD Billion)
23. Italy Corporate Social Responsibility Software Market, By Deployment, 2019-2032 (USD Billion)
24. Italy Corporate Social Responsibility Software Market, By Application, 2019-2032 (USD Billion)
25. Spain Corporate Social Responsibility Software Market, By Deployment, 2019-2032 (USD Billion)
26. Spain Corporate Social Responsibility Software Market, By Application, 2019-2032 (USD Billion)
27. Asia Pacific Corporate Social Responsibility Software Market, By Deployment, 2019-2032 (USD Billion)
28. Asia Pacific Corporate Social Responsibility Software Market, By Application, 2019-2032 (USD Billion)
29. Japan Corporate Social Responsibility Software Market, By Deployment, 2019-2032 (USD Billion)
30. Japan Corporate Social Responsibility Software Market, By Application, 2019-2032 (USD Billion)
31. China Corporate Social Responsibility Software Market, By Deployment 2019-2032 (USD Billion)
32. China Corporate Social Responsibility Software Market, By Application, 2019-2032 (USD Billion)
33. India Corporate Social Responsibility Software Market, By Deployment 2019-2032 (USD Billion)
34. India Corporate Social Responsibility Software Market, By Application, 2019-2032 (USD Billion)
35. South America Corporate Social Responsibility Software Market, By Deployment, 2019-2032 (USD Billion)
36. South America Corporate Social Responsibility Software Market, By Application, 2019-2032 (USD Billion)
37. Brazil Corporate Social Responsibility Software Market, By Deployment 2019-2032 (USD Billion)
38. Brazil Corporate Social Responsibility Software Market, By Application, 2019-2032 (USD Billion)
39. Middle East and Africa Corporate Social Responsibility Software Market, By Deployment, 2019-2032 (USD Billion)
40. Middle East and Africa Corporate Social Responsibility Software Market, By Application, 2019-2032 (USD Billion)
41. UAE Corporate Social Responsibility Software Market, By Deployment, 2019-2032 (USD Billion)
42. UAE Corporate Social Responsibility Software Market, By Application, 2019-2032 (USD Billion)
43. South Africa Corporate Social Responsibility Software Market, By Deployment 2019-2032 (USD Billion)
44. South Africa Corporate Social Responsibility Software Market, By Application, 2019-2032 (USD Billion)
List of Figures
1. Global Corporate Social Responsibility Software Market Segmentation
2. Corporate Social Responsibility Software Market: Research Methodology
3. Market Size Estimation Methodology: Bottom-Up Approach
4. Market Size Estimation Methodology: Top-Down Approach
5. Data Triangulation
6. Porter’s Five Forces Analysis
7. Value Chain Analysis
8. Global Corporate Social Responsibility Software Market Attractiveness Analysis by Deployment
9. Global Corporate Social Responsibility Software Market Attractiveness Analysis by Application
10. Global Corporate Social Responsibility Software Market Attractiveness Analysis by Region
11. Global Corporate Social Responsibility Software Market: Dynamics
12. Global Corporate Social Responsibility Software Market Share by Deployment (2022 & 2032)
13. Global Corporate Social Responsibility Software Market Share by Application (2022 & 2032)
14. Global Corporate Social Responsibility Software Market Share by Regions (2022 & 2032)
15. Global Corporate Social Responsibility Software Market Share by Company (2022)
This study forecasts revenue at global, regional, and country levels from 2019 to 2032. The Brainy Insights has segmented the global corporate social responsibility software market based on below mentioned segments:
Global Corporate Social Responsibility Software Market Deployment:
Global Corporate Social Responsibility Software Market Nutrition Application:
Global Corporate Social Responsibility Software Market by Region:
Research has its special purpose to undertake marketing efficiently. In this competitive scenario, businesses need information across all industry verticals; the information about customer wants, market demand, competition, industry trends, distribution channels etc. This information needs to be updated regularly because businesses operate in a dynamic environment. Our organization, The Brainy Insights incorporates scientific and systematic research procedures in order to get proper market insights and industry analysis for overall business success. The analysis consists of studying the market from a miniscule level wherein we implement statistical tools which helps us in examining the data with accuracy and precision.
Our research reports feature both; quantitative and qualitative aspects for any market. Qualitative information for any market research process are fundamental because they reveal the customer needs and wants, usage and consumption for any product/service related to a specific industry. This in turn aids the marketers/investors in knowing certain perceptions of the customers. Qualitative research can enlighten about the different product concepts and designs along with unique service offering that in turn, helps define marketing problems and generate opportunities. On the other hand, quantitative research engages with the data collection process through interviews, e-mail interactions, surveys and pilot studies. Quantitative aspects for the market research are useful to validate the hypotheses generated during qualitative research method, explore empirical patterns in the data with the help of statistical tools, and finally make the market estimations.
The Brainy Insights offers comprehensive research and analysis, based on a wide assortment of factual insights gained through interviews with CXOs and global experts and secondary data from reliable sources. Our analysts and industry specialist assume vital roles in building up statistical tools and analysis models, which are used to analyse the data and arrive at accurate insights with exceedingly informative research discoveries. The data provided by our organization have proven precious to a diverse range of companies, facilitating them to address issues such as determining which products/services are the most appealing, whether or not customers use the product in the manner anticipated, the purchasing intentions of the market and many others.
Our research methodology encompasses an idyllic combination of primary and secondary initiatives. Key phases involved in this process are listed below:

The phase involves the gathering and collecting of market data and its related information with the help of different sources & research procedures.

The data procurement stage involves in data gathering and collecting through various data sources.
This stage involves in extensive research. These data sources includes:
Purchased Database: Purchased databases play a crucial role in estimating the market sizes irrespective of the domain. Our purchased database includes:
Primary Research: The Brainy Insights interacts with leading companies and experts of the concerned domain to develop the analyst team’s market understanding and expertise. It improves and substantiates every single data presented in the market reports. Primary research mainly involves in telephonic interviews, E-mail interactions and face-to-face interviews with the raw material providers, manufacturers/producers, distributors, & independent consultants. The interviews that we conduct provides valuable data on market size and industry growth trends prevailing in the market. Our organization also conducts surveys with the various industry experts in order to gain overall insights of the industry/market. For instance, in healthcare industry we conduct surveys with the pharmacists, doctors, surgeons and nurses in order to gain insights and key information of a medical product/device/equipment which the customers are going to usage. Surveys are conducted in the form of questionnaire designed by our own analyst team. Surveys plays an important role in primary research because surveys helps us to identify the key target audiences of the market. Additionally, surveys helps to identify the key target audience engaged with the market. Our survey team conducts the survey by targeting the key audience, thus gaining insights from them. Based on the perspectives of the customers, this information is utilized to formulate market strategies. Moreover, market surveys helps us to understand the current competitive situation of the industry. To be precise, our survey process typically involve with the 360 analysis of the market. This analytical process begins by identifying the prospective customers for a product or service related to the market/industry to obtain data on how a product/service could fit into customers’ lives.

Secondary Research: The secondary data sources includes information published by the on-profit organizations such as World bank, WHO, company fillings, investor presentations, annual reports, national government documents, statistical databases, blogs, articles, white papers and others. From the annual report, we analyse a company’s revenue to understand the key segment and market share of that organization in a particular region. We analyse the company websites and adopt the product mapping technique which is important for deriving the segment revenue. In the product mapping method, we select and categorize the products offered by the companies catering to domain specific market, deduce the product revenue for each of the companies so as to get overall estimation of the market size. We also source data and analyses trends based on information received from supply side and demand side intermediaries in the value chain. The supply side denotes the data gathered from supplier, distributor, wholesaler and the demand side illustrates the data gathered from the end customers for respective market domain.

The supply side for a domain specific market is analysed by:
The demand side for the market is estimated through:
In-house Library: Apart from these third-party sources, we have our in-house library of qualitative and quantitative information. Our in-house database includes market data for various industry and domains. These data are updated on regular basis as per the changing market scenario. Our library includes, historic databases, internal audit reports and archives.
Sometimes there are instances where there is no metadata or raw data available for any domain specific market. For those cases, we use our expertise to forecast and estimate the market size in order to generate comprehensive data sets. Our analyst team adopt a robust research technique in order to produce the estimates:
Data Synthesis: This stage involves the analysis & mapping of all the information obtained from the previous step. It also involves in scrutinizing the data for any discrepancy observed while data gathering related to the market. The data is collected with consideration to the heterogeneity of sources. Robust scientific techniques are in place for synthesizing disparate data sets and provide the essential contextual information that can orient market strategies. The Brainy Insights has extensive experience in data synthesis where the data passes through various stages:


Market Deduction & Formulation: The final stage comprises of assigning data points at appropriate market spaces so as to deduce feasible conclusions. Analyst perspective & subject matter expert based holistic form of market sizing coupled with industry analysis also plays a crucial role in this stage.
This stage involves in finalization of the market size and numbers that we have collected from data integration step. With data interpolation, it is made sure that there is no gap in the market data. Successful trend analysis is done by our analysts using extrapolation techniques, which provide the best possible forecasts for the market.
Data Validation & Market Feedback: Validation is the most important step in the process. Validation & re-validation via an intricately designed process helps us finalize data-points to be used for final calculations.

The Brainy Insights interacts with leading companies and experts of the concerned domain to develop the analyst team’s market understanding and expertise. It improves and substantiates every single data presented in the market reports. The data validation interview and discussion panels are typically composed of the most experienced industry members. The participants include, however, are not limited to:
Moreover, we always validate our data and findings through primary respondents from all the major regions we are working on.


Free Customization
Fortune 500 Clients
Free Yearly Update On Purchase Of Multi/Corporate License
Companies Served Till Date