- +1-315-215-1633
- sales@thebrainyinsights.com

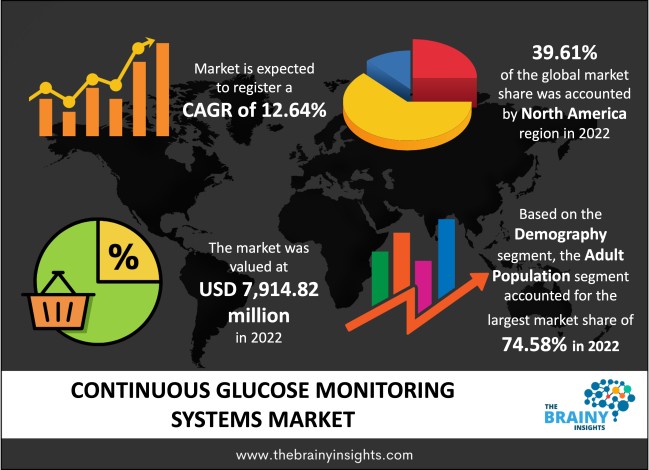
The global continuous glucose monitoring systems market is anticipated to reach USD 26,023.61 million by 2032, at a CAGR of 12.64% from 2023 to 2032. The surging incidence of diabetes and the growing acceptance of continuous glucose monitoring (CGM) systems drive the market's growth. Further, the growing elderly population, increasing demand for diagnostics, and unsatisfied healthcare needs are expected to drive the market share of the continuous glucose monitoring (CGM) systems market. Research and developments in the medical device industry for creating innovative continuous glucose monitoring systems will create positive scope for the continuous glucose monitoring (CGM) systems market in the upcoming period.
The continuous glucose monitoring (CGM) system is a medical device that measures and tracks blood sugar levels in real-time. People with type 2 diabetes and type 1 diabetes mainly use CGM systems to control their blood sugar and improve health and quality of life. These systems typically include a tiny sensor implanted beneath the skin to read glucose levels every few minutes, a transmitter that sends the data to a display device, and a monitor that interprets the data. Continuous glucose monitoring systems (CGMs) treat people with diabetes and other conditions to control their blood sugar levels and adjust their insulin or medications accordingly. These systems can also identify patterns in glucose levels and warn patients of potential problems early on.
Get an overview of this study by requesting a free sample
May 2022 - The U.S. Food and Drug Administration (FDA) has approved Abbott's FreeStyle Libre 3 system for continuous glucose monitoring in children. This will help Abbott to make a strong position in the continuous glucose monitoring system market.
June 2022 - Senseonics Inc., one of the leaders in implantable continuous glucose monitoring systems, has earned a CE Mark license for its innovative new continuous glucose monitoring system Eversense E3 in Europe. Eversense E3 is designed to continuously measure blood glucose levels for six months in diabetic patients 18 and older.
September 2022 - Medical technology company GlucoRx and UK-based Cardiff University have developed a non-invasive, multi-sensor continuous blood glucose monitoring (CGM) system. The system uses radio frequency technology and a multi-sensory approach to measure blood glucose levels exactly and non-invasively minute by minute.
December 2022 - The USA Food and Drug Administration (FDA) has approved Dexcom's continuous glucose monitoring system G7. Dexcom G7 is one of the exact & correct integrated glucose monitoring systems (iCGM). The approval will help Dexcom position firmly in the continuous glucose monitoring system market.
Increasing Diabetes Prevalence – There are several main reasons for the high prevalence of diabetes, including growing urbanization and sedentary lifestyles in both emerging and developed countries. There is also a significant increase in the majority of insulin-dependent type 1 and type 2 diabetes, which is the main reason behind the frequent acceptance of these continuous glucose monitoring systems worldwide. Additionally, there is an increasing need for diabetes monitoring systems/devices such as CGMs owing to many insulin-dependent diabetic patients, favourable refund policies and new innovative product launches by market players.
Real-Time Monitoring for 24*7 - Real-time monitoring (24*7) of insulin-dependent patients or patients with type 2 diabetes is now feasible due to the adoption of cutting-edge technologies such as continuous glucose monitoring systems. Moreover, continuous glucose monitoring (CGM) systems offer several advantages over SMBG (self-monitoring blood glucose) systems, including convenience, less intrusive, offer fast & correct data, and at the same time real-time monitoring. Therefore, these different benefits have played an essential role in changing the perception of CGM by patients and healthcare professionals.
High Cost - The rising cost of continuous glucose monitoring systems/devices is one of the primary causes hampering the surge of the global continuous glucose monitoring (CGM) systems market. Continuous glucose monitoring systems are more costly than standard blood glucose meters, as the highly advanced lifetime sensor is a primary factor affecting user acceptability, price, and inconvenience. Additionally, governments, insurance companies, and health plans in various countries do not reimburse CGM; thus, patients hesitate to accept CGM, limiting the market's growth.
Rising Government Support and R&D - Moreover, the medical industry in emerging countries is growing exponentially due to the increasing government investments in improving healthcare infrastructure, the growing need for improved healthcare services, and advances in research and development for healthcare activities in emerging economies.
Routine Inspection of Blood Glucose Levels - The continuous glucose monitoring (CGM) systems market is expected to experience a higher CAGR over the forecast period because it can monitor patients' glucose levels regularly. The growing reputation of continuous glucose monitoring (CGM) systems in both developed and developing countries has led to a massive growth of this market and the application of this cutting-edge technology in various industry sections. For example, a report published (2021) by Wiley concluded that continuous glucose monitoring systems are more valuable than self-monitored blood glucose in controlling and managing diabetes due to their minimally invasive process, ease of use and rapid results.
Lower Diagnosis Rate of Diabetes & Treatment - A large proportion of the population with undiagnosed diabetes is one of the main reasons for the low adoption of continuous glucose monitoring systems, especially in emerging countries. Countries such as Brazil, India, South Africa, China, and others have higher rates of delay in testing and diagnosis than wealthier countries owing to general ignorance about chronic diseases such as diabetes. Moreover, the market's growth is hindered by the need for more modern advanced procedures in public or private institutions and limited access to advanced healthcare infrastructure.
The regions analyzed for the market include North America, South America, Europe, Asia Pacific, and the Middle East & Africa.
North America generated the highest market share in 2022 and is projected to witness a prominent rise over the forecast period because of the rising prevalence of diabetes and increasing awareness of continuous glucose monitoring systems among users such as diabetics. South America is projected to witness a steady boost over the forecast period due to the increasing awareness of CGM systems among diabetic patients in the region.
Europe is expected to rise at a profitable rate from 2023 to 2032 due to the increasing older population, increasing rate of type 2 diabetes, rising activity in investments in research and development, and increased need for glucose monitors in healthcare settings.
The Asia-Pacific region is projected to achieve the highest growth rate due to the growing population base of elderly diabetics and increasing government expenditure to deliver better quality healthcare services in different regions, including developing regions such as China and India. The Middle East and Africa (MEA) market is projected to rise at a modest percentage over the forecast period due to the growing number of diabetes mellitus, limited knowledge of continuous diabetes monitoring systems and narrow access to advanced systems/devices among people.
North America Region Continuous Glucose Monitoring Systems Market Share in 2022 - 39.61%
www.thebrainyinsights.com
Check the geographical analysis of this market by requesting a free sample
The component section is divided into sensors, transmitters, receivers and insulin pumps. The sensors segment achieved the largest market share in 2022. Technological developments to enhance the efficiency of these sensors are projected to boost the surge of the segment over the forecast period (2023-2032). The sensor, the most complex part of a continuous glucose monitor system, is made of a wire (metallic filament) slimmer than a sewing needle inserted into the layer of fat under the skin. The sensors' technology is marginally distinct from that used in transmitters and receivers. Glucose oxidase is used to reveal blood sugar levels. The receiver segment will likely rise at the highest rate over the forecast period. A receiver, also called a reader, is a smartphone app or device that presents real-time blood glucose details from a sensor. Some systems offer apps for viewing these details, while continuous glucose monitoring systems from Abbott and Dexcom offer individual small movable devices. These devices are beneficial for end users who do not have smartphones.
The demography section includes the child population and adult population. In 2022, the continuous glucose monitoring (CGM) systems market was dominated by the adult demographic segment and this trend is expected to carry over the forecast period. This is due to the increasing majority of diabetes and a growing number of older people. A continuous glucose monitoring system is an ideal tool for controlling diabetes in adults because this is a 'turnkey' treatment that is highly effective in controlling & managing diabetes and is a very cost adequate system for working category/employees, which leads to its promotion as well as adoption by these people.
The application segment includes type-1 diabetes, type-2 diabetes, and gestational diabetes. The type 2 diabetes segment accounted for the highest market share of the continuous glucose monitoring (CGM) systems market in 2022 due to the majority of insulin-dependent type 2 diabetics. Furthermore, the continuous glucose monitoring system is anticipated to be operated frequently in the type 1 diabetes population owing to its clinically proven efficacy in reducing the risk of hypoglycemia in these people.
The end user section includes home healthcare, hospitals, and others. The home healthcare segment reported the highest market share in 2022 and is projected to gain the maximum CAGR over the forecast period from 2023-2032. The continuous glucose monitoring (CGM) system provides patients with low insulin doses and helps constantly monitor blood sugar levels. The home healthcare segment is anticipated to increase the need for continuous glucose monitoring systems due to the expertise and easy monitoring of blood glucose levels. In addition, the increased susceptibility of people with diabetes during COVID-19 and the demand for the accurate management of blood sugar levels has led to an increase in its acceptance among end users (patients). The hospital segment will register a good market share over the forecast period owing to the increasing hospital visits of diabetic patients and premature difficulties of diabetes such as neuropathy, retinopathy, and nephropathy that require quick medical visits and hospitalization.
| Attribute | Description |
|---|---|
| Market Size | Revenue (USD Million), Volume (K Units), Price (USD/Unit) |
| Market size value in 2022 | USD 7,914.82 Million |
| Market size value in 2032 | USD 26,023.61 Million |
| CAGR (2023 to 2032) | 12.64% |
| Historical data | 2019-2021 |
| Base Year | 2022 |
| Forecast | 2023-2032 |
| Regional Segments | The regions are segmented into North America, South America, Asia Pacific, Europe, and Middle East and Africa. |
| Segments | Component, Demography, Application, and End User |
As per The Brainy Insights, the size of the continuous glucose monitoring systems market was valued at USD 7,914.82 million in 2022 to USD 26,023.61 million by 2032.
The global continuous glucose monitoring systems market is growing at a CAGR of 12.64% during the forecast period 2023-2032.
The North America region became the largest market for continuous glucose monitoring systems.
Increasing diabetes prevalence is influencing the market's growth.
1. Introduction
1.1. Objectives of the Study
1.2. Market Definition
1.3. Research Scope
1.4. Currency
1.5. Key Target Audience
2. Research Methodology and Assumptions
3. Executive Summary
4. Premium Insights
4.1. Porter’s Five Forces Analysis
4.2. Value Chain Analysis
4.3. Top Investment Pockets
4.3.1. Market Attractiveness Analysis by Component
4.3.2. Market Attractiveness Analysis by Demography
4.3.3. Market Attractiveness Analysis by Application
4.3.4. Market Attractiveness Analysis by End User
4.3.5. Market Attractiveness Analysis by Region
4.4. Industry Trends
5. Market Dynamics
5.1. Market Evaluation
5.2. Drivers
5.2.1. Increasing diabetes prevalence
5.2.2. Real-time monitoring for 24*7
5.3. Restraints
5.3.1. High cost
5.4. Opportunities
5.4.1. Rising government support and R&D
5.4.2. Routine inspection of blood glucose levels
5.5. Challenges
5.5.1. Lower diagnosis rate of diabetes & treatment
6. Global Continuous Glucose Monitoring Systems Market Analysis and Forecast, By Component
6.1. Segment Overview
6.2. Sensors
6.3. Transmitters
6.4. Receivers
6.5. Insulin Pumps
7. Global Continuous Glucose Monitoring Systems Market Analysis and Forecast, By Demography
7.1. Segment Overview
7.2. Child Population
7.3. Adult Population
8. Global Continuous Glucose Monitoring Systems Market Analysis and Forecast, By Application
8.1. Segment Overview
8.2. Type-1 Diabetes
8.3. Type-2 Diabetes
8.4. Gestational Diabetes
9. Global Continuous Glucose Monitoring Systems Market Analysis and Forecast, By End User
9.1. Segment Overview
9.2. Home Healthcare
9.3. Hospitals
9.4. Others
10. Global Continuous Glucose Monitoring Systems Market Analysis and Forecast, By Regional Analysis
10.1. Segment Overview
10.2. North America
10.2.1. U.S.
10.2.2. Canada
10.2.3. Mexico
10.3. Europe
10.3.1. Germany
10.3.2. France
10.3.3. U.K.
10.3.4. Italy
10.3.5. Spain
10.4. Asia-Pacific
10.4.1. Japan
10.4.2. China
10.4.3. India
10.5. South America
10.5.1. Brazil
10.6. Middle East and Africa
10.6.1. UAE
10.6.2. South Africa
11. Global Continuous Glucose Monitoring Systems Market-Competitive Landscape
11.1. Overview
11.2. Market Share of Key Players in the Continuous Glucose Monitoring Systems Market
11.2.1. Global Company Market Share
11.2.2. North America Company Market Share
11.2.3. Europe Company Market Share
11.2.4. APAC Company Market Share
11.3. Competitive Situations and Trends
11.3.1. Product Launches and Developments
11.3.2. Partnerships, Collaborations, and Agreements
11.3.3. Mergers & Acquisitions
11.3.4. Expansions
12. Company Profiles
12.1. Abbott Laboratories
12.1.1. Business Overview
12.1.2. Company Snapshot
12.1.3. Company Market Share Analysis
12.1.4. Company Product Portfolio
12.1.5. Recent Developments
12.1.6. SWOT Analysis
12.2. Animas
12.2.1. Business Overview
12.2.2. Company Snapshot
12.2.3. Company Market Share Analysis
12.2.4. Company Product Portfolio
12.2.5. Recent Developments
12.2.6. SWOT Analysis
12.3. A. Menarini Diagnostics S.r.l
12.3.1. Business Overview
12.3.2. Company Snapshot
12.3.3. Company Market Share Analysis
12.3.4. Company Product Portfolio
12.3.5. Recent Developments
12.3.6. SWOT Analysis
12.4. AgaMatrix
12.4.1. Business Overview
12.4.2. Company Snapshot
12.4.3. Company Market Share Analysis
12.4.4. Company Product Portfolio
12.4.5. Recent Developments
12.4.6. SWOT Analysis
12.5. Ascensia Diabetes Care
12.5.1. Business Overview
12.5.2. Company Snapshot
12.5.3. Company Market Share Analysis
12.5.4. Company Product Portfolio
12.5.5. Recent Developments
12.5.6. SWOT Analysis
12.6. B Braun Melsungen AG
12.6.1. Business Overview
12.6.2. Company Snapshot
12.6.3. Company Market Share Analysis
12.6.4. Company Product Portfolio
12.6.5. Recent Developments
12.6.6. SWOT Analysis
12.7. Biolinq
12.7.1. Business Overview
12.7.2. Company Snapshot
12.7.3. Company Market Share Analysis
12.7.4. Company Product Portfolio
12.7.5. Recent Developments
12.7.6. SWOT Analysis
12.8. DexCom, Inc.
12.8.1. Business Overview
12.8.2. Company Snapshot
12.8.3. Company Market Share Analysis
12.8.4. Company Product Portfolio
12.8.5. Recent Developments
12.8.6. SWOT Analysis
12.9. Echo Therapeutics, Inc.
12.9.1. Business Overview
12.9.2. Company Snapshot
12.9.3. Company Market Share Analysis
12.9.4. Company Product Portfolio
12.9.5. Recent Developments
12.9.6. SWOT Analysis
12.10. F. Hoffman-La Roche Ltd.
12.10.1. Business Overview
12.10.2. Company Snapshot
12.10.3. Company Market Share Analysis
12.10.4. Company Product Portfolio
12.10.5. Recent Developments
12.10.6. SWOT Analysis
12.11. GlySens Incorporated
12.11.1. Business Overview
12.11.2. Company Snapshot
12.11.3. Company Market Share Analysis
12.11.4. Company Product Portfolio
12.11.5. Recent Developments
12.11.6. SWOT Analysis
12.12. GE Healthcare
12.12.1. Business Overview
12.12.2. Company Snapshot
12.12.3. Company Market Share Analysis
12.12.4. Company Product Portfolio
12.12.5. Recent Developments
12.12.6. SWOT Analysis
12.13. GNC Holdings, LLC
12.13.1. Business Overview
12.13.2. Company Snapshot
12.13.3. Company Market Share Analysis
12.13.4. Company Product Portfolio
12.13.5. Recent Developments
12.13.6. SWOT Analysis
12.14. GlySure
12.14.1. Business Overview
12.14.2. Company Snapshot
12.14.3. Company Market Share Analysis
12.14.4. Company Product Portfolio
12.14.5. Recent Developments
12.14.6. SWOT Analysis
12.15. Insulet Corporation
12.15.1. Business Overview
12.15.2. Company Snapshot
12.15.3. Company Market Share Analysis
12.15.4. Company Product Portfolio
12.15.5. Recent Developments
12.15.6. SWOT Analysis
12.16. Johnson & Johnson
12.16.1. Business Overview
12.16.2. Company Snapshot
12.16.3. Company Market Share Analysis
12.16.4. Company Product Portfolio
12.16.5. Recent Developments
12.16.6. SWOT Analysis
12.17. LifeScan IP Holdings LLC
12.17.1. Business Overview
12.17.2. Company Snapshot
12.17.3. Company Market Share Analysis
12.17.4. Company Product Portfolio
12.17.5. Recent Developments
12.17.6. SWOT Analysis
12.18. Medtronic plc
12.18.1. Business Overview
12.18.2. Company Snapshot
12.18.3. Company Market Share Analysis
12.18.4. Company Product Portfolio
12.18.5. Recent Developments
12.18.6. SWOT Analysis
12.19. Medtrum Technologies, Inc.
12.19.1. Business Overview
12.19.2. Company Snapshot
12.19.3. Company Market Share Analysis
12.19.4. Company Product Portfolio
12.19.5. Recent Developments
12.19.6. SWOT Analysis
12.20. Nemaura Medical Inc.
12.20.1. Business Overview
12.20.2. Company Snapshot
12.20.3. Company Market Share Analysis
12.20.4. Company Product Portfolio
12.20.5. Recent Developments
12.20.6. SWOT Analysis
12.21. Novo Nordisk A/S
12.21.1. Business Overview
12.21.2. Company Snapshot
12.21.3. Company Market Share Analysis
12.21.4. Company Product Portfolio
12.21.5. Recent Developments
12.21.6. SWOT Analysis
12.22. NXP Semiconductors
12.22.1. Business Overview
12.22.2. Company Snapshot
12.22.3. Company Market Share Analysis
12.22.4. Company Product Portfolio
12.22.5. Recent Developments
12.22.6. SWOT Analysis
12.23. OrSense
12.23.1. Business Overview
12.23.2. Company Snapshot
12.23.3. Company Market Share Analysis
12.23.4. Company Product Portfolio
12.23.5. Recent Developments
12.23.6. SWOT Analysis
12.24. One Drop (Sano)
12.24.1. Business Overview
12.24.2. Company Snapshot
12.24.3. Company Market Share Analysis
12.24.4. Company Product Portfolio
12.24.5. Recent Developments
12.24.6. SWOT Analysis
12.25. Roche
12.25.1. Business Overview
12.25.2. Company Snapshot
12.25.3. Company Market Share Analysis
12.25.4. Company Product Portfolio
12.25.5. Recent Developments
12.25.6. SWOT Analysis
12.26. Senseonics Holdings, Inc.
12.26.1. Business Overview
12.26.2. Company Snapshot
12.26.3. Company Market Share Analysis
12.26.4. Company Product Portfolio
12.26.5. Recent Developments
12.26.6. SWOT Analysis
12.27. STMicroelectronics
12.27.1. Business Overview
12.27.2. Company Snapshot
12.27.3. Company Market Share Analysis
12.27.4. Company Product Portfolio
12.27.5. Recent Developments
12.27.6. SWOT Analysis
12.28. Terumo Corporation
12.28.1. Business Overview
12.28.2. Company Snapshot
12.28.3. Company Market Share Analysis
12.28.4. Company Product Portfolio
12.28.5. Recent Developments
12.28.6. SWOT Analysis
12.29. Tandem Diabetes Care
12.29.1. Business Overview
12.29.2. Company Snapshot
12.29.3. Company Market Share Analysis
12.29.4. Company Product Portfolio
12.29.5. Recent Developments
12.29.6. SWOT Analysis
12.30. Ypsomed AG
12.30.1. Business Overview
12.30.2. Company Snapshot
12.30.3. Company Market Share Analysis
12.30.4. Company Product Portfolio
12.30.5. Recent Developments
12.30.6. SWOT Analysis
List of Table
1. Global Continuous Glucose Monitoring Systems Market, By Component, 2019-2032 (USD Million) (K Units)
2. Global Sensors Continuous Glucose Monitoring Systems Market, By Region, 2019-2032 (USD Million) (K Units)
3. Global Transmitters Lights Continuous Glucose Monitoring Systems Market, By Region, 2019-2032 (USD Million) (K Units)
4. Global Receivers Continuous Glucose Monitoring Systems Market, By Region, 2019-2032 (USD Million) (K Units)
5. Global Insulin Pumps Continuous Glucose Monitoring Systems Market, By Region, 2019-2032 (USD Million) (K Units)
6. Global Continuous Glucose Monitoring Systems Market, By Demography, 2019-2032 (USD Million) (K Units)
7. Global Child Population Continuous Glucose Monitoring Systems Market, By Region, 2019-2032 (USD Million) (K Units)
8. Global Adult Population Continuous Glucose Monitoring Systems Market, By Region, 2019-2032 (USD Million) (K Units)
9. Global Continuous Glucose Monitoring Systems Market, By Application, 2019-2032 (USD Million) (K Units)
10. Global Type-1 Diabetes Continuous Glucose Monitoring Systems Market, By Region, 2019-2032 (USD Million) (K Units)
11. Global Type-2 Diabetes Continuous Glucose Monitoring Systems Market, By Region, 2019-2032 (USD Million) (K Units)
12. Global Gestational Diabetes Continuous Glucose Monitoring Systems Market, By Region, 2019-2032 (USD Million) (K Units)
13. Global Continuous Glucose Monitoring Systems Market, By End User, 2019-2032 (USD Million) (K Units)
14. Global Home Healthcare Continuous Glucose Monitoring Systems Market, By Region, 2019-2032 (USD Million) (K Units)
15. Global Hospitals Continuous Glucose Monitoring Systems Market, By Region, 2019-2032 (USD Million) (K Units)
16. Global Others Continuous Glucose Monitoring Systems Market, By Region, 2019-2032 (USD Million) (K Units)
17. Global Continuous Glucose Monitoring Systems Market, By Region, 2019-2032 (USD Million) (K Units)
18. North America Continuous Glucose Monitoring Systems Market, By Component, 2019-2032 (USD Million) (K Units)
19. North America Continuous Glucose Monitoring Systems Market, By Demography, 2019-2032 (USD Million) (K Units)
20. North America Continuous Glucose Monitoring Systems Market, By Application, 2019-2032 (USD Million) (K Units)
21. North America Continuous Glucose Monitoring Systems Market, By End User, 2019-2032 (USD Million) (K Units)
22. U.S. Continuous Glucose Monitoring Systems Market, By Component, 2019-2032 (USD Million) (K Units)
23. U.S. Continuous Glucose Monitoring Systems Market, By Demography, 2019-2032 (USD Million) (K Units)
24. U.S. Continuous Glucose Monitoring Systems Market, By Application, 2019-2032 (USD Million) (K Units)
25. U.S. Continuous Glucose Monitoring Systems Market, By End User, 2019-2032 (USD Million) (K Units)
26. Canada Continuous Glucose Monitoring Systems Market, By Component, 2019-2032 (USD Million) (K Units)
27. Canada Continuous Glucose Monitoring Systems Market, By Demography, 2019-2032 (USD Million) (K Units)
28. Canada Continuous Glucose Monitoring Systems Market, By Application, 2019-2032 (USD Million) (K Units)
29. Canada Continuous Glucose Monitoring Systems Market, By End User, 2019-2032 (USD Million) (K Units)
30. Mexico Continuous Glucose Monitoring Systems Market, By Component, 2019-2032 (USD Million) (K Units)
31. Mexico Continuous Glucose Monitoring Systems Market, By Demography, 2019-2032 (USD Million) (K Units)
32. Mexico Continuous Glucose Monitoring Systems Market, By Application, 2019-2032 (USD Million) (K Units)
33. Mexico Continuous Glucose Monitoring Systems Market, By End User, 2019-2032 (USD Million) (K Units)
34. Europe Continuous Glucose Monitoring Systems Market, By Component, 2019-2032 (USD Million) (K Units)
35. Europe Continuous Glucose Monitoring Systems Market, By Demography, 2019-2032 (USD Million) (K Units)
36. Europe Continuous Glucose Monitoring Systems Market, By Application, 2019-2032 (USD Million) (K Units)
37. Europe Continuous Glucose Monitoring Systems Market, By End User, 2019-2032 (USD Million) (K Units)
38. Germany Continuous Glucose Monitoring Systems Market, By Component, 2019-2032 (USD Million) (K Units)
39. Germany Continuous Glucose Monitoring Systems Market, By Demography, 2019-2032 (USD Million) (K Units)
40. Germany Continuous Glucose Monitoring Systems Market, By Application, 2019-2032 (USD Million) (K Units)
41. Germany Continuous Glucose Monitoring Systems Market, By End User, 2019-2032 (USD Million) (K Units)
42. France Continuous Glucose Monitoring Systems Market, By Component, 2019-2032 (USD Million) (K Units)
43. France Continuous Glucose Monitoring Systems Market, By Demography, 2019-2032 (USD Million) (K Units)
44. France Continuous Glucose Monitoring Systems Market, By Application, 2019-2032 (USD Million) (K Units)
45. France Continuous Glucose Monitoring Systems Market, By End User, 2019-2032 (USD Million) (K Units)
46. U.K. Continuous Glucose Monitoring Systems Market, By Component, 2019-2032 (USD Million) (K Units)
47. U.K. Continuous Glucose Monitoring Systems Market, By Demography, 2019-2032 (USD Million) (K Units)
48. U.K. Continuous Glucose Monitoring Systems Market, By Application, 2019-2032 (USD Million) (K Units)
49. U.K. Continuous Glucose Monitoring Systems Market, By End User, 2019-2032 (USD Million) (K Units)
50. Italy Continuous Glucose Monitoring Systems Market, By Component, 2019-2032 (USD Million) (K Units)
51. Italy Continuous Glucose Monitoring Systems Market, By Demography, 2019-2032 (USD Million) (K Units)
52. Italy Continuous Glucose Monitoring Systems Market, By Application, 2019-2032 (USD Million) (K Units)
53. Italy Continuous Glucose Monitoring Systems Market, By End User, 2019-2032 (USD Million) (K Units)
54. Spain Continuous Glucose Monitoring Systems Market, By Component, 2019-2032 (USD Million) (K Units)
55. Spain Continuous Glucose Monitoring Systems Market, By Demography, 2019-2032 (USD Million) (K Units)
56. Spain Continuous Glucose Monitoring Systems Market, By Application, 2019-2032 (USD Million) (K Units)
57. Spain Continuous Glucose Monitoring Systems Market, By End User, 2019-2032 (USD Million) (K Units)
58. Asia Pacific Continuous Glucose Monitoring Systems Market, By Component, 2019-2032 (USD Million) (K Units)
59. Asia Pacific Continuous Glucose Monitoring Systems Market, By Demography, 2019-2032 (USD Million) (K Units)
60. Asia Pacific Continuous Glucose Monitoring Systems Market, By Application, 2019-2032 (USD Million) (K Units)
61. Asia Pacific Continuous Glucose Monitoring Systems Market, By End User, 2019-2032 (USD Million) (K Units)
62. Japan Continuous Glucose Monitoring Systems Market, By Component, 2019-2032 (USD Million) (K Units)
63. Japan Continuous Glucose Monitoring Systems Market, By Demography, 2019-2032 (USD Million) (K Units)
64. Japan Continuous Glucose Monitoring Systems Market, By Application, 2019-2032 (USD Million) (K Units)
65. Japan Continuous Glucose Monitoring Systems Market, By End User, 2019-2032 (USD Million) (K Units)
66. China Continuous Glucose Monitoring Systems Market, By Component, 2019-2032 (USD Million) (K Units)
67. China Continuous Glucose Monitoring Systems Market, By Demography, 2019-2032 (USD Million) (K Units)
68. China Continuous Glucose Monitoring Systems Market, By Application, 2019-2032 (USD Million) (K Units)
69. China Continuous Glucose Monitoring Systems Market, By End User, 2019-2032 (USD Million) (K Units)
70. India Continuous Glucose Monitoring Systems Market, By Component, 2019-2032 (USD Million) (K Units)
71. India Continuous Glucose Monitoring Systems Market, By Demography, 2019-2032 (USD Million) (K Units)
72. India Continuous Glucose Monitoring Systems Market, By Application, 2019-2032 (USD Million) (K Units)
73. India Continuous Glucose Monitoring Systems Market, By End User, 2019-2032 (USD Million) (K Units)
74. South America Continuous Glucose Monitoring Systems Market, By Component, 2019-2032 (USD Million) (K Units)
75. South America Continuous Glucose Monitoring Systems Market, By Demography, 2019-2032 (USD Million) (K Units)
76. South America Continuous Glucose Monitoring Systems Market, By Application, 2019-2032 (USD Million) (K Units)
77. South America Continuous Glucose Monitoring Systems Market, By End User, 2019-2032 (USD Million) (K Units)
78. Brazil Continuous Glucose Monitoring Systems Market, By Component, 2019-2032 (USD Million) (K Units)
79. Brazil Continuous Glucose Monitoring Systems Market, By Demography, 2019-2032 (USD Million) (K Units)
80. Brazil Continuous Glucose Monitoring Systems Market, By Application, 2019-2032 (USD Million) (K Units)
81. Brazil Continuous Glucose Monitoring Systems Market, By End User, 2019-2032 (USD Million) (K Units)
82. Middle East and Africa Continuous Glucose Monitoring Systems Market, By Component, 2019-2032 (USD Million) (K Units)
83. Middle East and Africa Continuous Glucose Monitoring Systems Market, By Demography, 2019-2032 (USD Million) (K Units)
84. Middle East and Africa Continuous Glucose Monitoring Systems Market, By Application, 2019-2032 (USD Million) (K Units)
85. Middle East and Africa Continuous Glucose Monitoring Systems Market, By End User, 2019-2032 (USD Million) (K Units)
86. UAE Continuous Glucose Monitoring Systems Market, By Component, 2019-2032 (USD Million) (K Units)
87. UAE Continuous Glucose Monitoring Systems Market, By Demography, 2019-2032 (USD Million) (K Units)
88. UAE Continuous Glucose Monitoring Systems Market, By Application, 2019-2032 (USD Million) (K Units)
89. UAE Continuous Glucose Monitoring Systems Market, By End User, 2019-2032 (USD Million) (K Units)
90. South Africa Continuous Glucose Monitoring Systems Market, By Component, 2019-2032 (USD Million) (K Units)
91. South Africa Continuous Glucose Monitoring Systems Market, By Demography, 2019-2032 (USD Million) (K Units)
92. South Africa Continuous Glucose Monitoring Systems Market, By Application, 2019-2032 (USD Million) (K Units)
93. South Africa Continuous Glucose Monitoring Systems Market, By End User, 2019-2032 (USD Million) (K Units)
List of Figures
1. Global Continuous Glucose Monitoring Systems Market Segmentation
2. Continuous Glucose Monitoring Systems Market: Research Methodology
3. Market Size Estimation Methodology: Bottom-Up Approach
4. Market Size Estimation Methodology: Top-Down Approach
5. Data Triangulation
6. Porter’s Five Forces Analysis
7. Value Chain Analysis
8. Global Continuous Glucose Monitoring Systems Market Attractiveness Analysis by Component
9. Global Continuous Glucose Monitoring Systems Market Attractiveness Analysis by Demography
10. Global Continuous Glucose Monitoring Systems Market Attractiveness Analysis by Application
11. Global Continuous Glucose Monitoring Systems Market Attractiveness Analysis by End User
12. Global Continuous Glucose Monitoring Systems Market Attractiveness Analysis by Region
13. Global Continuous Glucose Monitoring Systems Market: Dynamics
14. Global Continuous Glucose Monitoring Systems Market Share by Component (2023 & 2032)
15. Global Continuous Glucose Monitoring Systems Market Share by Demography (2023 & 2032)
16. Global Continuous Glucose Monitoring Systems Market Share by Application (2023 & 2032)
17. Global Continuous Glucose Monitoring Systems Market Share by End User (2023 & 2032)
18. Global Continuous Glucose Monitoring Systems Market Share by Regions (2023 & 2032)
19. Global Continuous Glucose Monitoring Systems Market Share by Company (2022)
This study forecasts revenue at global, regional, and country levels from 2019 to 2032. The Brainy Insights has segmented the global continuous glucose monitoring systems market based on below-mentioned segments:
Global Continuous Glucose Monitoring Systems Market by Component:
Global Continuous Glucose Monitoring Systems Market by Demography:
Global Continuous Glucose Monitoring Systems Market by Application:
Global Continuous Glucose Monitoring Systems Market by End User:
Global Continuous Glucose Monitoring Systems Market by Region:
Research has its special purpose to undertake marketing efficiently. In this competitive scenario, businesses need information across all industry verticals; the information about customer wants, market demand, competition, industry trends, distribution channels etc. This information needs to be updated regularly because businesses operate in a dynamic environment. Our organization, The Brainy Insights incorporates scientific and systematic research procedures in order to get proper market insights and industry analysis for overall business success. The analysis consists of studying the market from a miniscule level wherein we implement statistical tools which helps us in examining the data with accuracy and precision.
Our research reports feature both; quantitative and qualitative aspects for any market. Qualitative information for any market research process are fundamental because they reveal the customer needs and wants, usage and consumption for any product/service related to a specific industry. This in turn aids the marketers/investors in knowing certain perceptions of the customers. Qualitative research can enlighten about the different product concepts and designs along with unique service offering that in turn, helps define marketing problems and generate opportunities. On the other hand, quantitative research engages with the data collection process through interviews, e-mail interactions, surveys and pilot studies. Quantitative aspects for the market research are useful to validate the hypotheses generated during qualitative research method, explore empirical patterns in the data with the help of statistical tools, and finally make the market estimations.
The Brainy Insights offers comprehensive research and analysis, based on a wide assortment of factual insights gained through interviews with CXOs and global experts and secondary data from reliable sources. Our analysts and industry specialist assume vital roles in building up statistical tools and analysis models, which are used to analyse the data and arrive at accurate insights with exceedingly informative research discoveries. The data provided by our organization have proven precious to a diverse range of companies, facilitating them to address issues such as determining which products/services are the most appealing, whether or not customers use the product in the manner anticipated, the purchasing intentions of the market and many others.
Our research methodology encompasses an idyllic combination of primary and secondary initiatives. Key phases involved in this process are listed below:

The phase involves the gathering and collecting of market data and its related information with the help of different sources & research procedures.

The data procurement stage involves in data gathering and collecting through various data sources.
This stage involves in extensive research. These data sources includes:
Purchased Database: Purchased databases play a crucial role in estimating the market sizes irrespective of the domain. Our purchased database includes:
Primary Research: The Brainy Insights interacts with leading companies and experts of the concerned domain to develop the analyst team’s market understanding and expertise. It improves and substantiates every single data presented in the market reports. Primary research mainly involves in telephonic interviews, E-mail interactions and face-to-face interviews with the raw material providers, manufacturers/producers, distributors, & independent consultants. The interviews that we conduct provides valuable data on market size and industry growth trends prevailing in the market. Our organization also conducts surveys with the various industry experts in order to gain overall insights of the industry/market. For instance, in healthcare industry we conduct surveys with the pharmacists, doctors, surgeons and nurses in order to gain insights and key information of a medical product/device/equipment which the customers are going to usage. Surveys are conducted in the form of questionnaire designed by our own analyst team. Surveys plays an important role in primary research because surveys helps us to identify the key target audiences of the market. Additionally, surveys helps to identify the key target audience engaged with the market. Our survey team conducts the survey by targeting the key audience, thus gaining insights from them. Based on the perspectives of the customers, this information is utilized to formulate market strategies. Moreover, market surveys helps us to understand the current competitive situation of the industry. To be precise, our survey process typically involve with the 360 analysis of the market. This analytical process begins by identifying the prospective customers for a product or service related to the market/industry to obtain data on how a product/service could fit into customers’ lives.

Secondary Research: The secondary data sources includes information published by the on-profit organizations such as World bank, WHO, company fillings, investor presentations, annual reports, national government documents, statistical databases, blogs, articles, white papers and others. From the annual report, we analyse a company’s revenue to understand the key segment and market share of that organization in a particular region. We analyse the company websites and adopt the product mapping technique which is important for deriving the segment revenue. In the product mapping method, we select and categorize the products offered by the companies catering to domain specific market, deduce the product revenue for each of the companies so as to get overall estimation of the market size. We also source data and analyses trends based on information received from supply side and demand side intermediaries in the value chain. The supply side denotes the data gathered from supplier, distributor, wholesaler and the demand side illustrates the data gathered from the end customers for respective market domain.

The supply side for a domain specific market is analysed by:
The demand side for the market is estimated through:
In-house Library: Apart from these third-party sources, we have our in-house library of qualitative and quantitative information. Our in-house database includes market data for various industry and domains. These data are updated on regular basis as per the changing market scenario. Our library includes, historic databases, internal audit reports and archives.
Sometimes there are instances where there is no metadata or raw data available for any domain specific market. For those cases, we use our expertise to forecast and estimate the market size in order to generate comprehensive data sets. Our analyst team adopt a robust research technique in order to produce the estimates:
Data Synthesis: This stage involves the analysis & mapping of all the information obtained from the previous step. It also involves in scrutinizing the data for any discrepancy observed while data gathering related to the market. The data is collected with consideration to the heterogeneity of sources. Robust scientific techniques are in place for synthesizing disparate data sets and provide the essential contextual information that can orient market strategies. The Brainy Insights has extensive experience in data synthesis where the data passes through various stages:


Market Deduction & Formulation: The final stage comprises of assigning data points at appropriate market spaces so as to deduce feasible conclusions. Analyst perspective & subject matter expert based holistic form of market sizing coupled with industry analysis also plays a crucial role in this stage.
This stage involves in finalization of the market size and numbers that we have collected from data integration step. With data interpolation, it is made sure that there is no gap in the market data. Successful trend analysis is done by our analysts using extrapolation techniques, which provide the best possible forecasts for the market.
Data Validation & Market Feedback: Validation is the most important step in the process. Validation & re-validation via an intricately designed process helps us finalize data-points to be used for final calculations.

The Brainy Insights interacts with leading companies and experts of the concerned domain to develop the analyst team’s market understanding and expertise. It improves and substantiates every single data presented in the market reports. The data validation interview and discussion panels are typically composed of the most experienced industry members. The participants include, however, are not limited to:
Moreover, we always validate our data and findings through primary respondents from all the major regions we are working on.


Free Customization
Fortune 500 Clients
Free Yearly Update On Purchase Of Multi/Corporate License
Companies Served Till Date